Significance
The localization of proteins within the cell is assumed to be important for their function. However, we have limited understanding of protein relocalization in response to genetic changes or drug treatments and almost no understanding of the effects of protein relocation on cellular homeostasis. To address this, we have developed a method to systematically create protein fusions between a query protein and most other proteins in the cell. As proof of principle, we relocalized proteins to the kinetochore, a large protein complex essential for chromosome segregation and cell division. We identify a number of proteins that inhibit cell division via the kinetochore. One such interaction establishes a critical role for specific phosphorylation in kinetochore function.
Keywords: kinetochore, phosphatase, Mtw1, MIND, CDK
Abstract
The location of proteins within eukaryotic cells is often critical for their function and relocation of proteins forms the mainstay of regulatory pathways. To assess the importance of protein location to cellular homeostasis, we have developed a methodology to systematically create binary physical interactions between a query protein and most other members of the proteome. This method allows us to rapidly assess which of the thousands of possible protein interactions modify a phenotype. As proof of principle we studied the kinetochore, a multiprotein assembly that links centromeres to the microtubules of the spindle during cell division. In budding yeast, the kinetochores from the 16 chromosomes cluster together to a single location within the nucleus. The many proteins that make up the kinetochore are regulated through ubiquitylation and phosphorylation. By systematically associating members of the proteome to the kinetochore, we determine which fusions affect its normal function. We identify a number of candidate kinetochore regulators, including the phosphatase Cdc14. We examine where within the kinetochore Cdc14 can act and show that the effect is limited to regions that correlate with known phosphorylation sites, demonstrating the importance of serine phospho-regulation for normal kinetochore homeostasis.
The relocation of proteins between cellular compartments underlies many regulatory pathways. For example, protein relocation underpins most cell-signaling pathways (1) and the establishment of cell polarity and asymmetric cell division both require highly specialized relocation of proteins within the cell (2). Furthermore, the aberrant localization of proteins underlies the pathology of a number of diseases (3). However, our understanding of the effect of relocalizing members of the proteome is limited to specific studies typically concerning individual proteins, and only a select few studies have globally monitored protein relocation (4, 5).
One highly localized structure within the cell is the kinetochore, which in budding yeast forms a single megadalton complex (6–8). The kinetochore attaches chromosomes to the spindle microtubules to drive accurate chromosome segregation. The kinetochore consists of at least 60 unique gene products present in multiple copies that stretch from the specialized H3 histone subunit (Cse4, CENP-A in mammals) to the microtubule binding proteins of the Dam1 complex (9). Kinetochores normally assemble hierarchically from the centromere-bound proteins (10). Once assembled, the structural homeostasis of the kinetochore is regulated by proteins that are recruited to kinetochores. For example, the histone subunit Cse4 is tightly regulated by the E3 ubiquitin ligase Psh1, which is localized at centromeres. Psh1 prevents excessive Cse4 centromere loading via ubiquitylation-dependent degradation of Cse4 (and at noncentromeric regions) (11). Cse4 is also phosphorylated by Ipl1, likely to destabilize aberrant microtubule interactions and ensure correct sister chromosome biorientation (12). Another such modification is the phosphorylation and ubiquitylation of the MIND complex member Dsn1. Dsn1 is a target of both the cyclin-dependent kinase (CDK) and the Aurora kinase (Ipl1) (13, 14). Ipl1-dependent phosphorylation stabilizes Dsn1 and prevents its degradation by the Mub1/Ubr2 ubiquitin pathway. Additionally, the spindle assembly checkpoint, a key regulator of mitotic progression, is regulated via the selective, phospho-dependent, recruitment of proteins to the kinetochore (15–17). These data indicate that kinetochore homeostasis and mitotic control are regulated by posttranslational modifications and protein recruitment to the kinetochore.
To provide a map of kinetochore regulators, we wished to systematically recruit candidate proteins constitutively to the kinetochore and assay for a mitotic phenotype. To do this, we developed a system to artificially create protein–protein fusions across the proteome. We combined a GFP binding protein (18, 19) with a GFP library of strains (20) to create binary fusions between a kinetochore protein and most other proteins in the proteome. We used growth as a readout for kinetochore defects and any protein–protein interactions that affect growth we termed “synthetic physical interactions” or SPIs. We chose to study the kinetochore protein Mtw1, which is a conserved member of the MIND (Mis12) complex of the KMN (KNL1-Mis12-Ndc80) network of mid-/outer-kinetochore proteins (9). The SPI method identified proteins that, when bound to the kinetochore component Mtw1, cause a growth defect. For example, the Cdc14 phosphatase produces a SPI when bound to Mtw1. Cdc14 removes phosphates from CDK target sites, with a strong bias for phospho-serine over phospho-threonine (21). We then switched the GBP tag onto Cdc14 and used this to make fusions with GFP-tagged kinetochore proteins and show that the MIND complex, Dam1 complex, and COMA complex are all sensitive to constitutive Cdc14 binding. Thus, we created a map of regions within the kinetochore that are sensitive to constitutive Cdc14 phosphatase activity. In some cases these phosphorylation events have been mapped (22, 23) and studied in some detail (14); however, the role of Cdc14 in kinetochore function remains unclear (24, 25). This study establishes that phosphorylation of proteins at the kinetochore is essential for normal mitotic progression in yeast. The SPI methodology identifies specific protein–protein interactions that control a given phenotype and thus provides a powerful tool to study the spatial regulation of proteins at a systems level.
Results
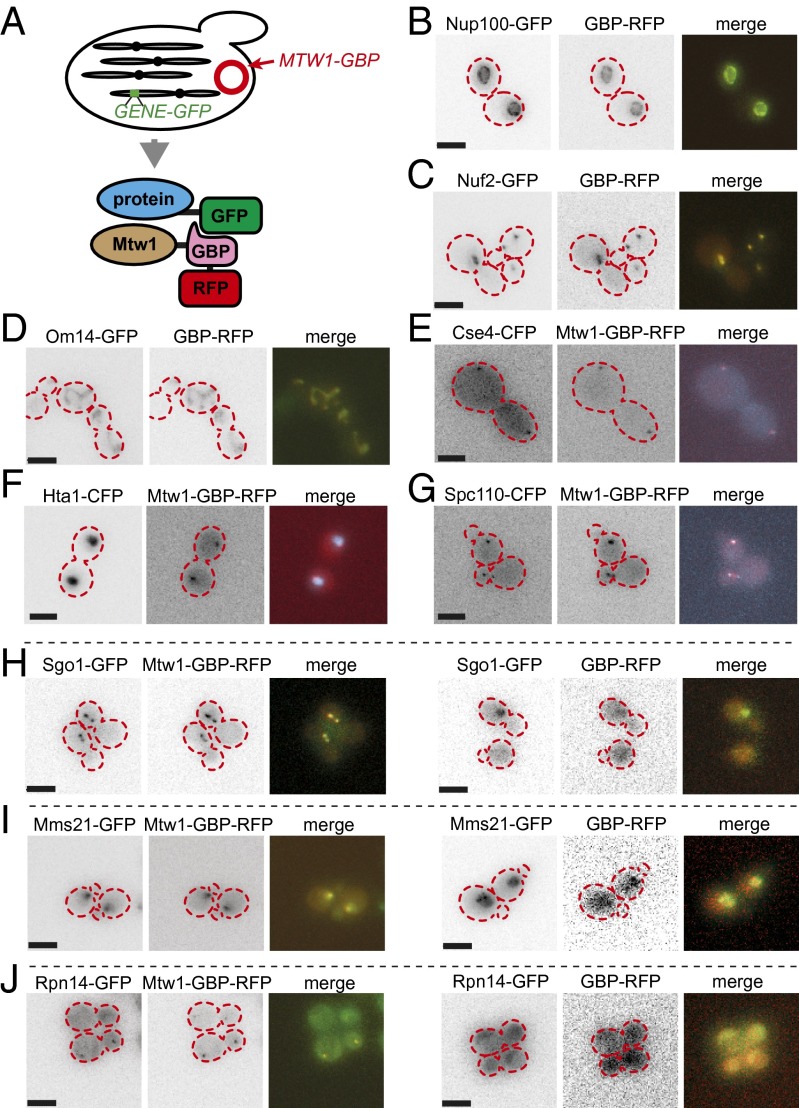
To identify regulators of kinetochore homeostasis we wanted to systematically and constitutively recruit specific proteins to the kinetochore. To achieve this aim, we made use of an antibody domain that binds with high affinity to GFP (18, 19), the GFP binding protein (GBP). We chose to study Mtw1, the yeast ortholog of human Mis12. Mtw1 is a member of the essential Mtw1/Mis12/MIND complex (Mtw1, Dsn1, Nnf1, and Nsl1) (26, 27). The MIND complex connects the inner constitutive centromere-associated network kinetochore proteins, which are adjacent to the centromeric DNA, with the outer, microtubule-associated proteins in conjunction with Mif2 (28–31). We linked the MTW1 kinetochore gene with that of the GBP (MTW1-GBP). By virtue of the RFP tag on the GBP, we can identify the Mtw1-GBP in live cells and confirm that it localizes with the kinetochore. A plasmid encoding Mtw1-GBP can be transferred into a library of GFP strains to allow us to sequentially fuse a GBP-tagged protein with an array of GFP-tagged proteins (Fig. 1A and Fig. S1A). We were readily able to delete the endogenous MTW1 gene from a strain containing the MTW1-GBP plasmid, indicating that the fusion is functional. We created two other constructs to control for the effects of both expressing MTW1 ectopically and for the nonspecific effects of GBP binding to GFP-tagged proteins. These controls were used as the basis for comparison with the MTW1-GBP. We confirmed that the GBP colocalizes in vivo to GFP-tagged proteins (Fig. 1 B–D). We expressed MTW1-GBP in cells encoding proteins tagged with CFP, to which the GBP does not bind, and found that this tagged version of Mtw1 colocalizes with the kinetochore (Fig. 1 E–G). Furthermore, we found that the Mtw1-GBP is sufficient to constitutively relocalize GFP-tagged proteins to the kinetochore (Fig. 1 H–J).
Fig. 1.
(A) The SPA methodology introduces a plasmid encoding, for example Mtw1-GBP (red circle) into an array of GFP strains. The Mtw1 query protein is fused with the GFP binding protein and also contains an RFP sequence to allow us to monitor its location. The GBP-RFP is efficiently recruited to GFP-tagged proteins in different cellular compartments in vivo, such as the nuclear pore (B, Nup100), the kinetochore (C, Nuf2), or the mitochondria (D, Om14). The Mtw1-GBP protein localizes to the kinetochore in the nucleus of yeast cells as indicated by its position relative to the kinetochore (E), nucleus (F), and spindle pole body (G). Mtw1-GBP colocalizes with three GFP-tagged proteins, which normally do not localize with Mtw1 (H–J). The three panels on the right show the normal localization of these proteins and the three panels on the left show their localization when bound to Mtw1. The GFP tagged proteins with GBP-RFP localize as previously reported [yeastgfp.yeastgenome.org (20)]. The cell boundaries are overlaid as red dashed lines. (Scale bars, 5 µm.)
Fig. S1.
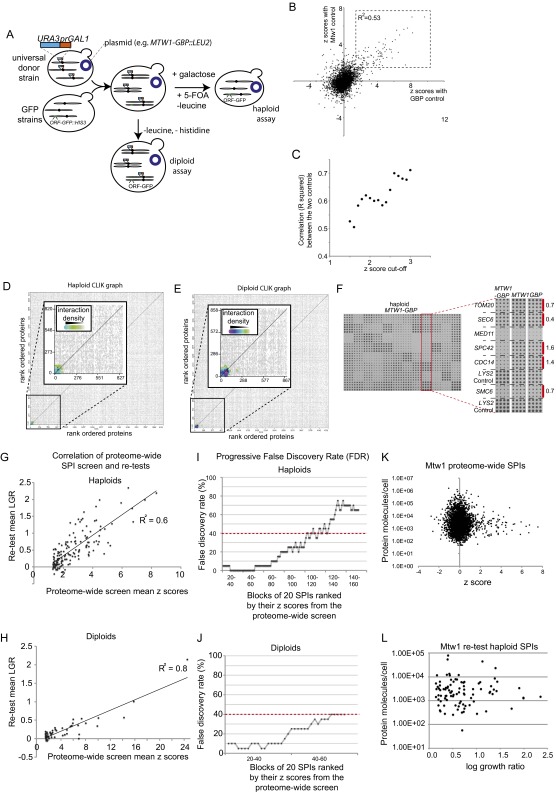
Using SPI screens to recruit proteins to the kinetochore. (A) The SPA method is illustrated. An array of MATa GFP strains is mated with a universal donor strain containing a specific plasmid. The UDS has a URA3::GALpromoter adjacent to each and every centromere. Thus, placing the resulting diploids on galactose medium drives expression through the centromeres, destabilizing them. Subsequent counter-selection against the URA3 gene, with 5-FOA, reverts the diploids back to haploids but now containing the specific plasmid. The diploids can also be maintained to examine dominant effects. (B) The z-scores from the two controls in the proteome-wide screen are plotted on each axis in a scatter graph and correlation of the affected strains is high (squared correlation coefficient, R2 = 0.53). (C) The correlation (R2) between the two controls is higher with increasing z-score. (D) The results of CLIK analysis show that the GFP-tagged proteins in the 100-most growth-restricted strains have a higher than average interaction density (Inset) An enlarged view of the top ∼800 proteins. (E) The CLIK analysis for the diploid screen is shown as in D; this also shows that only the top ∼100 SPIs show a high interaction density. (F) All candidate SPIs were retested using a high-density (16 replicate) retest. The data for eight strains is magnified as an inset, showing both strong (Spc42 and Cdc14) and weak interactions, highlighted in red, with the log growth ratio (LGR) indicated. Both the haploid (G) and diploid (H) retest data correlate well with the original proteome-wide analysis (Datasets S3 and S4). (I and J) The rate of false-discovery increases as the strength of the SPI decreases. (K and L) The strength of the SPI growth phenotype does not correlate with the amount of protein molecules per cell for the GFP-tagged protein.
Proteome-Wide Kinetochore Fusions.
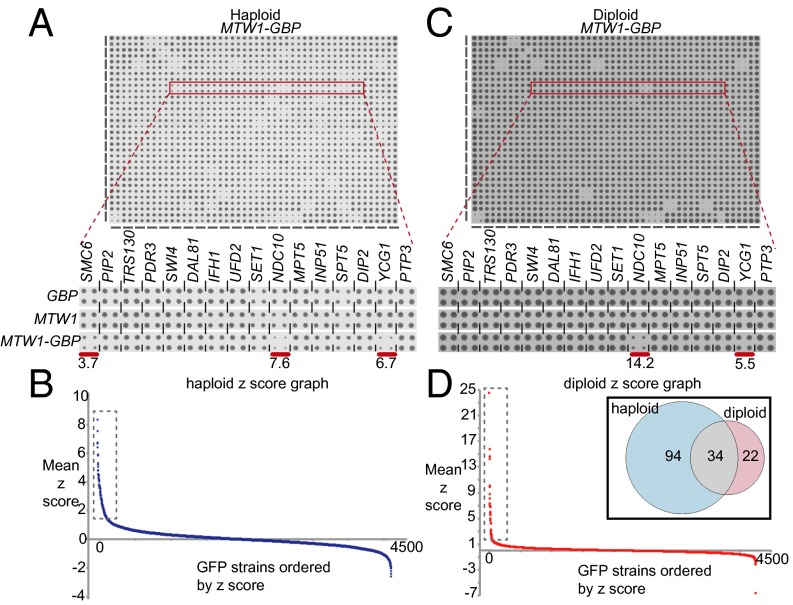
We transferred the MTW1-GBP plasmid and, separately, the two controls, MTW1 and GBP, into the GFP collection of strains using selective ploidy ablation (SPA) (32) (Fig. S1A), which produces arrays of haploid GFP-tagged strains, each containing one of the three plasmid constructs. The relative growth of the resulting strains was assessed by colony size, measured in quadruplicate for each strain, and quantified using the ScreenMill suite of software (33) (SI Text). An example of these data illustrates that specific GFP strains are restricted for growth with Mtw1-GBP compared with either of the two controls (Fig. 2A). Comparing the growth rate of strains expressing MTW1-GBP with either the MTW1 or the GBP control yielded well-correlated data for strains demonstrating a growth defect (Fig. S1 B and C), therefore we used the average growth relative to the two controls as a measure of growth effects (Fig. 2B). For these proteome-wide data, growth defects were quantified and then normalized using z-score. High z-scores indicate a growth defect produced by the Mtw1-GBP interaction with the GFP-tagged protein. Most forced interactions have no discernable growth effect upon the cells (z-score ∼0). Relative to the two controls, 128 GFP strains had a growth defect defined by an average z-score ≥ 1.5 (Dataset S1). We defined interactions that affect growth as SPIs. A number of these SPI proteins have essential functions in the cell and, although we controlled for nonspecific protein interactions, we wished to know how many of these interactions result from the relocalization of an essential GFP protein. We reasoned that these interactions would be suppressed by having an untagged version of the GFP-tagged protein present in the cell. Therefore, we modified the proteome-wide screen, retaining the cells as diploids that are heterozygously GFP-tagged (Fig. 2C and Fig. S1A). We assayed these diploid strains for growth, as previously described. The resulting growth rates (Fig. 2D) showed that 56 strains were inhibited from growth (z-score > 1.5) (Dataset S2), of which the majority (34 strains) were common with the haploid set of SPIs (Fig. 2D, Inset).
Fig. 2.
Mtw1 synthetic physical interactions. (A) An example of 384 yeast GFP strains each arrayed in quadruplicate. The MTW1-GBP construct is expressed in these strains and the growth of colonies on the plate are shown. (Inset) An example of 16 strains from the plate, three of which show growth restriction compared with the two controls (GBP and MTW1). The red bars indicate the three growth-restricted strains, with the z-score indicated. (B) Quantitation of the colony size allows us to calculate z-scores for each interaction (higher score indicates greater growth restriction). The strains are ranked based upon their z-score, with the most growth-restricted strains to the left. Only a relatively small subset of interactions affect growth; 128 strains have an average z-score greater than 1.5 (boxed group, full data in Dataset S1). (C) The same assay was repeated in heterozygously tagged diploid strains, where for each strain there is an untagged allele in addition to the GFP-tagged version. (Inset) The same 16 strains highlighted in A. (D) Quantitative analysis of the diploid screen shows that 56 strains are significantly restricted for growth (boxed group and Dataset S2). The inset Venn diagram indicating that a majority of the diploid SPIs (34 of 56) are common with those from the haploid screen.
SPIs Share Common Functions.
Because functionally related genes and proteins are enriched for interactions (genetic, physical, and so forth) (34, 35), we asked whether the Mtw1 SPIs were enriched for interactions from genomics and proteomics databases. We used the Cutoff Linked to Interaction Knowledge tool (CLIK) (36) to plot the interaction density of the haploid and diploid SPI screens (Fig. S1 D and E, respectively). The CLIK plot shows that both the haploid and diploid screens enrich for a set of ∼100 SPIs that have a high interaction density (i.e., are likely true positives). To assess the false discovery rate (FDR) and to corroborate the CLIK analysis we retested the haploid and diploid screens with the interactions that caused the strongest growth defects with 16 replicates. This high-density retest of the SPIs identified 112 haploid and 79 diploid SPIs (Datasets S3 and S4; for an example, see Fig. S1F). Of the original 34 SPIs that were common between haploid and diploid screens, only one failed to confirm; additionally, the high-density retest confirmed a number of additional SPIs. As a result, 61 Mtw1 SPIs are common between the haploid and diploid sets after high-density retesting. These data show that the SPI data are reproducible with good correlation of the proteome-wide z-scores with the high-density repeated data (Fig. S1 G and H). We also found that, as expected for quantitative screens, the FDR increased as the strength of the phenotype decreased (Fig. S1 I and J). Additionally, the number of confirmed SPIs was in good agreement with that predicted by the CLIK analysis. Finally, we asked whether SPIs correlate with protein abundance, because low-abundance proteins may be more susceptible to disruption simply based upon stoichiometric interaction with Mtw1-GBP, but we found no correlation (Fig. S1 K and L).
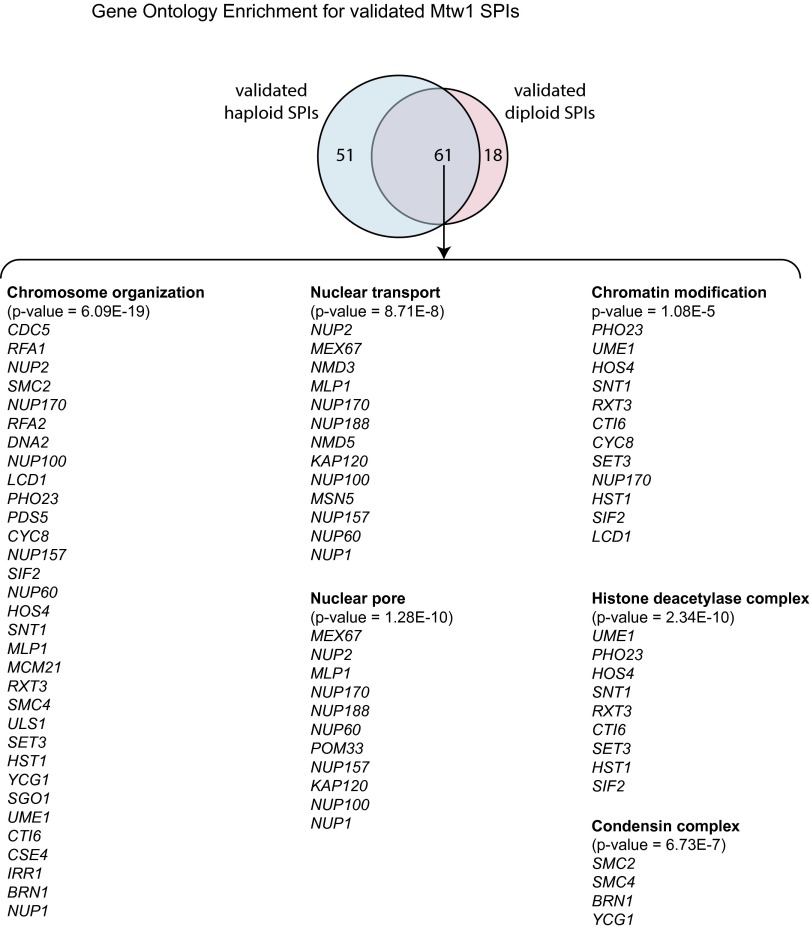
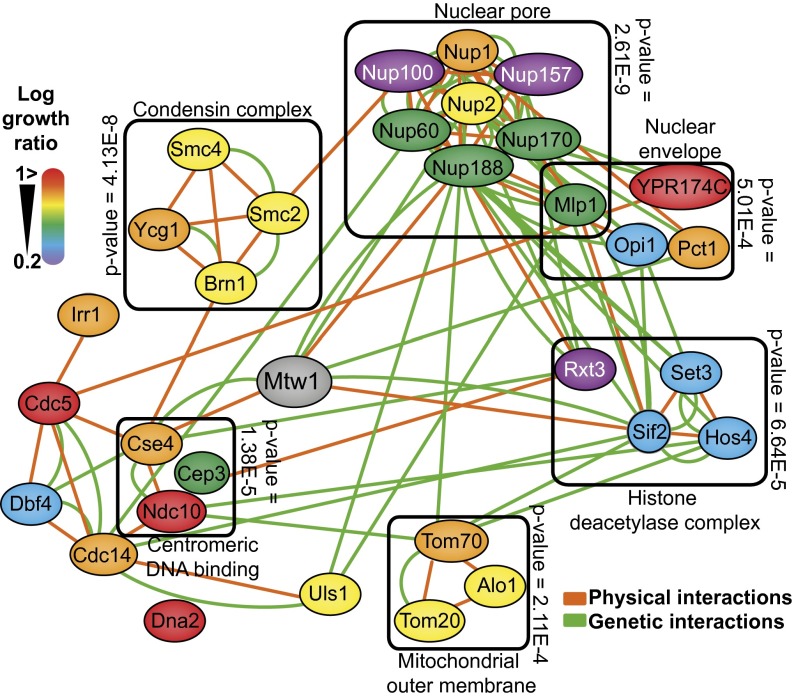
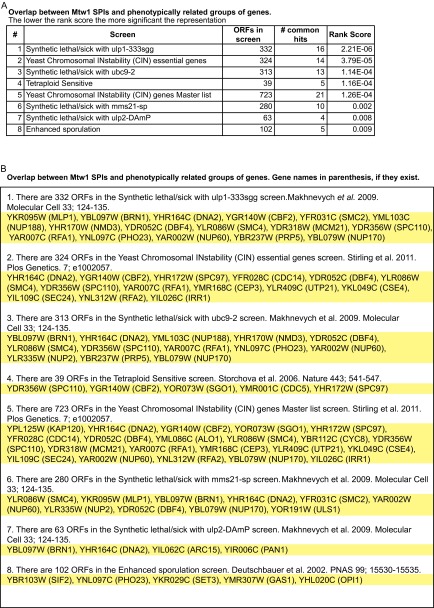
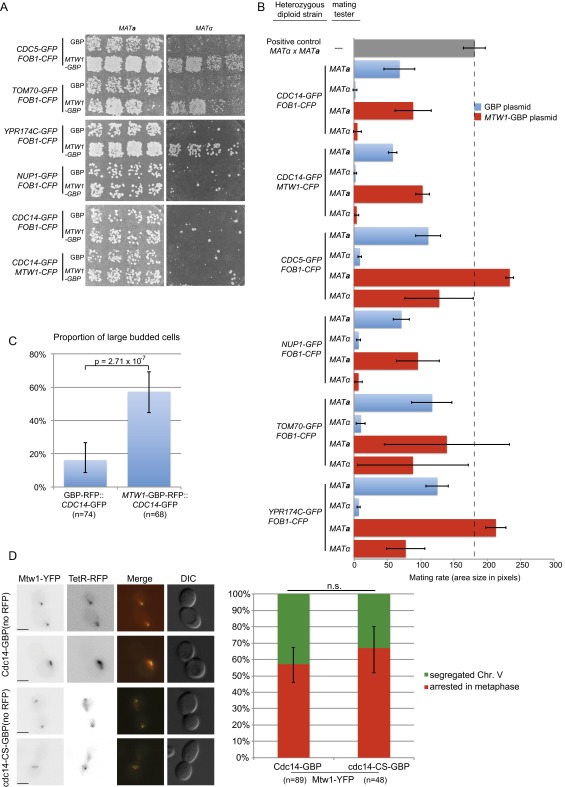
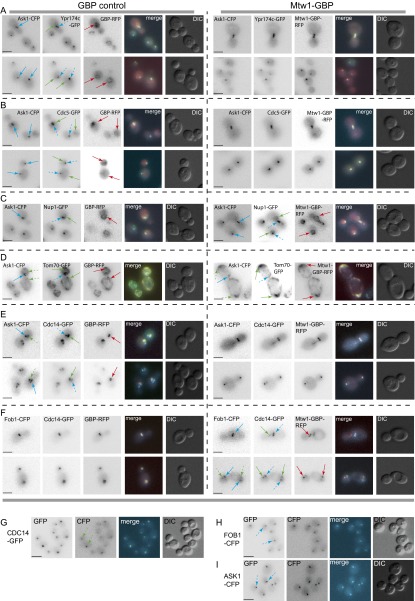
Collectively these data show that the SPI methodology is robust and identifies a set of proteins that are enriched for genetic and physical interactions, indicating that they share common functionality. To test this notion, we used gene ontology enrichment analysis (37) within the set of 61 confirmed SPIs, which when constitutively bound to the kinetochore result in a growth defect. These Mtw1 SPIs are significantly enriched for a number of different functional classes or protein complexes, including chromosome organization, histone modification/deacetylation, nuclear transport, the nuclear pore, and condensin (Fig. S2). This enrichment is illustrated for a subset of confirmed SPIs (Fig. 3). Furthermore, phenotype enrichment analysis (38) shows that mutants of the genes encoding the Mtw1 SPIs give both a chromosomal instability (CIN) phenotype and show synthetic lethality with proteins involved in sumoylation (Fig. S3). These data indicate that the Mtw1 SPIs are enriched for proteins that likely play an important role in kinetochore function. To ask whether CIN was associated with the SPI phenotype, we used an established assay for CIN (39) in diploid cells that encode a single GFP allele and contain the plasmid-encoded Mtw1-GBP. We found that of five Mtw1 SPIs tested, three show a clear CIN phenotype (Cdc5, Tom70, and Ypr174c) (Fig. S4 A and B). To test whether these SPI phenotypes were caused by association with the kinetochore or by movement of the kinetochore to a new location within the nucleus, we used fluorescence imaging. We found that Mtw1-GBP is sufficient to relocalize both Cdc5-GFP and Ypr174c-GFP to the kinetochore (Fig. S5 A and B, respectively). In contrast, the nucleoporin Nup1, when associated with Mtw1, moves the tagged version of Mtw1 into close association with the nuclear periphery without relocalizing the kinetochore structure itself (Fig. S5C). Association between the mitochondrial translocase Tom70 and Mtw1 leads to abnormal kinetochore foci (Fig. S5D). These imaging studies support the notion that the Mtw1-GBP recruits proteins to the kinetochore that are not tightly bound structural components (such as Cdc5); however, proteins such as Nup1 and Tom70, which are tightly bound to defined structural complexes, do not relocalize. We cannot rule out that relocation of some Mtw1 from the kinetochore does not, at least partially, contribute to the SPI phenotype. The GFP–GBP interaction itself is strong (19) and this creates a molecular “tug-of-war” between the two tagged proteins.
Fig. S2.
Gene ontology analysis of the Mtw1 SPIs. The output from “Gorilla” ontology enrichment analysis is illustrated (cbl-gorilla.cs.technion.ac.il/). The most statistically significant enrichments of functions and complexes are shown with the genes that fall within each category listed.
Fig. 3.
Mtw1 SPI network. A subset of the confirmed Mtw1 SPIs (a group of 31 SPIs that were common between haploid and diploids in both the proteome-wide analysis and also the high-density retest) are shown as nodes, color coded according to the strength of the SPI (red indicates strong interactions, purple indicates weak interactions). The enriched genetic and physical interactions between these proteins are indicated by green and orange edges, respectively. A selection of the gene ontology enrichment for this set of proteins is indicated by grouping related proteins in boxes with the associated P value of enrichment.
Fig. S3.
Phenotypic enrichment of the Mtw1 SPIs. The output from the Screentroll analysis (www.rothsteinlab.com/tools/apps/screenTroll) highlights the overlap between the Mtw1-SPIs and published groups of genes that share a common phenotype. The most statistically significant overlaps are shown (A) and the specific genes that cause the overlap are listed (B).
Fig. S4.
Kinetochore SPIs can produce a CIN. A selection of SPIs were recreated in diploid cells (heterozygous for the GFP tag). These diploids, which contain either the GBP or MTW1-GBP plasmids, were patched onto plates and mated with either MATa or MATα strains. (A) We found that the MTW1-GBP plasmid causes three GFP strains to have elevated chromosome loss (TOM70, YPR174C, and CDC5). In contrast, we found no increased chromosome loss for the Mtw1-Cdc14 SPI. (B) These data are quantified and shown relative to both positive and negative controls; the error bars are SD of the mean. (C) The Mtw1-Cdc14 SPI causes cells to arrest as large budded cells; error bars are 95% binomial confidence intervals and P value is a Fisher’s exact test. (D) Examples of large budded cells of a strain encoding a marked chromosome V locus (ura3-1::3xURA3-tetOx112 TETR-RFP) with MTW1-YFP and either CDC14-GBP or cdc14-CS-GBP are shown both with separated chromosomes or unsegregated chromosomes. Note that the GBP alleles in this case are not RFP-tagged and that GBP binds to YFP equivalently to GFP. The proportion of large-budded cells, arrested specifically in metaphase with unsegregated chromosomes, is quantified and does not differ for Cdc14-Mtw1 compared with the CDC14 mutant-Mtw1. Error bars are 95% binomial confidence intervals. n.s., not statistically significant. (Scale bars, 5 µm.)
Fig. S5.
Localization of proteins by the GBP–GFP interaction. To ask whether the Mtw1-GBP was sufficient to relocalize all GFP proteins to the kinetochore, we made strains containing three different fluorophores (CFP, GFP, and RFP). Mtw1-GBP is tagged with RFP and, in each case, the GFP tag is listed. Ask1-CFP is used to mark the kinetochores (A–E) (independent of the location of Mtw1-GBP) and Fob1-CFP is used to mark the nucleolus (F). Because the emission spectra of CFP and GFP overlap (see methods used in SI Text) there is significant bleed-through of CFP signal into the GFP images and, to a lesser extent, GFP signal into the CFP images (G–I). Consequently, we have labeled the CFP locations with blue arrows and the GFP locations with green arrows (unless all of the signals overlap). The blue arrows are dashed in the GFP images (and vice versa) to indicate that this is bleed-through of emission. The GFP locations are defined as both a GFP signal and an RFP signal (because the RFP-tagged GBP will bind to GFP). The CFP signals are defined by having no RFP signal. Both Ypr174c (A) and Cdc5 (B) relocalize tightly to kinetochores via the GFP–GBP interaction. In contrast, Nup1-GFP is able to relocate Mtw1-GBP to the nuclear pore (C) and the location of Ask1-CFP is consistent with normal kinetochores. (D) Tom70, when linked to Mtw1 via the GBP–GFP interaction, is sufficient to disrupt the normal location of the kinetochores. (E and F) Cdc14 relocalizes to kinetochores constitutively via the GFP–GBP interaction. (Scale bars, 5 µm.)
SPI Analysis Identifies a Role for Kinetochore Phosphorylation.
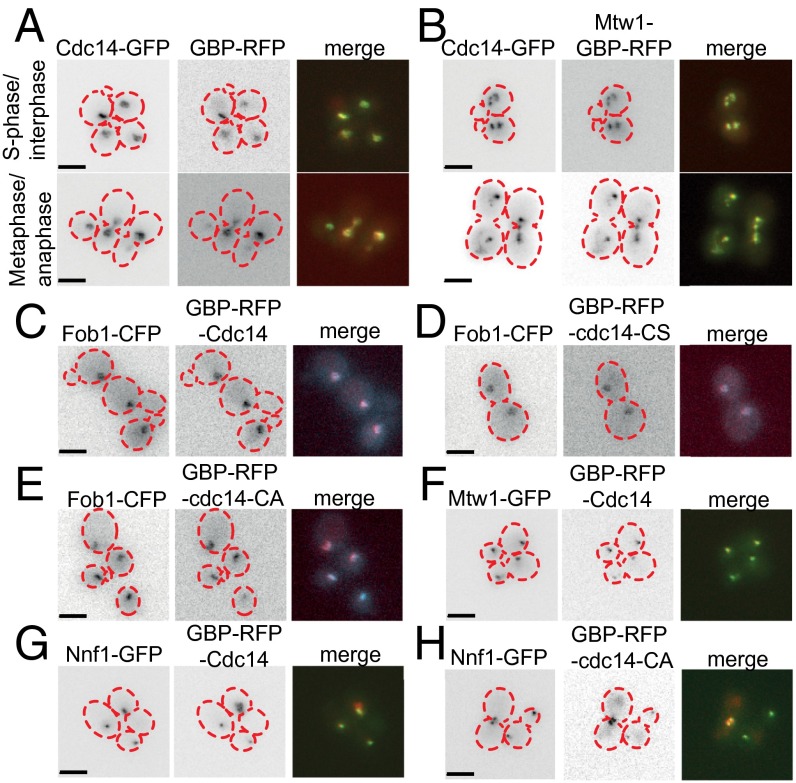
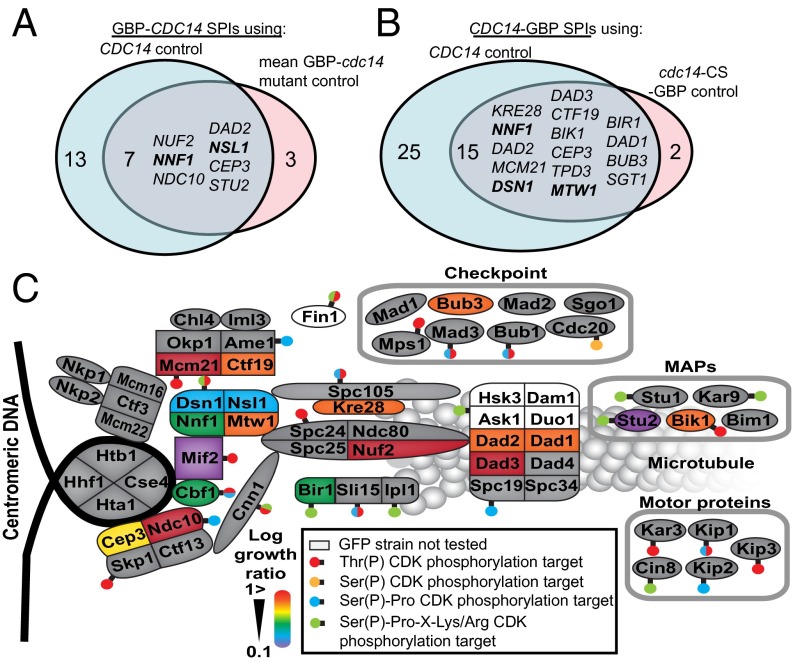
Three of the 61 Mtw1 SPIs are directly involved in phospho-regulation. First, Dbf4 is the regulatory subunit of the Cdc7 kinase. Second, the polo-like kinase Cdc5 was identified as a high-copy suppressor of DBF4 mutants (40). Finally, Cdc14 is a mitotic phosphatase that reverses the effects of the CDK to facilitate the progression from mitosis to G1. We focused upon Cdc14, a conserved phosphatase that is released from the nucleolus during anaphase to act upon CDK targets principally within the nucleus (21, 41). Cdc14 normally localizes to kinetochores during late mitosis and is important for targeting the chromosomal passenger complex to kinetochores (42). To determine the effect of the Mtw1-Cdc14 SPI in live cells, we used imaging and genetic analysis. We found that cells containing both Mtw1-GBP and Cdc14-GFP have constitutive association of Cdc14 and Mtw1 and aberrant kinetochore foci are observed in these cells (Fig. 4 A and B). We found that association of Cdc14 with Mtw1 caused an increase in large-budded cells (Fig. S4C), although without leading to a CIN phenotype (Fig. S4 A and B). This Mtw1-Cdc14 SPI phenotype could be caused by recruitment of Cdc14 to the kinetochore, by association of the entire kinetochore into the nucleolus or by impairing kinetochore assembly by titrating away Mtw1-bound proteins. We examined the location of the kinetochore, Cdc14, and the nucleolus using fluorescence imaging. We found that Cdc14 is relocalized to kinetochores (Fig. S5 E and F), although we noted that some Mtw1 was relocalized to the nucleolus. To evaluate this Mtw1-Cdc14 SPI in more detail and to examine the role of Cdc14 at the kinetochore, we used the SPI system to recruit Cdc14 to different kinetochore proteins, essentially performing the reciprocal fusion to that identified in the proteome-wide screen. We created constructs that encode Cdc14 alone, GBP-Cdc14 (both N- and C-terminal fusions), and mutants of CDC14 that encode catalytically inactive phosphatases (N-terminally tagged) GBP-Cdc14-CA and GBP-Cdc14-CS and also (C-terminally tagged) Cdc14-CA-GBP. Cdc14 tagged with GBP localized normally to the nucleolus (Fig. 4 C–E). The CDC14-GBP-RFP allele can be introduced into the endogenous CDC14 locus, indicating it functions normally within the cell (Table S1). We transferred these constructs separately into a set of 88 kinetochore and kinetochore-related GFP strains (Dataset S5) using the SPA methodology, with 16 replicates. Thus, we constitutively associated Cdc14 with each complex within the kinetochore structure and evaluated its effect. The GBP-tagged versions of Cdc14 (both wild-type and mutant) were recruited to GFP-tagged kinetochores (Fig. 4 F–H). We next compared the growth of Cdc14-GBP with both untagged Cdc14 and with either of the catalytic-dead mutants, which allowed us to query the effect of the phosphatase activity. A number of strains are inhibited for growth specifically by the catalytically active form of the Cdc14 phosphatase (Fig. 5 A and B and Fig. S6A). We quantified the growth effects as previously described (33), comparing the wild-type GBP-Cdc14 with either Cdc14 or the catalytically inactive mutants. The two N-terminally tagged mutants (GBP-cdc14-CA and GBP-cdc14-CS) gave equivalent results (Fig. S6B and Dataset S5). Additionally, the data for the N- and C-terminally tagged versions of Cdc14 were well correlated (Fig. S6C). Regardless of which GBP-Cdc14 construct is used or which control was compared, we found that members of the MIND complex consistently cause a growth defect (Fig. 5 A and B and Fig. S6A). In addition to individual SPIs from other complexes, there is evidence to support a growth defect for Cdc14 association with members of the outer kinetochore Dam1 complex (Dad1, Dad2, and Dad3), the inner kinetochore Cbf3 complex (Ndc10 and Cep3), and the COMA complex (Mcm21 and Ctf19).
Fig. 4.
The Mtw1-Cdc14 SPI is the result of Cdc14 recruitment to kinetochores. (A) Cdc14 is normally localized to the nucleolus and when tagged with GFP can recruit GBP. (B) Mtw1-GBP recruits Cdc14-GFP to the kinetochores, and this results in mitotic defects, such as lagging kinetochores. (C–E) GBP-Cdc14 and the catalytically inactive variants are normally localized to the nucleolus, as shown by colocalization with nucleolar protein Fob1. Inclusion of a GFP-tagged kinetochore protein, such as Mtw1-GFP or Nnf1-GFP, is sufficient to recruit either GBP-Cdc14 (F and G) or phosphatase-dead GBP-Cdc14-C283A (H) to the kinetochore. Cell outlines are indicated with red dashed lines. (Scale bars, 5 µm.)
Table S1.
Yeast strains used in this study
| Strain name | Genetic background | Relevant genotype | Source |
| PT95-19C | W303* | MATa ADE2 TRP1 FOB1-CFP | Present study |
| PT19-1C | W303 | MATa HTA1-CFP::NAT | Present study |
| W8164-2B | W303 | MATα CEN1-16::Gal-Kl-URA3 | (32) |
| PT73-7A | W303 | MATa CSE4-CFP::HIS3 | Present study |
| PT129-1A | W303 | MATα ADE2 LYS2 SPC110-CFP::KAN RAD5 | Present study |
| GFP strains | BY4741† | MATa his3∆1 leu2∆0 met15∆0 ura3∆0 XXX-GFP::HIS3 | (20) |
| T317 | BY4741 | MATa CDC14-GFP::HIS3 ubr2∆::NAT | Present study |
| T306 | BY4741 | MATa NDC10-GFP::HIS3 ubr2∆::NAT | Present study |
| T307 | BY4741 | MATa BIR1-GFP::HIS3 ubr2∆::NAT | Present study |
| T310 | BY4741 | MATa NNF1-GFP::HIS3 ubr2∆::NAT | Present study |
| T311 | BY4741 | MATa DAD2-GFP::HIS3 ubr2∆::NAT | Present study |
| T309 | BY4741 | MATa NSL1-GFP::HIS3 ubr2∆::NAT | Present study |
| T312 | BY4741 | MATa DAD2-GFP::HIS3 ubr2∆::NAT | Present study |
| T308 | BY4741 | MATa NUF2-GFP::HIS3 ubr2∆::NAT | Present study |
| PT142-1C | W303 | MATα ADE2 TRP1 leu2-3,112 his3-11,15 ura3-1 lys2∆ RAD5 ASK1-CFP | Present study |
| PT95-35A | W303 | MATα ADE2 trp1-1 leu2-3,112 his3-11,15 FOB1-CFP | Present study |
| PT39-30A | W303 | MATα ADE2 TRP1 leu2-3,112 his3-11,15 ura3-1 lys2∆ RAD5 MTW1-CFP | Present study |
| PT149 | W303/BY4741 | MATα/MATa FOB1-CFP CDC5-GFP::HIS3 | Present study |
| PT150 | W303/BY4741 | MATα/MATa FOB1-CFP TOM70-GFP::HIS3 | Present study |
| PT151 | W303/BY4741 | MATα/MATa FOB1-CFP YPR174C-GFP::HIS3 | Present study |
| PT152 | W303/BY4741 | MATα/MATa FOB1-CFP NUP1-GFP::HIS3 | Present study |
| PT153 | W303/BY4741 | MATα/MATa FOB1-CFP CDC14-GFP::HIS3 | Present study |
| PT154 | W303/BY4741 | MATα/MATa MTW1-CFP CDC14-GFP::HIS3 | Present study |
| PT155 | W303/BY4741 | MATα/MATa ASK1-CFP CDC14-GFP::HIS3 | Present study |
| PT156 | W303/BY4741 | MATα/MATa ASK1-CFP CDC5-GFP::HIS3 | Present study |
| PT157 | W303/BY4741 | MATα/MATa ASK1-CFP TOM70-GFP::HIS3 | Present study |
| PT158 | W303/BY4741 | MATα/MATa ASK1-CFP YPR174C-GFP::HIS3 | Present study |
| PT159 | W303/BY4741 | MATα/MATa ASK1-CFP NUP1-GFP::HIS3 | Present study |
| T376 | BY4741 | MATa NNF1-GFP::HIS3 DSN1-3HA::HYG | Present study |
| T81 | BY4741 | MATa CSE4-GFP::HIS3 mad3∆::KAN | Present study |
| T82 | BY4741 | MATa CDC20-GFP::HIS3 mad3∆::KAN | Present study |
| T83 | BY4741 | MATa NDC10-GFP::HIS3 mad3∆::KAN | Present study |
| T84 | BY4741 | MATa IPL1-GFP::HIS3 mad3∆::KAN | Present study |
| T85 | BY4741 | MATa BIR1-GFP::HIS3 mad3∆::KAN | Present study |
| T414 | BY4741 | MATa NUF2-GFP::HIS3 mad3∆::KAN | Present study |
| T415 | BY4741 | MATa NNF1-GFP::HIS3 mad3∆::KAN | Present study |
| T416 | BY4741 | MATa MTW1-GFP::HIS3 mad3∆::KAN | Present study |
| T417 | BY4741 | MATa CDC14-GFP::HIS3 mad3∆::KAN | Present study |
| T418 | BY4741 | MATa KRE28-GFP::HIS3 mad3∆::KAN | Present study |
| T419 | BY4741 | MATa NSL1-GFP::HIS3 mad3∆::KAN | Present study |
| T420 | BY4741 | MATa CEP3-GFP::HIS3 mad3∆::KAN | Present study |
| T421 | BY4741 | MATa DAD3-GFP::HIS3 mad3∆::KAN | Present study |
| T422 | BY4741 | MATa BIK1-GFP::HIS3 mad3∆::KAN | Present study |
| T423 | BY4741 | MATa BUB3-GFP::HIS3 mad3∆::KAN | Present study |
| T424 | BY4741 | MATa MIF2-GFP::HIS3 mad3∆::KAN | Present study |
| T425 | BY4741 | MATa CBF1-GFP::HIS3 mad3∆::KAN | Present study |
| T426 | BY4741 | MATa SLI15-GFP::HIS3 mad3∆::KAN | Present study |
| T427 | BY4741 | MATa AME1-GFP::HIS3 mad3∆::KAN | Present study |
| T428 | BY4741 | MATa MCM21-GFP::HIS3 mad3∆::KAN | Present study |
| T429 | BY4741 | MATa CTF19-GFP::HIS3 mad3∆::KAN | Present study |
| T430 | BY4741 | MATa STU2-GFP::HIS3 mad3∆::KAN | Present study |
| T431 | BY4741 | MATa DSN1-GFP::HIS3 mad3∆::KAN | Present study |
| T432 | BY4741 | MATa mtw1∆::KAN with plasmid pHT10 [MTW1-GBP LEU2] | Present study |
| T449 | W303 | MATα CEN1-16::Gal-Kl-URA3 CDC14-GBP-RFP::KAN | Present study |
| PT209-7A | W303 | MATa ura3::3xURA3-tetOx112 TetR-mRFP(iYGL119W) MTW1-YFP | Present study |
Fig. 5.
Cdc14 recruitment only affects a subset of kinetochore proteins. (A) The N-terminally tagged Cdc14 compared with Cdc14 gave SPI phenotypes with 20 GFP strains and compared with the catalytically inactive mutant gave 10 SPIs, 7 of which overlap between the two groups (Dataset S5). (B) The C-terminally tagged Cdc14 gave 40 SPIs relative to the Cdc14 control and 17 relative to a catalytically inactive mutant, of which 15 overlap (Dataset S5). Members of the MIND complex are identified in both screens. (C) Cdc14-kinetochore SPIs overlap with known phosphorylation sites. A schematic of the kinetochore shows many of the key kinetochore proteins, each of which is color-coded: red indicates the Cdc14 SPIs with the strongest growth defects and purple the weakest; gray proteins were not identified as SPIs in this assay. Superimposed upon this schematic as “lollipops” are the previously mapped CDK sites within the kinetochore.
Fig. S6.
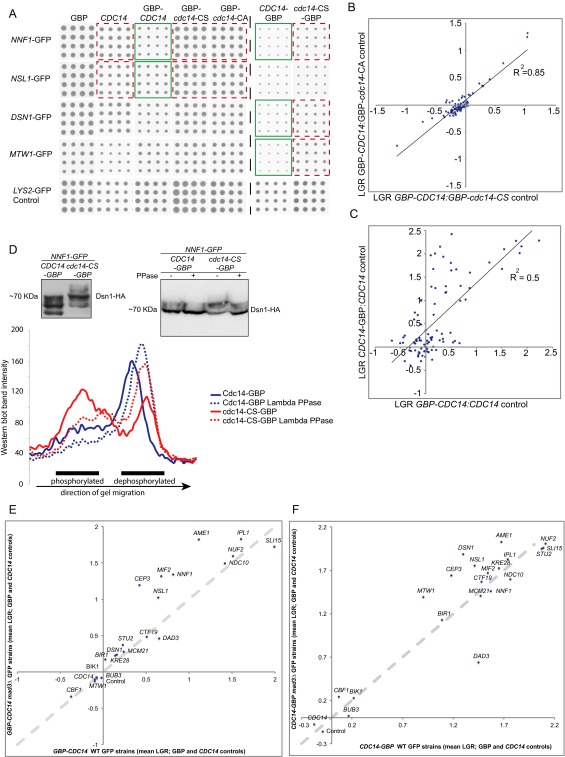
Cdc14-kinetochore SPIs. (A) An array of kinetochore GFP strains were arrayed at high density (16 replicates), members of the MIND complex are shown. Plasmids expressing a variety of Cdc14 constructs were transferred separately into each strain. SPIs that were identified by the ScreenMill software are highlighted (green for experiment, red for controls). (B) The two catalytically inactive N-terminal GBP fusions gave equivalent log growth ratios (LGRs) compared with the wild-type GBP-Cdc14. (C) The N-terminal and C-terminal GBP fusions to Cdc14 also give well-correlated SPI data (LGRs). (D) Proteins were extracted from Nnf1-GFP cells encoding Dsn1-3xHA, which also contained either a wild-type CDC14-GBP or cdc14-CS-GBP mutant plasmid. The protein was separated using gels containing Phos-Tag reagent to separate phosphorylated proteins, and the resulting blot shows the effect of recruiting Cdc14. Protein extracts from the same strains with or without Lambda phosphatase treatment where also compared, and band intensity was plotted on a line graph. We found significant protein degradation caused by the incubation at 30 °C, which is part of the phosphatase treatment. However, as quantitated in the line graph, it is clear that the higher band, which is largely absent when Cdc14 wild-type is recruited, is depleted by phosphatase treatment. This is viewed quantitatively in the line plot. (E and F) The four plasmid constructs (GBP-CDC14, CDC14-GBP, CDC14, and GBP) were introduced into 21 GFP-tagged strains detected as SPIs (including controls) with GBP-CDC14 or CDC14-GBP as before, but now in both wild-type and mad3∆ backgrounds, and arrayed with 16 replicates. The average of the CDC14 and GBP controls versus the GBP-CDC14 (E) or CDC14-GBP (F) experiment (mean LGR) were compared and plotted on a scatter-graph (wild-type on x axis and mad3∆ on y axis). (E) Deletion of MAD3 does not suppress any GBP-Cdc14 SPIs. However, several GBP-Cdc14 SPIs are stronger in a mad3∆ strain (CEP3, MIF2, NSL1, NNF1, and AME1). (F) Only one SPI, Cdc14-Dad3, is suppressed; however, the colony sizes of this comparison are very small and consequently their ratios are subject to larger errors. Several Cdc14-GBP SPIs increase the growth phenotype when MAD3 is deleted (MTW1, CEP3, DSN1, NSL1, and AME1). The dotted diagonal line indicates the position expected if the LGRs are the same in both wild-type and mad3∆ strains; points below this line would be suppressed by the mad3∆ allele.
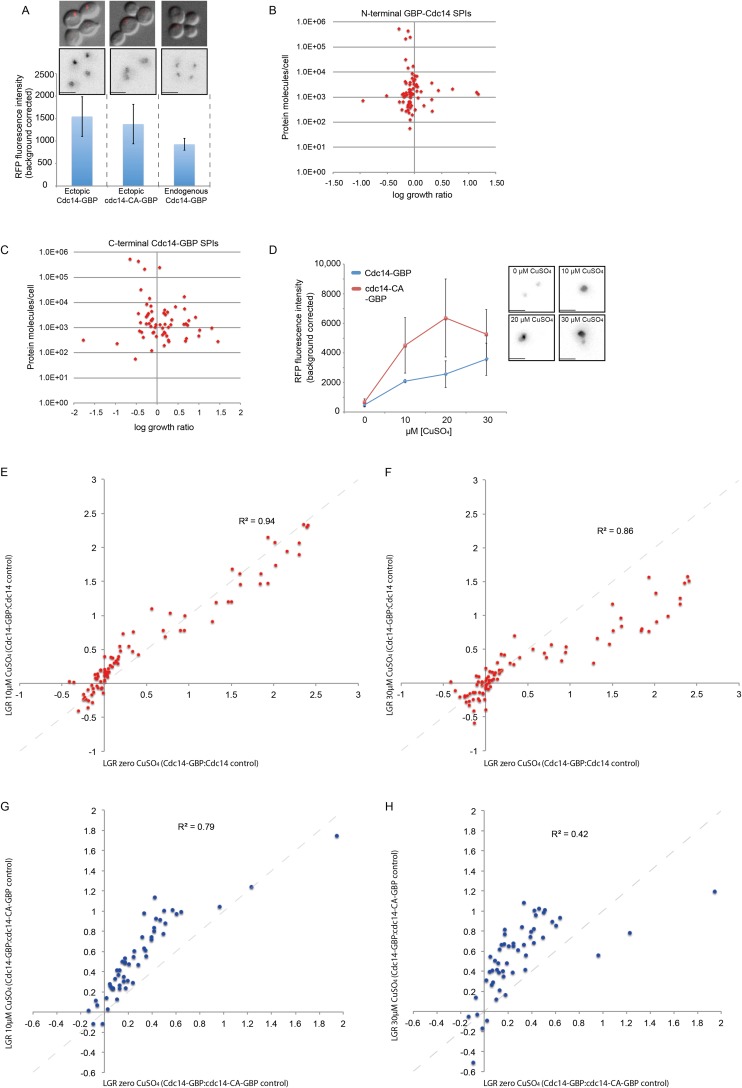
To determine whether the stoichiometry of Cdc14-GBP is a determinant of the SPI phenotype, we compared the fluorescence from endogenously tagged Cdc14-GBP-RFP with that of plasmid-encoded Cdc14-GBP-RFP (either wild-type or mutant). The plasmid creates ∼150% of the normal level of Cdc14 protein (Fig. S7A). We then correlated the Cdc14 SPIs with protein abundance and found no correlation (Fig. S7 B and C). We also used increasing copper concentrations to up-regulate the levels of plasmid-encoded Cdc14 (Fig. S7D) and found that higher levels of Cdc14 have only minor effects upon SPI phenotype (Fig. S7 E–H and Dataset S5).
Fig. S7.
Stoichiometry analysis of Cdc14. (A) RFP fluorescence intensity of endogenously encoded Cdc14-GBP was compared with plasmid-encoded wild-type and mutant Cdc14-GBP without CuSO4 addition. Ectopically expressed Cdc14 (both wild-type and mutant) has ∼1.5× higher RFP signal than endogenously expressed Cdc14-GBP; error bars indicate SD of fluorescence intensity. (Scale bars, 5 µm.) (B and C) The strength of the Cdc14 SPI growth phenotype does not correlate with the amount of protein molecules per cell for the GFP-tagged proteins. (D) Fluorescence intensity of Cdc14-GBP and cdc14-CS-GBP with addition of CuSO4 to drive the expression from the plasmid. The RFP signal increases with higher concentration of copper in both wild-type and mutant strains; error bars indicate SD. (Inset) Examples of wild-type Cdc14-GBP at different concentrations of copper; beyond 30 µM copper overexpression of CDC14 becomes toxic to cells. We note that wild-type Cdc14 levels are lower than mutant, perhaps indicating partial toxicity of overexpression of CDC14. (Scale bars, 5 µm.) (E and F) Comparing Cdc14-GBP with Cdc14 control gave equivalent results on the different CuSO4 concentrations (0 µM and 10 µM or 30 µM CuSO4 each correlate well). (G and H) Comparing Cdc14-GBP with the mutant cdc14-CA-GBP control with both 0 µM and 10 µM CuSO4 correlates well, whereas 0 µM and 30 µM CuSO4 correlates to a lesser extent. The weaker correlation of 0 µM with 30 µM may be because of partial toxicity of this level of overexpression of CDC14.
To ask whether the Cdc14-kinetochore SPIs require checkpoint activation, we created a set of 22 GFP strains that are deleted for MAD3, a critical downstream component of the spindle assembly checkpoint. We repeated the SPI screen with both wild-type GFP-tagged strains and mad3∆ versions of each of these. The SPI phenotypes were not suppressed by deletion of MAD3, indicating that checkpoint is not necessary for the Cdc14 SPI phenotype (Fig. S6 E and F and Dataset S5). Some of the Cdc14 interactions give a slightly stronger growth defect in mad3∆ strains (e.g., Nsl1, Ame1, or Cep3), indicating that these SPIs create problems for the kinetochore, which are normally suppressed by an active checkpoint. We also repeated the screen in the presence of benomyl and this did not significantly affect any of the SPIs (Dataset S5). We also marked a region of chromosome five (at the URA3 locus) with a repressor–operator system and found that the Mtw1–Cdc14 interaction does not exclusively arrest cells before metaphase (Fig. S4D). These data indicate that the mitotic checkpoint is not directly producing the SPI phenotype, nor do the SPIs result in checkpoint deficiency.
Dsn1 Dephosphorylation Does Not Cause the SPI Phenotype.
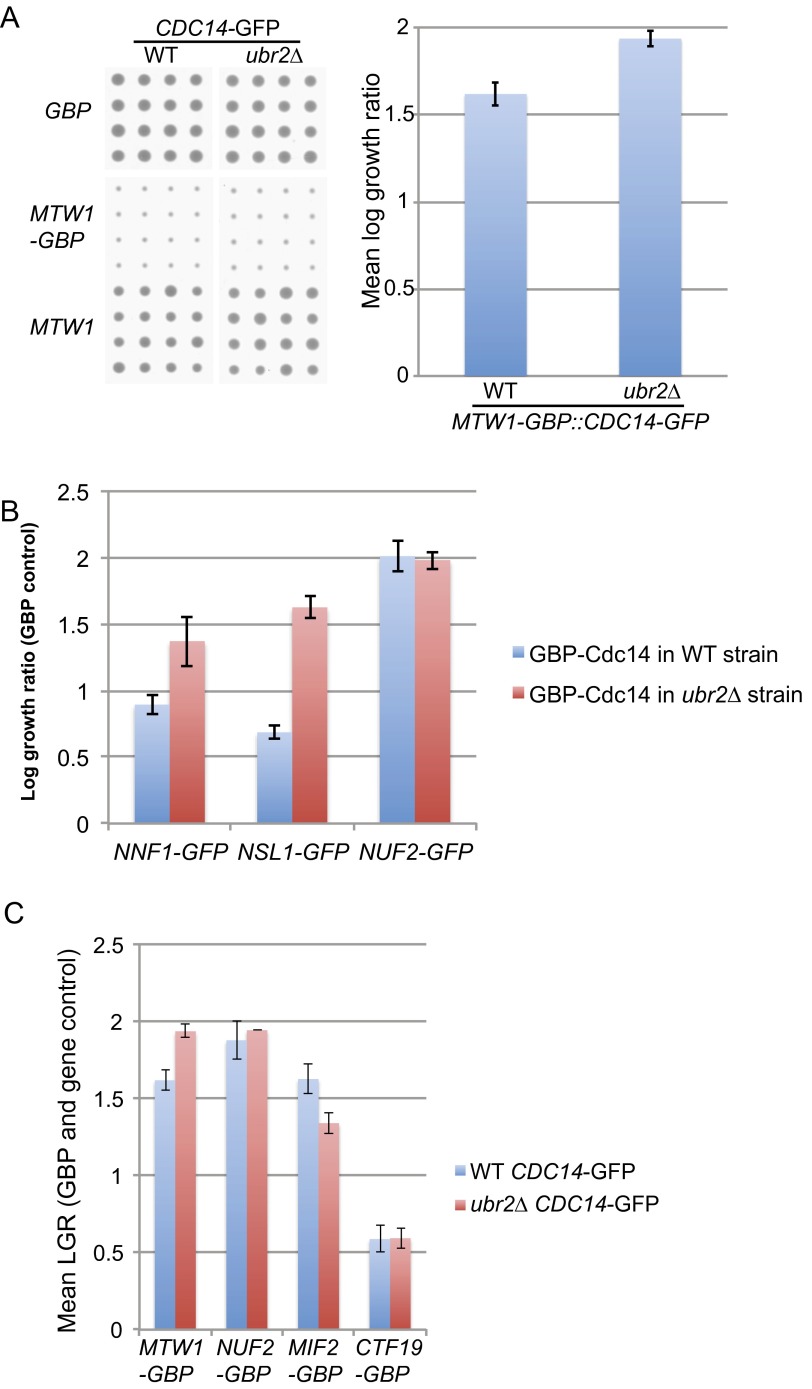
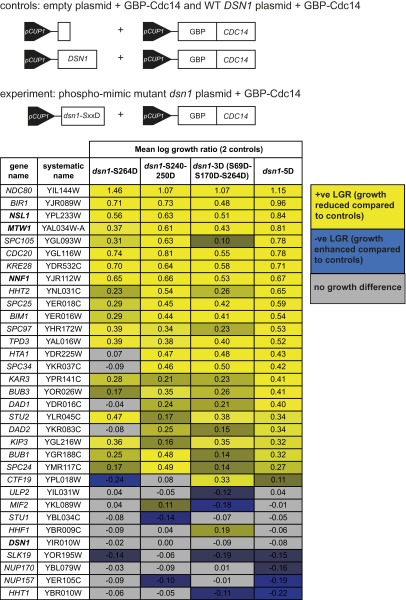
Dsn1 is the only member of the MIND complex known to contain CDK target sites (22, 23), but blocking phosphorylation of these sites does not result in significant mitotic phenotypes (13). To ask whether association of Cdc14 adjacent to the MIND complex could affect phosphorylation of Dsn1, we tagged endogenous Dsn1 with the sequence encoding three HA tags. We found that Dsn1 phosphorylation is reduced upon recruitment of wild-type Cdc14 to the MIND complex in comparison with mutant Cdc14 (Fig. S6D), although CDK dephosphorylation of Dsn1 is not lethal; therefore, we could not link the SPI phenotype allele with this particular dephosphorylation event. It is possible that by constitutively recruiting Cdc14 adjacent to Dsn1, the two non-CDK serines (S240 and 250) are dephosphorylated. Ipl1-dependent phosphorylation of these two serines stabilizes Dsn1 and prevents its ubiquitin-mediated degradation by Ubr2 and Mub1 (14). However, the SPI phenotype of the MIND complex with Cdc14 is not rescued in a ubr2∆ strain (Fig. S8A), nor are the Cdc14 SPIs with Nnf1, Nsl1, or Nuf2 (Fig. S8B). Additionally, we created a set of new GBP constructs from the kinetochore (Nuf2, Mif2, and Ctf19) and tested their effect in a CDC14-GFP strain. These fusions all give SPI phenotypes in both wild-type UBR2 and ubr2∆ cells (Fig. S8C). Hence, deletion of UBR2 fails to rescue the growth defect of Cdc14 with the MIND complex. To test this in another way, we created a plasmid construct expressing a mutant form of DSN1, in which the codons for serines 240 and 250 are converted to those of aspartic acid (S240,250D). This construct would therefore create a pool of stabilized Dsn1 that cannot be degraded in the canonical Ubr2-dependent way (14). This DSN1 S240,250D plasmid was used in a Cdc14 SPI assay of the kinetochore and the original SPI phenotype (with members of the MIND complex) is not rescued by inclusion of this stabilized Dsn1 construct (Fig. S9). We also performed the same experiment with other Dsn1 variants, first with the canonical CDK site changed to aspartic acid (S264D), second with a Dsn1 variant that included changes to two other proposed CDK sites (S69,170,264D), and third with all of these serines changed to aspartic acid (S69,170,240,250,264D). In no case did the mutations of DSN1 rescue the SPI phenotype of recruiting Cdc14 to the MIND complex (Fig. S9). Thus, we conclude that dephosphorylation of CDK and Ipl1 sites within Dsn1 is not responsible for the SPI phenotype.
Fig. S8.
Deleting UBR2 does not rescue the growth defect of MTW1-GBP: CDC14-GFP SPI. (A) The three plasmid constructs (MTW1-GBP, MTW1, and GBP) were introduced into strains containing CDC14-GFP as before but now in both wild-type and ubr2∆ backgrounds and arrayed with 16 replicates. The average of the MTW1 and GBP controls versus the MTW1-GBP experiment (mean LGR) were compared and show that the ubr2∆ strain is also inhibited by Cdc14 fusion to Mtw1 (error bars = SD of the two controls). (B) Deletion of UBR2 does not rescue several Cdc14 SPIs, including Nnf1, Nsl1, and Nuf2; if anything, the SPIs are stronger in a ubr2∆ strain. Errors bars are SD of the mean. (C) We also created additional GBP constructs, including NUF2-GBP and CTF19-GBP (both of which were Cdc14 SPIs) (Fig. 5) and MIF2-GBP, which gave a weak Cdc14 SPI with both controls (Dataset S5). None of these are suppressed by the ubr2∆ mutation (Mtw1 data as in A; error bars = SD of the two controls).
Fig. S9.
Dsn1 phosphomimic mutants do not suppress the kinetochore-Cdc14 SPI phenotype. The GBP-CDC14 plasmid construct was introduced into the GFP-tagged kinetochore strains as before, but now including a second plasmid construct expressing a phosphomimic-mutant of Dsn1. Four mutants were generated: (i) Serine 264 to aspartic acid (dsn1-S264D); (ii) serines 240 and 250 to aspartic acid (dsn1-S240-250D); (iii) serines 69, 170, and 264 to aspartic acid (dsn1-S69D-S170D-S264D); and (iv) all five serines to aspartic acids (dsn1 5D). As controls, the GBP-CDC14 construct was used along with either an empty construct or a wild-type Dsn1 construct (illustrated at the top). A selection of average LGRs of the two controls with each Dsn1 mutant plus GBP-Cdc14 are shown in table format (for all data, see Dataset S5). Positive LGRs correspond to an increased growth defect (yellow cells) and negative LGRs correspond to a suppressed growth defect (blue cells). Members of the MIND complex are highlighted in bold.
Irrespective of the CDK or other phosphorylation sites, these data indicate that phosphorylation of proteins at the kinetochore is important for normal mitotic function. The Cdc14 fusions that cause SPIs are superimposed upon a graphic of the kinetochore structure (Fig. 5C) to produce a map of these Cdc14 phosphatase-sensitive regions within the yeast kinetochore.
SI Text
Synthetic Physical Interaction Screens.
The GBP alleles were expressed ectopically in GFP strains from a single-copy plasmid under the control of a copper promoter. Plasmids encoding the GBP-tagged proteins and controls were transferred into the GFP strains using SPA (32). In brief, arrays of 384 strains from the GFP collection were grown on rectangular plates containing YPD media, typically at 1,536 colonies per plate density (four replicates of each strain using a RoTor pinning robot from Singer Instruments Ltd.). After growth, these MATa plates were replica plated with a donor MATα yeast strain containing a specific LEU2 plasmid. The resulting diploids were grown overnight on YPD and then replica plated onto media containing galactose and lacking leucine (GAL–leu). After 24 h the colonies were replicated to GAL–leu medium containing 5-fluoroorotic acid (GAL–leu 5FOA), and 24–48 h later the plates were scanned.
Quantitative Analysis of High-Throughput Yeast Growth.
After GFP strains were transformed using the SPA methodology, the resulting agar plates were scanned using a desktop flatbed scanner (Epson V750 Pro, Seiko Epsonat 300 dpi resolution in transmission mode. These images were processed and analyzed using the ScreenMill suite of software, which assesses growth based upon the surface area of colonies (33). The software was run in default mode, both for the kinetochore-specific screen and for the proteome-wide screen. For validation of growth defects, plate images were normalized using specific controls on the plate as a reference, rather than the default plate median. We used a custom-smoothing algorithm (details below) to correct the z-scores from the proteome-wide screen for spatial anomalies, such as colonies growing faster at the top of the plate than the bottom.
We noted that some Cdc14 interactions appear to enhance the normal growth of cells. For example, recruitment of active GBP-Cdc14 to Kip3-GFP and Ndc80-GFP enhances cell growth (Dataset S5). However, we found these “positive” interactions are rarely consistent between controls (both Kip3 and Ndc80 are not found when using Cdc14 as a control). Consequently we have not investigated these interactions further. More generally, the SPI methodology could be used to rescue a genetic deficiency or a drug treatment by exclusively using the method to identify SPIs that enhance growth.
Fluorescence Microscopy.
To examine the location of tagged proteins within the cells we used epifluorescence microscopy. Log-phase cells were embedded in 0.7% low melting point agarose dissolved in the appropriate growth medium. The depth of agarose between the slide and coverslip is fixed at 6–8 µm, slightly larger than the diameter of the average yeast cell, which maintains a consistent distance from the coverslip to the cell nucleus. Cells were imaged with a Zeiss Axioimager Z2 microscope (Carl Zeiss), using a 63× 1.4 NA oil immersion lens, illuminated using a Zeiss Colibri LED illumination system (CFP = 445 nm, GFP = 470 nm, YFP = 505 nm, RFP = 590 nm). Bright-field contrast was enhanced with differential interference contrast prisms. The resulting light was captured using a Hamamatsu ORCA ERII CCD camera containing an ER-150 interline CCD sensor with 6.45-µm pixels, binned 2 × 2 (Hamamatsu Photonics). The exposure times were set to ensure that CCD pixels were not saturated. The resulting 12-bit images have a pixel size of 205 nm in x and y and a z-step size of 300 nm, and an effective dynamic range of ∼3,000 gray levels. Images shown in the figures were prepared using Volocity imaging software (Perkin-Elmer).
CFP/GFP overlap: for some of our images (Fig. S5) we used three color imaging of the GFP-GBP interaction. This involved using CFP and GFP together. For these experiments the CFP fluorophore was excited at 445 nm and the emission collected between 425 and 460 nm, the GFP was excited at 470 nm and the emission collected between 440 and 480 nm. Consequently, there is significant overlap between these two channels as indicated in Fig. S5G, so we used the GBP(RFP) signal to distinguish true GFP signal from the CFP bleed-through.
Spatial Smoothing Algorithm.
Colonies arrayed on agar plates often grow faster on one side of the plate than the other. This growth effect can be caused by temperature or humidity gradients within incubators, variable thickness of agar (and hence concentration of nutrients), or uneven pinning pressure during plate copying. These anomalies can result in one side of the plate producing an overall higher z-score than the other. To correct for these type of biases, algorithms are typically used to adjust colony size data to reflect overall even growth across a plate (53, 54). The ScreenMill suite of software used for our analysis does not contain such corrections and so we developed and used a simple algorithm to correct z-scores for spatial anomalies.
The PERL script is freely available to download from sourceforge.net/projects/zspatialcorrect/files/spatial1_0.plx/download.
In brief, the software compares the median z-score on each column and each row to the median z-score of the whole plate. It then adjusts the z-scores of each column and row linearly to match the plate median. For example, if the median z-score for a plate is 0 and the median z-score of row A (the top row) for that plate is −0.2, then 0.2 will be added to all of the z-scores in row A. This adjustment is iteratively repeated for each row and each column on the plate.
Whole-Cell Extracts for Western Blotting.
Protein extractions were prepared by using a trichloroacetic acid (TCA) precipitation protocol adapted from Keogh et al. (55). In short, cells were grown in appropriate media (YPD or SC-Leu) to OD600 of ∼1.0 and collected by centrifugation and washed with 20% (vol/vol) TCA. All further steps were performed on ice with prechilled solutions. Pelleted cells were frozen at −80 °C, thawed on ice, resuspended in 250 µL 20% (vol/vol) TCA, and glass bead lysis was performed. The cell suspension was collected without glass beads. Next, 1 mL of 5% TCA was added and Bradford protein assay (Bio-Rad) was performed to determine protein content of the samples. Proteins were collected by centrifugation and pellets washed with 750 µL 100% ethanol. The protein extract was resuspended in lysis buffer containing protease inhibitors (cOmplete, EDTA-free from Roche) and incubated at 30 °C for 20 min with or without Lambda phosphatase according to manufacturer’s instructions (New England Biolabs). The liquid was removed and pellet resuspended in 70 µL of 3× Laemmli buffer and 30 µL of 1M Tris⋅HCl pH 9.4. Finally, the samples were boiled at 95 °C for 5 min and debris removed by centrifugation and supernatant analyzed further.
Phos-Tag SDS/PAGE and Western Blot Analysis of Dsn1-HA.
For Phos-Tag SDS/PAGE, 7.5% (wt/vol) acrylamide gels containing 50 µM Phos-Tag and 100 µM MnCl2 solution were prepared according to the manufacturer’s specifications (MANAC Inc.). The samples were loaded so that each had same amount of proteins per lane and gels were run at 60V for 1 h and then 100V for 4 h and 30 min in 1× SDS running buffer. Gels were transferred to PVDF membranes for 1 h at 100V. Membranes were blocked for 30 min using 50% blocking buffer (Li-Cor) and 50% PBS with gentle shaking. Primary mouse anti-HA antibody (Roche) was diluted 1:2,000 in blocking buffer with 0.1% Tween and membranes incubated with gentle shaking for 1 h. Membranes were washed four times for 5 min with PBST and then secondary goat anti-mouse HRP antibody (Abcam) diluted 1:20,000 in blocking buffer with 0.1% Tween and 0.1% SDS was added and membranes incubated for 1 h. Finally, membranes were washed as before and ECL reagents (Lumi-Light from Roche) were introduced for 2 min for detection and film exposed for 1 min.
Discussion
Key steps in kinetochore assembly and homeostasis are regulated by specific posttranslational modifications, such as phosphorylation and ubiquitylation (9). We have developed a proteome-wide approach to systematically query which protein–protein interactions affect kinetochore homeostasis. We identified a small subset of these forced interactions that significantly affect growth and termed these synthetic physical interactions. SPIs define pairs of proteins that when forced together affect the growth of the cells. Mutations in the genes encoding Mtw1 SPIs give a CIN phenotype and have synthetic interactions with sumoylation mutants. Recently, a number of kinetochore proteins have been identified that are sumoylated (43). Among the Mtw1 SPIs are a number of proteins that associate with the inner kinetochore, including Rfa1, Brn1, Nmd5, and Cdc5 (11). The latter of these, Cdc5, is the polo-like kinase, which regulates the dynamic association between kinetochores and microtubules (44). More generally, phosphorylation plays an important role in kinetochore homeostasis and we noted that one Mtw1 SPI was with Cdc14. CDK phosphorylates a number of kinetochore proteins and Cdc14, when released from the nucleolus in anaphase, reverses a number of these phosphorylations (22, 23, 42, 45). However, the importance of these CDK phosphorylation/dephosphorylation events is unclear. For example, Dsn1 is a member of the MIND complex, which is dephosphorylated before the bulk release of Cdc14 (13). However, CDC14 conditional mutants only have a subtle defect in mitosis (25). To map the effects of Cdc14 phosphatase activity, we used the SPI method to recruit both wild-type and inactive variants of Cdc14 to different kinetochore proteins. We found that a number of kinetochore complexes are sensitive to constitutive recruitment of the active phosphatase, including the MIND complex, the Cbf3 complex, and the Dam1 complex. Although it is possible that the Mtw1-Cdc14 SPI phenotype is caused by partial relocation of Mtw1 to another location (e.g., the nucleolus), this is unlikely for a number of reasons. First, the mutant Cdc14 binding causes equal kinetochore relocation as the wild-type (Fig. 4 G and H), but does not give a SPI phenotype. Second, we did not identify other Cdc14-associated nucleolar proteins in the original Mtw1 SPI screen, despite screening most of the proteome. Third, not all kinetochore proteins produce a SPI phenotype with Cdc14. Fourth, our stoichiometry analysis does not support sequestration of low-abundance kinetochore proteins away from the kinetochore (Fig. S7 B and C). Finally, these Cdc14 SPIs correlate well with a map of the CDK sites within the kinetochore (Fig. 5C). We show that although phosphorylation of Dsn1 is inhibited by recruitment of Cdc14, this dephosphorylation is unlikely to result in the Cdc14-Mtw1 SPI. Therefore, we speculate that either the Cdc14 is removing other phosphates in neighboring proteins—for example, CDK serine sites on Cnn1 (24), Sli15 (42), Bir1 (46), or Fin1 (47) (Fig. 5C)—or at non-CDK sites on other proteins. In any of these cases, the Cdc14 SPIs highlight the importance of phosphorylation of kinetochore proteins for mitosis and warrant further characterization of the role of phosphorylation in regulating kinetochore homeostasis. Because Cdc14 normally functions as a dimer, the catalytically inactive mutants may be capable of recruiting wild-type Cdc14 to the kinetochore (48, 49). This would produce false-negatives in our screen; hence, it is possible that our list of sites affected by Cdc14 is an underrepresentation of all of the critical CDK sites at the kinetochore. Another approach would be to recruit CDK or other kinases to the kinetochore to determine whether constitutive phosphorylation would also affect mitosis. Such a fusion method is highly effective in specific cases (50, 51).
Collectively, these data show that the SPI methodology is sufficiently robust to create protein fusions across the proteome. Furthermore, we show proof of principle that the SPI methodology identifies functional interactions in a similar way to synthetic genetic interactions. A spatial map of serine-phosphatase–sensitive sites within the kinetochore correlates well with existing CDK data, strongly supporting a role for functional CDK phosphorylation in mitotic kinetochore function. The SPI methodology is adaptable for use with either entire proteins or functional domains and has broad application for exploring the role of protein localization at a systems level.
Experimental Procedures
The yeast strains used in this study are listed in Table S1. Strains were constructed using standard techniques and standard yeast growth medium including 2% (wt/vol) of the indicated carbon source (52). Yeast plasmids are listed in Table S2. Plasmids were transferred into the GFP strains using selective ploidy ablation (32) and the resulting colony growth assessed using ScreenMill software (33). Other methods are described in SI Text.
Table S2.
Plasmids used in this study
| Plasmid name | Relevant genotype | Source |
| pHT4 | LEU2 pCUP1::GBP-RFP | Present study |
| pHT10 | LEU2 pCUP1::MTW1-GBP-RFP | Present study |
| pHT296 | LEU2 pCUP1::MTW1 | Present study |
| pHT353 | LEU2 pCUP1::GBP-RFP-CDC14 | Present study |
| pHT354 | LEU2 pCUP1::CDC14 | Present study |
| pHT355 | LEU2 pCUP1::GBP-RFP-cdc14-C283S | Present study |
| pHT356 | LEU2 pCUP1::GBP-RFP-cdc14-C283A | Present study |
| pHT411 | LEU2 pCUP1::CDC14-GBP-RFP | Present study |
| pHT412 | LEU2 pCUP1::cdc14-C283S-GBP-RFP | Present study |
| pHT99 | NAT pCUP1 (empty) | Present study |
| pHT369 | NAT pCUP1::DSN1 | Present study |
| pHT379 | NAT pCUP1::dsn1-S264D | Present study |
| pHT380 | NAT pCUP1::dsn1-S240D, S250D | Present study |
| pHT381 | NAT pCUP1::dsn1-S69D, S170D, S240D, S250D, S264D (5D) | Present study |
| pHT382 | NAT pCUP1::dsn1-S69D, S170D, S264D (3D) | Present study |
| pHT274 | LEU2 pCUP1::NUF2-GBP-RFP | Present study |
| pHT210 | LEU2 pCUP1::NUF2 | Present study |
| pHT314 | LEU2 pCUP1::MIF2-GBP-RFP | Present study |
| pHT313 | LEU2 pCUP1::MIF2 | Present study |
| pHT312 | LEU2 pCUP1::CTF19-GBP-RFP | Present study |
| pHT311 | LEU2 pCUP1::CTF19 | Present study |
| pHT340 | LEU2 pCUP1::KRE28-GBP-RFP | Present study |
| pHT339 | LEU2 pCUP1::KRE28 | Present study |
| pHT336 | LEU2 pCUP1::SKP1-GBP-RFP | Present study |
| pHT335 | LEU2 pCUP1::SKP1 | Present study |
| pHT344 | LEU2 pCUP1::CBF1-GBP-RFP | Present study |
| pHT310 | LEU2 pCUP1::CBF1 | Present study |
| pHT319 | LEU2 pCUP1::CNN1-GBP-RFP | Present study |
| pHT318 | LEU2 pCUP1::CNN1 | Present study |
| pHT342 | LEU2 pCUP1::CHL4-GBP-RFP | Present study |
| pHT341 | LEU2 pCUP1::CHL4 | Present study |
| pHT338 | LEU2 pCUP1::CTF3-GBP-RFP | Present study |
| pHT337 | LEU2 pCUP1::CTF3 | Present study |
| pHT239 | LEU2 pCUP1::HTA2-GBP-RFP | Present study |
| pHT238 | LEU2 pCUP1::HTA2 | Present study |
| pHT11 | LEU2 pCUP1::SPC42-GBP-RFP | Present study |
| pHT297 | LEU2 pCUP1::SPC42 | Present study |
| pHT230 | LEU2 pCUP1::ASE1-GBP-RFP | Present study |
| pHT229 | LEU2 pCUP1::ASE1 | Present study |
| pHT431 | LEU2 pCUP1::CDC14-GBP(no RFP) | Present study |
| pHT432 | LEU2 pCUP1::cdc14-C283A-GBP(no RFP) | Present study |
All plasmids are based upon pWJ1512 (32), which contains CEN6 and ARS209.
Supplementary Material
Acknowledgments
We thank Helen Caulston, Dana Pe’er, Grant Brown, Ulrich Rothbauer, Henrich Leonhardt, Rodney Rothstein, Bob Reid, John Dittmar, Frank Uhlmann, Meghna Kataria, and Lisa Berry for reagents, comments on this manuscript, and other help. Singer Instruments provided assistance with high-throughput yeast genomics. This work was funded by the Medical Research Council (MC_UP_A252_1027). The Francis Crick Institute is funded by Cancer Research UK, the Medical Research Council, and the Wellcome Trust.
Footnotes
The authors declare no conflict of interest.
This article is a PNAS Direct Submission.
This article contains supporting information online at www.pnas.org/lookup/suppl/doi:10.1073/pnas.1506101112/-/DCSupplemental.
References
- 1.Scott JD, Pawson T. Cell signaling in space and time: Where proteins come together and when they’re apart. Science. 2009;326(5957):1220–1224. doi: 10.1126/science.1175668. [DOI] [PMC free article] [PubMed] [Google Scholar]
- 2.Nelson WJ. Adaptation of core mechanisms to generate cell polarity. Nature. 2003;422(6933):766–774. doi: 10.1038/nature01602. [DOI] [PMC free article] [PubMed] [Google Scholar]
- 3.Hung MC, Link W. Protein localization in disease and therapy. J Cell Sci. 2011;124(Pt 20):3381–3392. doi: 10.1242/jcs.089110. [DOI] [PubMed] [Google Scholar]
- 4.Tkach JM, et al. Dissecting DNA damage response pathways by analysing protein localization and abundance changes during DNA replication stress. Nat Cell Biol. 2012;14(9):966–976. doi: 10.1038/ncb2549. [DOI] [PMC free article] [PubMed] [Google Scholar]
- 5.Handfield LF, Chong YT, Simmons J, Andrews BJ, Moses AM. Unsupervised clustering of subcellular protein expression patterns in high-throughput microscopy images reveals protein complexes and functional relationships between proteins. PLOS Comput Biol. 2013;9(6):e1003085. doi: 10.1371/journal.pcbi.1003085. [DOI] [PMC free article] [PubMed] [Google Scholar]
- 6.Goshima G, Yanagida M. Establishing biorientation occurs with precocious separation of the sister kinetochores, but not the arms, in the early spindle of budding yeast. Cell. 2000;100(6):619–633. doi: 10.1016/s0092-8674(00)80699-6. [DOI] [PubMed] [Google Scholar]
- 7.He X, Asthana S, Sorger PK. Transient sister chromatid separation and elastic deformation of chromosomes during mitosis in budding yeast. Cell. 2000;101(7):763–775. doi: 10.1016/s0092-8674(00)80888-0. [DOI] [PubMed] [Google Scholar]
- 8.Pearson CG, Maddox PS, Salmon ED, Bloom K. Budding yeast chromosome structure and dynamics during mitosis. J Cell Biol. 2001;152(6):1255–1266. doi: 10.1083/jcb.152.6.1255. [DOI] [PMC free article] [PubMed] [Google Scholar]
- 9.Biggins S. The composition, functions, and regulation of the budding yeast kinetochore. Genetics. 2013;194(4):817–846. doi: 10.1534/genetics.112.145276. [DOI] [PMC free article] [PubMed] [Google Scholar]
- 10.Collins KA, Castillo AR, Tatsutani SY, Biggins S. De novo kinetochore assembly requires the centromeric histone H3 variant. Mol Biol Cell. 2005;16(12):5649–5660. doi: 10.1091/mbc.E05-08-0771. [DOI] [PMC free article] [PubMed] [Google Scholar]
- 11.Ranjitkar P, et al. An E3 ubiquitin ligase prevents ectopic localization of the centromeric histone H3 variant via the centromere targeting domain. Mol Cell. 2010;40(3):455–464. doi: 10.1016/j.molcel.2010.09.025. [DOI] [PMC free article] [PubMed] [Google Scholar]
- 12.Boeckmann L, et al. Phosphorylation of centromeric histone H3 variant regulates chromosome segregation in Saccharomyces cerevisiae. Mol Biol Cell. 2013;24(12):2034–2044. doi: 10.1091/mbc.E12-12-0893. [DOI] [PMC free article] [PubMed] [Google Scholar]
- 13.Akiyoshi B, Biggins S. Cdc14-dependent dephosphorylation of a kinetochore protein prior to anaphase in Saccharomyces cerevisiae. Genetics. 2010;186(4):1487–1491. doi: 10.1534/genetics.110.123653. [DOI] [PMC free article] [PubMed] [Google Scholar]
- 14.Akiyoshi B, et al. The Mub1/Ubr2 ubiquitin ligase complex regulates the conserved Dsn1 kinetochore protein. PLoS Genet. 2013;9(2):e1003216. doi: 10.1371/journal.pgen.1003216. [DOI] [PMC free article] [PubMed] [Google Scholar]
- 15.Musacchio A, Salmon ED. The spindle-assembly checkpoint in space and time. Nat Rev Mol Cell Biol. 2007;8(5):379–393. doi: 10.1038/nrm2163. [DOI] [PubMed] [Google Scholar]
- 16.London N, Biggins S. Mad1 kinetochore recruitment by Mps1-mediated phosphorylation of Bub1 signals the spindle checkpoint. Genes Dev. 2014;28(2):140–152. doi: 10.1101/gad.233700.113. [DOI] [PMC free article] [PubMed] [Google Scholar]
- 17.Yamagishi Y, Yang CH, Tanno Y, Watanabe Y. MPS1/Mph1 phosphorylates the kinetochore protein KNL1/Spc7 to recruit SAC components. Nat Cell Biol. 2012;14(7):746–752. doi: 10.1038/ncb2515. [DOI] [PubMed] [Google Scholar]
- 18.Rothbauer U, et al. A versatile nanotrap for biochemical and functional studies with fluorescent fusion proteins. Mol Cell Proteomics. 2008;7(2):282–289. doi: 10.1074/mcp.M700342-MCP200. [DOI] [PubMed] [Google Scholar]
- 19.Rothbauer U, et al. Targeting and tracing antigens in live cells with fluorescent nanobodies. Nat Methods. 2006;3(11):887–889. doi: 10.1038/nmeth953. [DOI] [PubMed] [Google Scholar]
- 20.Huh WK, et al. Global analysis of protein localization in budding yeast. Nature. 2003;425(6959):686–691. doi: 10.1038/nature02026. [DOI] [PubMed] [Google Scholar]
- 21.Bremmer SC, et al. Cdc14 phosphatases preferentially dephosphorylate a subset of cyclin-dependent kinase (Cdk) sites containing phosphoserine. J Biol Chem. 2012;287(3):1662–1669. doi: 10.1074/jbc.M111.281105. [DOI] [PMC free article] [PubMed] [Google Scholar]
- 22.Ubersax JA, et al. Targets of the cyclin-dependent kinase Cdk1. Nature. 2003;425(6960):859–864. doi: 10.1038/nature02062. [DOI] [PubMed] [Google Scholar]
- 23.Holt LJ, et al. Global analysis of Cdk1 substrate phosphorylation sites provides insights into evolution. Science. 2009;325(5948):1682–1686. doi: 10.1126/science.1172867. [DOI] [PMC free article] [PubMed] [Google Scholar]
- 24.Malvezzi F, et al. A structural basis for kinetochore recruitment of the Ndc80 complex via two distinct centromere receptors. EMBO J. 2013;32(3):409–423. doi: 10.1038/emboj.2012.356. [DOI] [PMC free article] [PubMed] [Google Scholar]
- 25.D’Amours D, Stegmeier F, Amon A. Cdc14 and condensin control the dissolution of cohesin-independent chromosome linkages at repeated DNA. Cell. 2004;117(4):455–469. doi: 10.1016/s0092-8674(04)00413-1. [DOI] [PubMed] [Google Scholar]
- 26.De Wulf P, McAinsh AD, Sorger PK. Hierarchical assembly of the budding yeast kinetochore from multiple subcomplexes. Genes Dev. 2003;17(23):2902–2921. doi: 10.1101/gad.1144403. [DOI] [PMC free article] [PubMed] [Google Scholar]
- 27.Cheeseman IM, Chappie JS, Wilson-Kubalek EM, Desai A. The conserved KMN network constitutes the core microtubule-binding site of the kinetochore. Cell. 2006;127(5):983–997. doi: 10.1016/j.cell.2006.09.039. [DOI] [PubMed] [Google Scholar]
- 28.Przewloka MR, et al. CENP-C is a structural platform for kinetochore assembly. Curr Biol. 2011;21(5):399–405. doi: 10.1016/j.cub.2011.02.005. [DOI] [PubMed] [Google Scholar]
- 29.Screpanti E, et al. Direct binding of Cenp-C to the Mis12 complex joins the inner and outer kinetochore. Curr Biol. 2011;21(5):391–398. doi: 10.1016/j.cub.2010.12.039. [DOI] [PMC free article] [PubMed] [Google Scholar]
- 30.Petrovic A, et al. The MIS12 complex is a protein interaction hub for outer kinetochore assembly. J Cell Biol. 2010;190(5):835–852. doi: 10.1083/jcb.201002070. [DOI] [PMC free article] [PubMed] [Google Scholar]
- 31.Kline SL, Cheeseman IM, Hori T, Fukagawa T, Desai A. The human Mis12 complex is required for kinetochore assembly and proper chromosome segregation. J Cell Biol. 2006;173(1):9–17. doi: 10.1083/jcb.200509158. [DOI] [PMC free article] [PubMed] [Google Scholar]
- 32.Reid RJ, et al. Selective ploidy ablation, a high-throughput plasmid transfer protocol, identifies new genes affecting topoisomerase I-induced DNA damage. Genome Res. 2011;21(3):477–486. doi: 10.1101/gr.109033.110. [DOI] [PMC free article] [PubMed] [Google Scholar]
- 33.Dittmar JC, Reid RJ, Rothstein R. ScreenMill: A freely available software suite for growth measurement, analysis and visualization of high-throughput screen data. BMC Bioinformatics. 2010;11:353. doi: 10.1186/1471-2105-11-353. [DOI] [PMC free article] [PubMed] [Google Scholar]
- 34.Novick P, Osmond BC, Botstein D. Suppressors of yeast actin mutations. Genetics. 1989;121(4):659–674. doi: 10.1093/genetics/121.4.659. [DOI] [PMC free article] [PubMed] [Google Scholar]
- 35.Gavin AC, et al. Functional organization of the yeast proteome by systematic analysis of protein complexes. Nature. 2002;415(6868):141–147. doi: 10.1038/415141a. [DOI] [PubMed] [Google Scholar]
- 36.Dittmar JC, Pierce S, Rothstein R, Reid RJ. Physical and genetic-interaction density reveals functional organization and informs significance cutoffs in genome-wide screens. Proc Natl Acad Sci USA. 2013;110(18):7389–7394. doi: 10.1073/pnas.1219582110. [DOI] [PMC free article] [PubMed] [Google Scholar]
- 37.Eden E, Navon R, Steinfeld I, Lipson D, Yakhini Z. GOrilla: A tool for discovery and visualization of enriched GO terms in ranked gene lists. BMC Bioinformatics. 2009;10:48. doi: 10.1186/1471-2105-10-48. [DOI] [PMC free article] [PubMed] [Google Scholar]
- 38.Thorpe PH, Dittmar JC, Rothstein R. ScreenTroll: A searchable database to compare genome-wide yeast screens. Database (Oxford) 2012;2012:bas022. doi: 10.1093/database/bas022. [DOI] [PMC free article] [PubMed] [Google Scholar]
- 39.Yuen KW, et al. Systematic genome instability screens in yeast and their potential relevance to cancer. Proc Natl Acad Sci USA. 2007;104(10):3925–3930. doi: 10.1073/pnas.0610642104. [DOI] [PMC free article] [PubMed] [Google Scholar]
- 40.Kitada K, Johnson AL, Johnston LH, Sugino A. A multicopy suppressor gene of the Saccharomyces cerevisiae G1 cell cycle mutant gene dbf4 encodes a protein kinase and is identified as CDC5. Mol Cell Biol. 1993;13(7):4445–4457. doi: 10.1128/mcb.13.7.4445. [DOI] [PMC free article] [PubMed] [Google Scholar]
- 41.Queralt E, Uhlmann F. Cdk-counteracting phosphatases unlock mitotic exit. Curr Opin Cell Biol. 2008;20(6):661–668. doi: 10.1016/j.ceb.2008.09.003. [DOI] [PMC free article] [PubMed] [Google Scholar]
- 42.Pereira G, Schiebel E. Separase regulates INCENP-Aurora B anaphase spindle function through Cdc14. Science. 2003;302(5653):2120–2124. doi: 10.1126/science.1091936. [DOI] [PubMed] [Google Scholar]
- 43.Yong-Gonzales V, Hang LE, Castellucci F, Branzei D, Zhao X. The Smc5-Smc6 complex regulates recombination at centromeric regions and affects kinetochore protein sumoylation during normal growth. PLoS One. 2012;7(12):e51540. doi: 10.1371/journal.pone.0051540. [DOI] [PMC free article] [PubMed] [Google Scholar]
- 44.Liu D, Davydenko O, Lampson MA. Polo-like kinase-1 regulates kinetochore-microtubule dynamics and spindle checkpoint silencing. J Cell Biol. 2012;198(4):491–499. doi: 10.1083/jcb.201205090. [DOI] [PMC free article] [PubMed] [Google Scholar]
- 45.Kao L, et al. Global analysis of cdc14 dephosphorylation sites reveals essential regulatory role in mitosis and cytokinesis. Mol Cell Proteomics. 2014;13(2):594–605. doi: 10.1074/mcp.M113.032680. [DOI] [PMC free article] [PubMed] [Google Scholar]
- 46.Widlund PO, et al. Phosphorylation of the chromosomal passenger protein Bir1 is required for localization of Ndc10 to the spindle during anaphase and full spindle elongation. Mol Biol Cell. 2006;17(3):1065–1074. doi: 10.1091/mbc.E05-07-0640. [DOI] [PMC free article] [PubMed] [Google Scholar]
- 47.Akiyoshi B, Nelson CR, Ranish JA, Biggins S. Quantitative proteomic analysis of purified yeast kinetochores identifies a PP1 regulatory subunit. Genes Dev. 2009;23(24):2887–2899. doi: 10.1101/gad.1865909. [DOI] [PMC free article] [PubMed] [Google Scholar]
- 48.Taylor GS, Liu Y, Baskerville C, Charbonneau H. The activity of Cdc14p, an oligomeric dual specificity protein phosphatase from Saccharomyces cerevisiae, is required for cell cycle progression. J Biol Chem. 1997;272(38):24054–24063. doi: 10.1074/jbc.272.38.24054. [DOI] [PubMed] [Google Scholar]
- 49.Gray CH, Good VM, Tonks NK, Barford D. The structure of the cell cycle protein Cdc14 reveals a proline-directed protein phosphatase. EMBO J. 2003;22(14):3524–3535. doi: 10.1093/emboj/cdg348. [DOI] [PMC free article] [PubMed] [Google Scholar]
- 50.Lyons NA, Morgan DO. Cdk1-dependent destruction of Eco1 prevents cohesion establishment after S phase. Mol Cell. 2011;42(3):378–389. doi: 10.1016/j.molcel.2011.03.023. [DOI] [PMC free article] [PubMed] [Google Scholar]
- 51.Coudreuse D, Nurse P. Driving the cell cycle with a minimal CDK control network. Nature. 2010;468(7327):1074–1079. doi: 10.1038/nature09543. [DOI] [PubMed] [Google Scholar]
- 52.Sherman F. Getting started with yeast. Methods Enzymol. 2002;350:3–41. doi: 10.1016/s0076-6879(02)50954-x. [DOI] [PubMed] [Google Scholar]
- 53.Baryshnikova A, et al. Quantitative analysis of fitness and genetic interactions in yeast on a genome scale. Nat Methods. 2010;7(12):1017–1024. doi: 10.1038/nmeth.1534. [DOI] [PMC free article] [PubMed] [Google Scholar]
- 54.Collins SR, Schuldiner M, Krogan NJ, Weissman JS. A strategy for extracting and analyzing large-scale quantitative epistatic interaction data. Genome Biol. 2006;7(7):R63. doi: 10.1186/gb-2006-7-7-r63. [DOI] [PMC free article] [PubMed] [Google Scholar]
- 55.Keogh MC, et al. A phosphatase complex that dephosphorylates gammaH2AX regulates DNA damage checkpoint recovery. Nature. 2006;439(7075):497–501. doi: 10.1038/nature04384. [DOI] [PubMed] [Google Scholar]
- 56.Thomas BJ, Rothstein R. The genetic control of direct-repeat recombination in Saccharomyces: The effect of rad52 and rad1 on mitotic recombination at GAL10, a transcriptionally regulated gene. Genetics. 1989;123(4):725–738. doi: 10.1093/genetics/123.4.725. [DOI] [PMC free article] [PubMed] [Google Scholar]
- 57.Zou H, Rothstein R. Holliday junctions accumulate in replication mutants via a RecA homolog-independent mechanism. Cell. 1997;90(1):87–96. doi: 10.1016/s0092-8674(00)80316-5. [DOI] [PubMed] [Google Scholar]
Associated Data
This section collects any data citations, data availability statements, or supplementary materials included in this article.


