Significance
Recent studies of the murine microbiome have revealed circadian behavior and linked it to host feeding time, but the mechanism responsible for rhythmicity has not been fully clarified. Here we report that both the host circadian system and host gender influence the rhythmicity of the total load and taxonomic abundances in the fecal microbiota, and that regulation by the host clock is dominant. Disruption of the host circadian clock by deletion of Bmal1 altered the fecal microbial composition in a gender-dependent fashion. Our analyses suggest the need to consider circadian factors and host gender in the design of microbiome studies, and highlight the importance of analyzing absolute abundance in understanding the microbiota.
Keywords: microbiome, Bmal1 gene, circadian rhythm, gender differences
Abstract
In mammals, multiple physiological, metabolic, and behavioral processes are subject to circadian rhythms, adapting to changing light in the environment. Here we analyzed circadian rhythms in the fecal microbiota of mice using deep sequencing, and found that the absolute amount of fecal bacteria and the abundance of Bacteroidetes exhibited circadian rhythmicity, which was more pronounced in female mice. Disruption of the host circadian clock by deletion of Bmal1, a gene encoding a core molecular clock component, abolished rhythmicity in the fecal microbiota composition in both genders. Bmal1 deletion also induced alterations in bacterial abundances in feces, with differential effects based on sex. Thus, although host behavior, such as time of feeding, is of recognized importance, here we show that sex interacts with the host circadian clock, and they collectively shape the circadian rhythmicity and composition of the fecal microbiota in mice.
The composition of intestinal microbiota is influenced by host genetics (1), aging (2), antibiotic exposure (3), lifestyle (4), diet (5), pet ownership (6), and concomitant disease (7, 8). The impact of diet in shaping the composition of the microbiota has been well established in both humans and mice (9, 10). The type of food consumed and also the feeding behavior of the host influence the microbiota. For example, a 24-h fast increases the abundance of Bacteroidetes and reduces that of Firmicutes in mouse cecum, without altering the communal microbial diversity (11). Bacteroidetes are also dominant in the microbiota of the fasted Burmese python, whereas ingestion of a meal shifts the intestinal composition toward Firmicutes (12).
The rotation of the earth results in the oscillation of light during the 24-h cycle. Organisms adapted to this cycle by developing a circadian rhythm, an endogenous and entrainable mechanism that times daily events such as feeding, temperature, sleep-wakefulness, hormone secretion, and metabolic homeostasis (13, 14). In mammals, this rhythm is controlled by a master clock that resides in the suprachiasmatic nucleus of the hypothalamus. It responds to the changing light cycle and signals this information to peripheral clocks in most tissues (15). The core mammalian clock is comprised of activators BMAL1 and CLOCK as well as repressors PERIOD (PER) and CRYPTOCHROME (CRY), forming an interlocked regulatory loop (14).
Circadian rhythms also exist in fungi and cyanobacteria (16). For example, a pacemaker in cyanobacteria transduces the oscillating daylight signal to regulate gene expression and to time cell division (17, 18). Hence, the synchronization of endogenous circadian rhythms with the environment is crucial for the survival of the bacteria as well as metazoa.
Recent studies show that the intestinal microbiota undergo diurnal oscillation under the control of host feeding time, and that ablation of the host molecular clock Per genes causes dysbiosis (19, 20). Here, we report that microbial composition and its oscillation are influenced by the host clock, including the Bmal1-dependent forward limb of the signaling pathway. We also find that rhythmicity is conditioned by the sex of the host, being more pronounced in females than in males.
Results
Diurnal Oscillation of the Microbiota in C57BL/6 Mice.
The circadian behavior in the fecal microbiota of wild-type mice was assessed by sampling fecal pellets from each mouse every 4 h for 48 h. Circadian rhythmicity of the fecal microbiota was tested by the JTK_CYCLE algorithm (21). The fecal bacterial load, as measured by the total 16S rRNA gene copy numbers, oscillated diurnally during the light–dark cycle both in the group as a whole (Fig. 1A) and when segregated by sex (Fig. 1B). The bacterial load peaked around 11:00 PM and gradually decreased toward the late dark phase until the lowest level was noted around 7:00 AM when the light was on. Male mice had more bacteria overall in feces than female mice; however, female mice showed more significant diurnal oscillation (P = 2.8E-06) than male mice (P = 0.032). The relative abundances of Bacteroidetes and Firmicutes, the two most abundant components of mammalian microbiota, varied during the light–dark cycle (Fig. 1C). The average abundance of Bacteroidetes was higher at 11:00 PM (66%) and 11:00 AM (60%) and lower at other times, whereas that of Firmicutes was higher at 3:00 AM (45%) and 7:00 AM (45%) and lowest at 11:00 PM (29%).
Fig. 1.
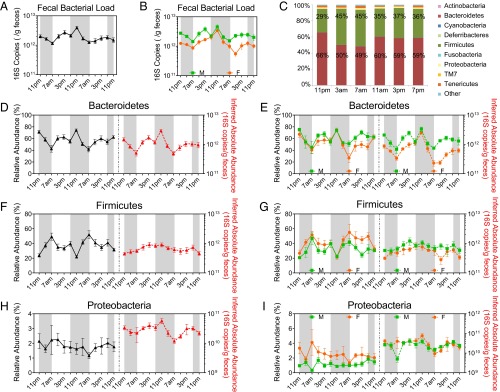
Diurnal oscillation of intestinal microbiota composition in C57BL/6 mice. (A and B) Fecal bacterial load oscillates diurnally in mice both when combined (A) and separated by sex (B), as indicated by 16S rRNA copy numbers normalized to sample weight. JTK_ CYCLE revealed P = 0.00012 for mice of combined genders, P = 0.032 for male mice, and P = 2.8E-06 for female mice. (C) Bar graphs of average relative abundances of bacterial phyla in fecal microbial communities of combined genders at different time-of-day. Bacteroidetes (red) and Firmicutes (green) proportions are labeled. (D–I) The relative abundance (left y axis) and inferred absolute abundance (right y axis) of Bacteroidetes of combined genders (D, pr = 0.00012 and pa = 1.7E-06), male and female sex (E, pr = 0.025 and pa = 0.0029 for male mice; pr = 0.0006 and pa = 9.5E-10 for female mice); Firmicutes of combined genders (F, pr = 6.3E-05 and pa = 1), male and female sex (G, pr= 0.049 and pa = 1 for male mice; pr = 0.0011 and pa = 1 for female mice); and Proteobacteria of combined genders (H, pr = 1 and pa = 0.00065), male and female sex (I, pr= 0.69 and pa= 0.0047 for male mice; pr = 1 and pa = 0.13 for female mice). Nmale = 7, Nfemale = 7. M, male; F, female. r, relative abundance; a, inferred absolute abundance. The dark phase is indicated by gray shading.
The microbiota composition can be analyzed by relative abundance or by absolute abundance. The former is commonly used, yet it may exaggerate or mask the actual microbial behavior. For these reasons, we present analysis of both. We observed diurnal oscillations in fecal microbial composition at the phylum level (Fig. 1 D–I). Both the relative abundance and the inferred absolute abundance of Bacteroidetes oscillate during the light–dark cycle in mice of combined genders (Fig. 1D), as well as in either male or female mice (Fig. 1E). Bacteroidetes were most abundant at 11:00 PM and least abundant at 7:00 AM. The relative abundance of Firmicutes oscillates diurnally in mice of both combined (Fig. 1F) and separate (Fig. 1G) genders, exhibiting a contrasting pattern compared with Bacteroidetes. However, the inferred absolute abundance of Firmicutes did not oscillate in mice (Fig. 1 F and G). No diurnal oscillation was observed in the relative abundance of Proteobacteria, regardless of the sex (Fig. 1 H and I). In contrast, the inferred absolute abundance of Proteobacteria oscillates during the light–dark cycle (Fig. 1H), primarily due to the oscillation in male mice (Fig. 1I).
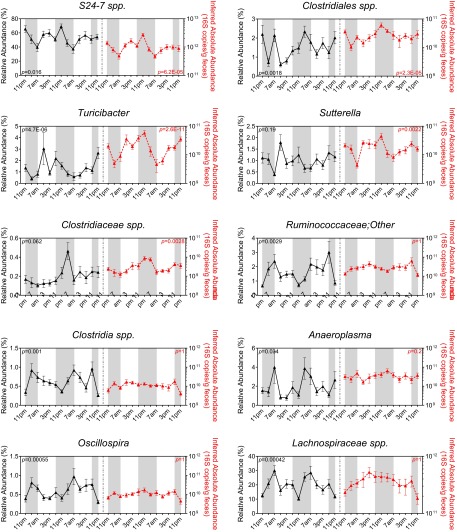
Examination of genus-level assignments (Fig. S1) revealed that both relative and inferred absolute abundances of S24-7 spp., a major genus of Bacteroidetes, oscillate in the same pattern as Bacteroidetes. Clostridiales spp. and Turicibacter, genera of Firmicutes, exhibit significant oscillation, not only in their relative abundance, but also in their inferred absolute abundance. Clostridiaceae spp., a Firmicutes, oscillates diurnally in its inferred absolute abundance but not in its relative abundance. Several other abundant genera in Firmicutes, including Ruminococcaceae spp., Clostridia spp., Lachnospiraceae spp., and Oscillospira, as well as Anaeroplasma, a Tenericutes, oscillate in their relative abundance, but not in their inferred absolute abundance. The inferred absolute abundance of Sutterella oscillates diurnally, primarily driving the oscillation in Proteobacteria.
Fig. S1.
Diurnal oscillation of genus abundances in C57BL/6 mice. The relative abundance (black, left y axis) and inferred absolute abundance (red, right y axis) at genus level. Bonferroni-adjusted P values from JTK_CYCLE are indicated on each figure (black, P value for relative abundance; red, P value for inferred absolute abundance). S24-7 spp., Clostridiales spp., and Turicibacter exhibited significant diurnal oscillation in both relative and inferred absolute abundance. Sutterella and Clostridiaceae spp. exhibit significant diurnal oscillation in inferred absolute abundance, but not in relative abundance. Ruminococcaceae spp., Clostridia spp., Anaeroplasma, Oscillospira, and Lachnospiraceae spp. exhibit significant diurnal oscillation in relative abundance, but not in inferred absolute abundance. n = 14. Mean ± SEM shown.
Bmal1 Deletion Abolishes the Diurnal Oscillations of Microbiota Composition in Mice.
Bmal1 is a nonredundant and essential component of the mammalian autoregulatory negative feedback loop that is responsible for generating molecular circadian rhythms (15, 22). Deletion of Bmal1 disrupts the host circadian clock with loss of rhythmicity in animals in constant darkness. To investigate the effect of Bmal1 deletion on the microbiota, we analyzed fecal pellets from Bmal1 knock out (KO) mice and wild-type (WT) littermate controls every 4 h for 48 h.
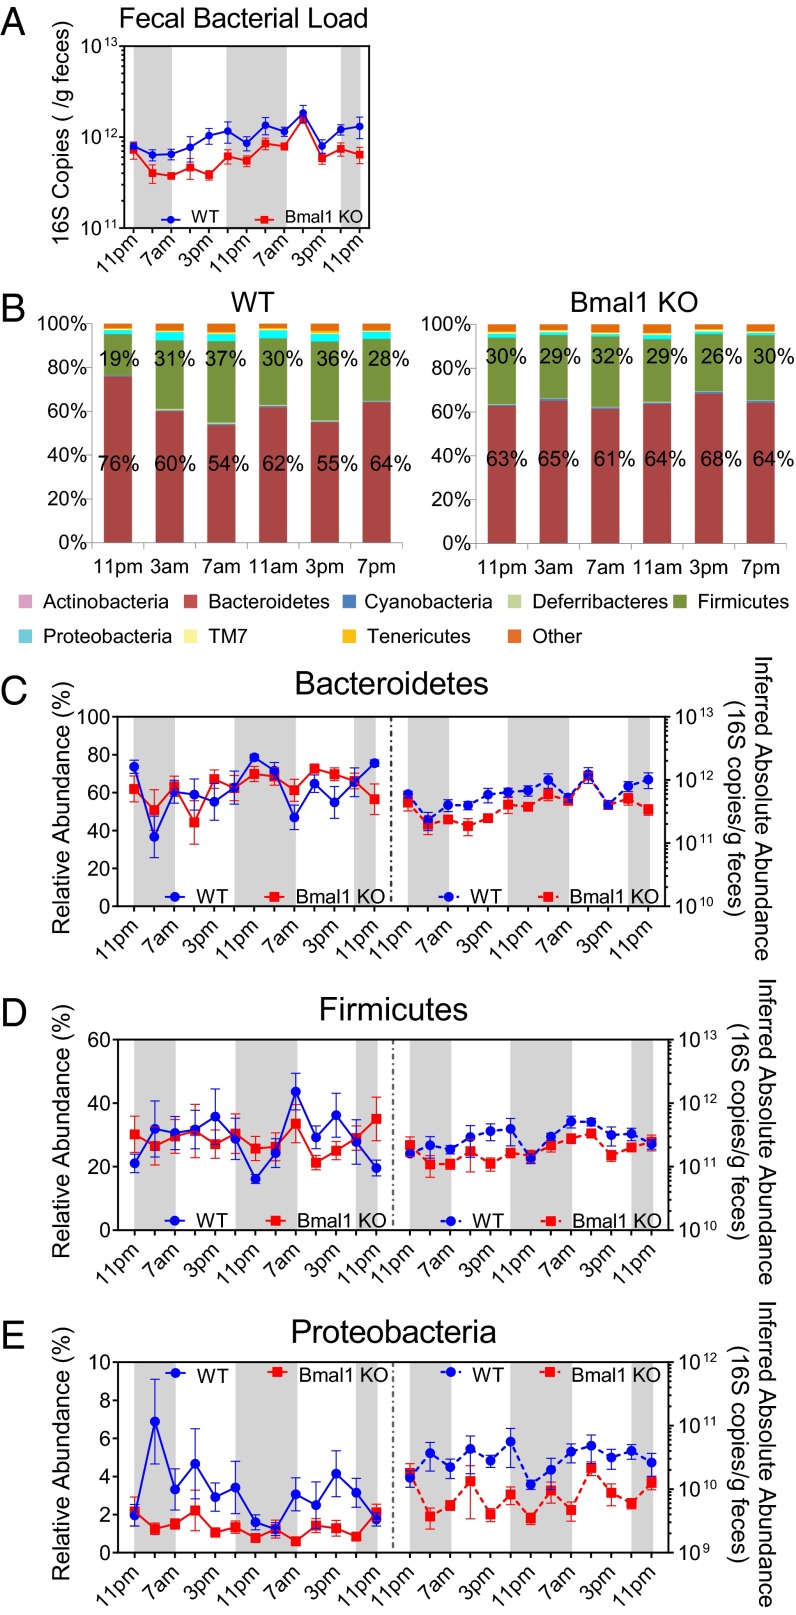
The total bacterial load in WT and Bmal1 KO mice showed a similar fluctuating pattern, although those in Bmal1 KO mice were depressed relative to WT mice (Fig. 2A). In WT mice, the average abundance of Bacteroidetes was highest at 11:00 PM (76%) lowest at 7:00 AM (54%), and that of Firmicutes was highest at 7:00 AM (37%) and lowest at 11:00 PM (19%). In contrast, variability in the composition of the microbiota was suppressed in Bmal1 KO mice (Fig. 2B).
Fig. 2.
Deletion of Bmal1 abolishes the diurnal oscillation of intestinal microbiota composition in mice. (A) Fecal bacterial load in Bmal1 KO mice (red) was slightly lower than that in WT mice (blue) but showed a similar fluctuating pattern during the light–dark cycle. (B) Bar graphs of average relative abundances of bacterial phyla in fecal microbial communities of WT (Left) and Bmal1 KO (Right) mice at the indicated times of day. Bacteroidetes (red) and Firmicutes (green) proportions are labeled. (C–E) The relative abundance (left y axis) and inferred absolute abundance (right y axis) of Bacteroidetes (C) of WT (pr = 0.0075 and pa = 0.39) and Bmal1 KO (pr = 1 and pa = 1) mice; Firmicutes (D) of WT (pr = 0.017 and pa = 0.093) and Bmal1 KO (pr = 1 and pa = 1) mice; and Proteobacteria (E) of WT (pr = 0.52 and pa = 1) and Bmal1 KO (pr = 1 and pa = 1) mice. NWT = 5, NBmal1 KO = 6. r, relative abundance; a, inferred absolute abundance. The dark phase is indicated by gray shading.
JTK_CYCLE analysis revealed significant diurnal rhythmicity of the relative abundances of Bacteroidetes and Firmicutes in WT mice (P = 0.0075 and P = 0.017, respectively) but none in Bmal1 KO mice (P = 1 for both) (Fig. 2). No oscillation was observed in the inferred absolute abundances of these two phyla in WT mice or Bmal1 KO mice (Fig. 2), possibly due to an unexpectedly high 16S copy number at 11:00 AM of the second cycle. Proteobacteria did not oscillate in WT or Bmal1 KO mice (Fig. 2E). At the genus level, both relative and inferred absolute abundances of Bacteroides and Lacotobacillaceae spp. oscillate significantly in WT mice, and this oscillation was abolished in Bmal1 KO mice (Fig. S2). In contrast, the relative abundances of S24-7 spp. and Clostridia spp. oscillate in WT mice but not in Bmal1 KO mice, whereas their inferred absolute abundances failed to oscillate in either group (Fig. S2).
Fig. S2.
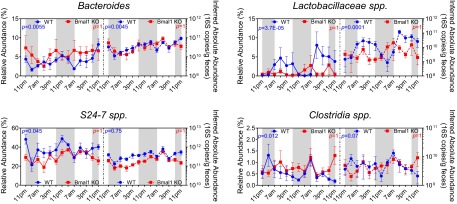
Effect of Bmal1 deletion on the rhythmicity of bacterial genera in mice. The relative abundance (left y axis) and inferred absolute abundance right y axis) in WT (blue) and Bmal1 KO mice (red) at genus level. Bonferroni-adjusted P values from JTK_CYCLE are indicated on each figure (blue, P value for WT mice; red, P value for Bmal1 KO mice). Bacteroides and Lacotobacillaceae spp. oscillate significantly in WT mice in both relative and inferred absolute abundance, but not in Bmal1 KO mice. S24-7 spp. and Clostridia spp. relative abundances oscillate in WT mice but not in Bmal1 KO mice; whereas its absolute abundance didn’t oscillate. NWT = 5, NBmal1 KO = 6. Mean ± SEM shown.
Bmal1 Deletion Alters the Microbiota Composition.
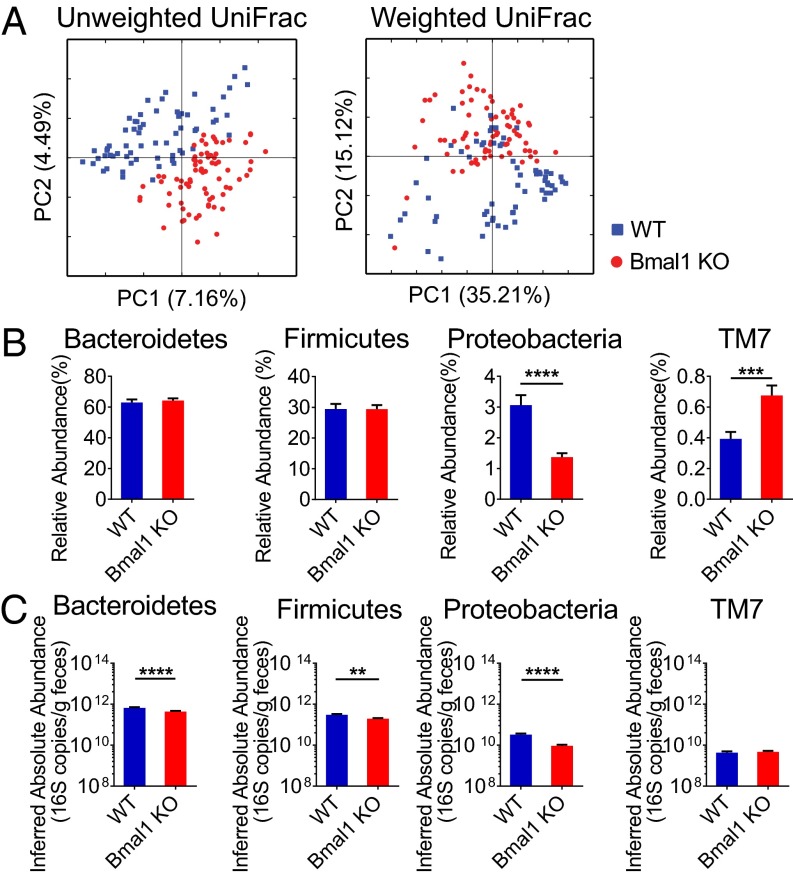
The microbial compositions of WT and Bmal1 KO mice were assessed using UniFrac, which is a phylogeny-based measure of the degree of similarity between microbial communities (23). Pairwise distances were determined for all pairs of samples based on either the taxonomic representation (unweighted), or the types and relative abundances (weighted). Principal Coordinate Analysis (PCoA) (24) based on the UniFrac distances (25) was used to visualize the differences among samples.
The microbial community composition in Bmal1 KO mice and WT mice was different based on presence–absence analysis (Fig. 3A) (unweighted UniFrac, P = 0.03), although the abundance-weighted analysis did not alter significantly (weighted UniFrac, P = 0.19). The degree of difference between genotypes did not depend on the time of day when the samples were collected (unweighted UniFrac, P = 0.97).
Fig. 3.
Bmal1 deletion alters bacterial abundances in fecal microbiota in mice. Fecal microbiota compositions from WT and Bmal1 KO mice at all time points across the day were compared. (A) Fecal microbiota composition from individual WT mice (blue) and Bmal1 KO mice (red) were clustered separately according to Principal Coordinate Analysis of Unweighted UniFrac (Left) and Weighted UniFrac (Right) distances. The percentages of variation explained by principal coordinates PC1 and PC2 are indicated on the x and y axes. (B) The relative abundance of Proteobacteria was decreased and that of TM7 was increased in Bmal1 KO mice, whereas those of Bacteroidetes and Firmicutes were not altered. (C) The inferred absolute abundance of Baceroidetes, Firmicutes, and Proteobacteria were decreased in Bmal1 KO mice, whereas that of TM7 was not altered. NWT = 5, NBmal1 KO = 6. **P < 0.01, ***P < 0.001, ****P < 0.0001 by Mann–Whitney test. All remained significant when adjusted to control for a false positive rate of 5%.
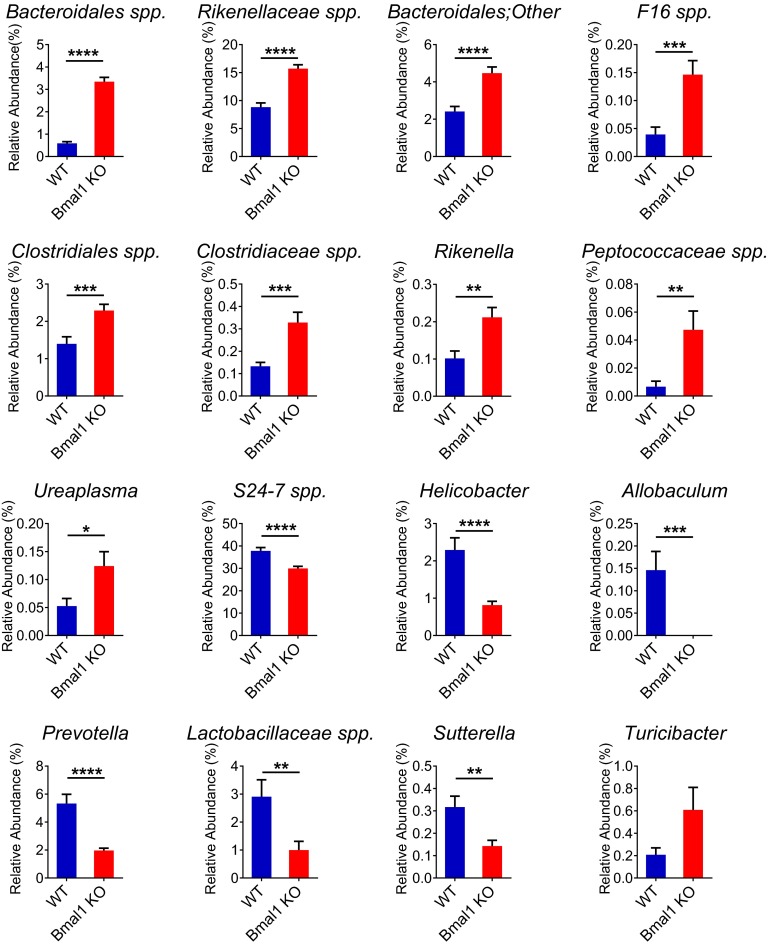
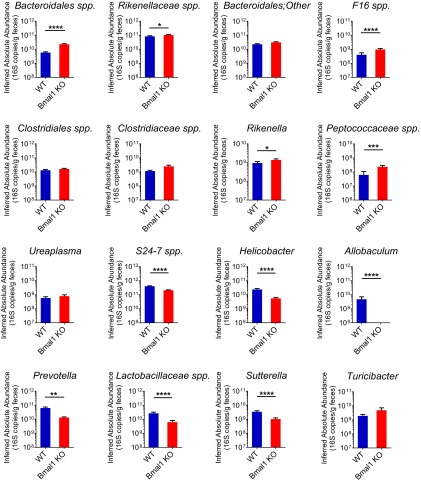
Taxonomic abundances were influenced by Bmal1-deletion at multiple levels. The relative abundance of Bacteroidetes was comparable in WT and Bmal1 KO mice (Fig. 3B). Several genera of it, including Bacteroidales spp., Rikenellaceae spp., and Rikenella, were increased in their relative abundances in Bmal1 KO mice (Fig. S3). These increases were nearly evened out by the decrease of S24-7 spp. and Prevotella, resulting in the unchanged proportion of Bacteroidetes. In contrast, the inferred absolute abundance of Bacteroidetes was reduced in Bmal1 KO mice (Fig. 3C). The highly-abundant S24-7 spp. and Prevotella was decreased, which overcame the increases of the absolute amount of Bacteroidales spp., Rikenellaceae spp., and Rikenella (Fig. S4), accounting for the overall decrease of Bacteroidetes absolute abundance.
Fig. S3.
Bmal1 deletion alters relative abundances at genus level in fecal microbiota in mice. The relative abundances at genus level in WT mice (blue) and Bmal1 KO mice (red). The relative abundance of Bacteroidales spp., Rikenellaceae spp., F16 spp., Clostidiales spp., Clostridiaceae spp., Rikenella, Peptococaceae spp., and Ureaplasma were increased in Bmal1 KO mice. The relative abundance of S24-7 spp., Helicobacter, Allobaculum, Prevotella, Lactobacillaceae spp., and Sutterella were decreased in Bmal1 KO mice. NWT = 5, NBmal1 KO = 6. Mean ± SEM shown. *P < 0.05, **P < 0.01, ***P < 0.001, ****P < 0.0001 by Mann–Whitney test. All remained significant when adjusted to control for a false positive rate of 5%.
Fig. S4.
Bmal1 deletion alters inferred absolute abundances at genus level in fecal microbiota in mice. The inferred absolute abundances at genus level in WT mice (blue) and Bmal1 KO mice (red). The inferred absolute abundance of Bacteroidales spp., Rikenellaceae spp., F16 spp., Rikenella, and Peptococaceae spp. were increased in Bmal1 KO mice. The inferred absolute abundance of S24-7 spp., Helicobacter, Allobaculum, Prevotella, Lactobacillaceae spp., and Sutterella were decreased in Bmal1 KO mice. NWT = 5, NBmal1 KO = 6. Mean ± SEM shown. *P < 0.05, **P < 0.01, ***P < 0.001, ****P < 0.0001 by Mann–Whitney test. Ten out of 11 remained significant when adjusted to control for a false positive rate of 5%.
Firmicutes were similarly influenced by Bmal1 deletion. The unchanged proportion of Firmicutes (Fig. 3B) was driven by the increase of Clostridiales spp., Clostridiaceae spp., and Peptococcaceae spp. and the decreases of Allobaculum and Lactobacillaceae spp. (Fig. S3). The decreased absolute abundance was attributable to the decrease of Allobaculum and Lactobacillaceae spp., despite the small increase of Peptococcaceae spp. (Fig. S4).
Protebacteria were decreased in both relative and inferred absolute abundances in Bmal1 KO mice (Fig. 3B), primarily driven by the reduction of Helicobacter and Sutterella (Fig. S3 and S4). The relative abundance of TM7 was increased (Fig. 3B) in Bma1 KO mice, partially attributable to the increase of F16 spp. (Fig. S3). Despite the increase of F16 spp. absolute abundance in Bmal1 KO mice (Fig. S4), TM7 were unchanged (Fig. 3C).
Bmal1 Deletion-Induced Changes in the Microbiota Are Sex-Dependent.
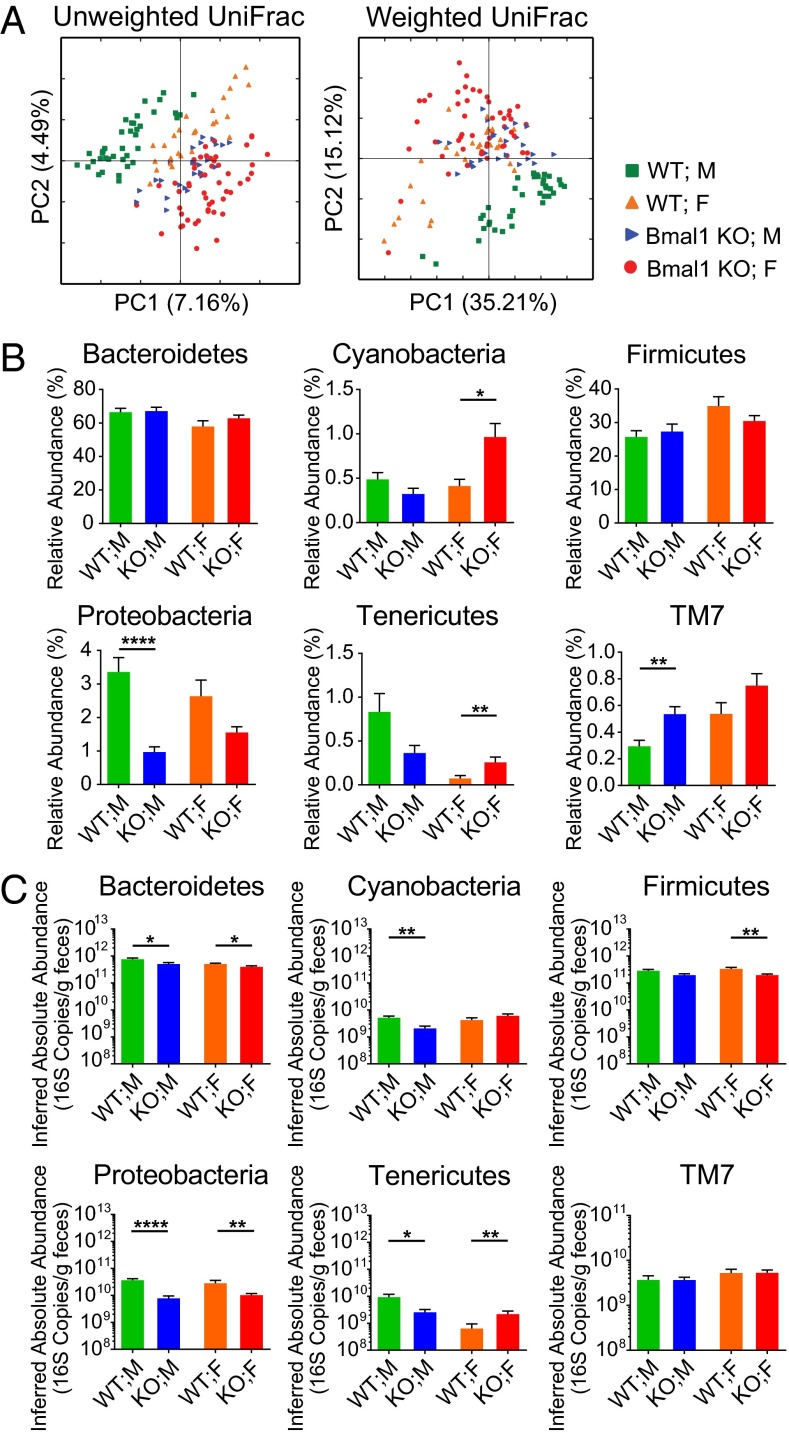
Principal Coordinate Analyses revealed sex differences in microbiota composition (Fig. 4A) (P = 0.026 for unweighted UniFrac; P = 0.007 for weighted UniFrac). The effect of Bmal1 deletion was comparable for male and female mice. The microbiota composition of male Bmal1 KO mice was more similar to female WT mice than male WT mice (Mann–Whitney P < 0.001 for unweighted and weighted UniFrac).
Fig. 4.
Intestinal microbiota compositions of male and female mice respond differently to Bmal1 deletion. Fecal microbiota profiles from individual mice at all time points across the day were compared based on sex and genotype. (A) Fecal microbiota composition of male WT mice (green), male Bmal1 KO mice (blue), female WT mice (orange), and female Bmal1 KO mice (red) were clustered according to Principal Coordinate Analysis of Unweighted UniFrac (left) and Weighted UniFrac (right) distances. Percentages of variation explained by principal coordinates PC1 and PC2 are indicated on the x and y axes. (B) The relative abundances at phylum level. (C) The inferred absolute abundances at phylum level. NWT = 5, NBmal1 KO = 6. M, male; F, female. *P < 0.05, **P < 0.01, ****P < 0.0001 by Mann–Whitney test. Eleven out of 12 remained significant when adjusted to control for a false positive rate of 5%.
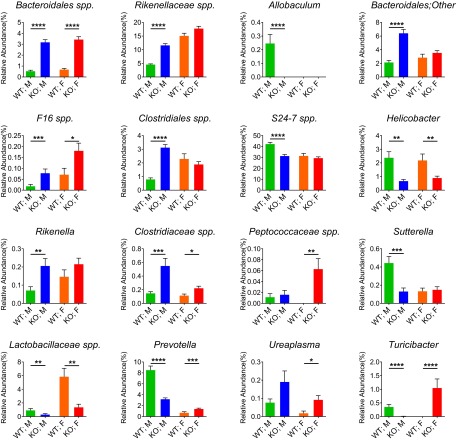
In male mice, Bmal1 deletion was associated with a significant decrease of Proteobacteria and an increase of TM7 in their relative abundances (Fig. 4B). Consistently, the relative abundances of Helicobacter and Sutterella, two genera of Proteobacteria, were decreased, and that of F16 spp., a TM7, was increased in male Bmal1 KO mice (Fig. S5). In female Bmal1 KO mice, however, Proteobacteria and TM7 were unchanged, but the relative abundances of Cyanobacteria and Tenericutes were increased (Fig. 4B). The increase in the relative abundance of Ureaplasma (Fig. S4) explained the changes in Tenericutes.
Fig. S5.
Bmal1 deletion differentially alters the relative abundances at genus level in female and male mice. The relative abundances at genus level in male WT mice (green), male Bmal1 KO mice (blue), female WT mice (orange), and female Bmal1 KO mice (red). The relative abundances of Bacteroidales spp., F16 spp., and Clostridiaceae spp. were increased in both male and female Bmal1 KO mice. The relative abundances of Helicobacter and Lactobacillaceae spp. were decreased in both male and female Bmal1 KO mice. The relative abundances of Prevotella and Turicibacter were decreased in male but increased in female Bmal1 KO mice. The relative abundances of Rikenellaceae spp., Bacteroidales(other), Clostridiales spp., and Rikenella were increased in male Bmal1 KO mice. The relative abundance of Allobaculum, S24-7 spp. and Sutterella were decreased in male Bmal1 KO mice. The relative abundance of Peptococaceae spp. and Ureaplasma were increased in female Bmal1 KO mice. NWT = 5, NBmal1 KO = 6. Mean ± SEM shown. *P < 0.05, **P < 0.01, ****P < 0.0001 by Mann–Whitney test. Twenty two out of 23 remained significant when adjusted to control for a false positive rate of 5%.
There were no significant differences between male and female Bmal1 KO mice at the phylum level for Bacteroidetes and Firmicutes, but differences could be detected at the genus level (Fig. 4B). In male mice, Bmal1 deletion was associated with significant increases of Bacteroidales spp., Rikenellaceae spp., Rikenella, Clostridiales spp., and Clostridiaceae spp. proportions, as well as significant decreases of S24-7 spp., Prevotella, Allobaculum, and Lactobacillaceae spp. proportions (Fig. S5). In female mice, Bmal1 deletion was associated with significant increases of Bacteroidales spp., Clostridiaceae spp., Peptococcaceae spp., and Prevotella, as well as significant decreases of Lactobacillaceae spp. (Fig. S5).
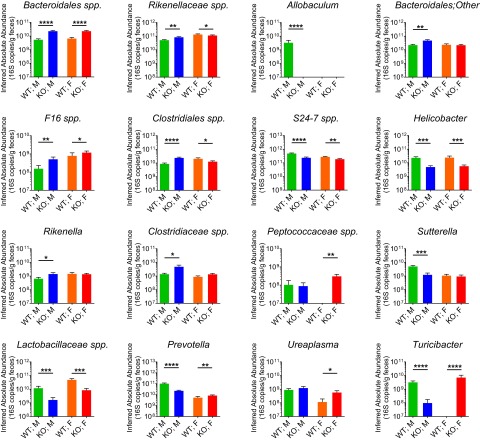
In male Bmal1 KO mice, the absolute abundance of Proteobacteria was decreased and that of TM7 was increased (Fig. 4C), driven by the decrease of Helicobacter and Sutterella and the increase of F16 spp., respectively. Bacteroidetes were decreased in male Bmal1 KO mice, an effect of expansion of Bacteroidales spp., Rikenellaceae spp., and Rikenella, and reduction of S24-7 spp. and Prevotella (Fig. S6). In female Bmal1 KO mice, the absolute abundance of Tenericutes was increased (Fig. 4C), as driven by the increase of Ureaplasma abundance (Fig. S6). In addition, the inferred absolute abundances of Bacteroidetes, Firmicutes, and Proteobacteria were decreased in female Bmal1 KO mice (Fig. 4C)–Bacteroidales spp., Peptococcaceae spp., Prevotella, and Turicibacter were expanded, whereas Rikenellaceae spp., S24-7 spp., Clostridiales spp., Lactobacillaceae spp., and Helicobacter were reduced (Fig. S6).
Fig. S6.
Bmal1 deletion differentially alters the inferred absolute abundances at genus level in female and male mice. The inferred absolute abundances at genus level in male WT mice (green), male Bmal1 KO mice (blue), female WT mice (orange), and female Bmal1 KO mice (red). The inferred absolute abundances of Bacteroidales spp., and F16 spp. were increased in both male and female Bmal1 KO mice. The inferred absolute abundances of S24-7 spp., Helicobacter and Lactobacillaceae spp. were decreased in both male and female Bmal1 KO mice. The inferred absolute abundances of Prevotella and Turicibacter were decreased in male but increased in female Bmal1 KO mice. The inferred absolute abundances of Rikenellaceae spp. and Clostridiales spp. were increased in male but decreased in female Bmal1 KO mice. The inferred absolute abundances of Bacteroidales;Other, Clostridiaceae spp., and Rikenella were increased in male Bmal1 KO mice. The inferred absolute abundance of Allobaculum, and Sutterella were decreased in male Bmal1 KO mice. The inferred absolute abundance of Peptococaceae spp. and Ureaplasma were increased in female Bmal1 KO mice. NWT = 5, NBmal1 KO = 6. Mean ± SEM shown. *P < 0.05, **P < 0.01, ****P < 0.0001 by Mann–Whitney test. Twenty four out of 25 remained significant when adjusted to control for a false positive rate of 5%.
Discussion
Here we provide evidence that the microbiota exhibit daily fluctuations, and begin to specify the factors that influence these oscillations. The fecal microbiota, including the microbial load and its composition, oscillate diurnally in mice. Two groups recently reported circadian variations of the relative taxonomic abundances in fecal microbiota (19, 20), but to our knowledge, this study is the first to show variation in the fecal bacterial load and the derived absolute abundances. We also find, unexpectedly, that this oscillation is more pronounced in female than in male mice. Deletion of Bmal1, the central component of the forward limb in host circadian clock, not only abolished the circadian behavior of fecal microbiota in both genders, but also shifted the microbiota configuration in a sex-dependent way.
Consistent with previous observations (19, 20), we observed diurnal oscillation in the relative abundance of Bacteroidetes and Firmicutes (Fig. 1). Bacteroidetes peaked several hours after the beginning of the dark phase and Firmicutes peaked around the beginning of the light phase. Cyclical fluctuations were detected in abundances at genus level, including Lachnospiraceae spp., Oscillospira, Ruminococcaceae spp., Clostridiales spp., Clostridia spp., and Anaeroplasma. Thaiss and colleagues found that the rhythmicity of microbiota composition is mostly lost after ablation of Per1 and Per2 genes, which are key components of the host molecular clock (19). A complication in the interpretation is that deletion of Per1 and Per2 has pleiotropic effects extending beyond just circadian behavior, such as involvement in cell growth and cell cycle regulation (26). Deleting Bmal1, which leads to arhythmicity without pleiotropic effects, also abolishes the diurnal oscillation in fecal microbiota. Collectively, both activator (Bmal1) and repressor (Per1,2) genes in the core clock of the host are fundamental to the oscillation of fecal microbiota composition, further strengthening the association of the host clock with microbiota rhythmicity in mice.
Measurement of the total microbial load provides an opportunity to assess changes in the absolute abundances of bacteria. We found that the absolute abundance of Bacteroidetes oscillates diurnally, whereas that of Firmicutes only showed slight fluctuation over time (Fig. 1). Additionally, the absolute abundance of Proteobacteria oscillates, although its relative abundance does not. This might be attributable to its low abundance. Therefore, variation of Bacteroidetes during the day is the main driving force of the circadian oscillation of total bacterial load, as well as the proportional changes of themselves and Firmicutes. Although microbiomic data are often presented as relative abundances, their discordance with absolute abundances as reflected in this study emphasizes the importance of also presenting the latter. Conclusions solely relying on the relative abundances may be misleading. In our work and in previous publications, analysis of relative proportions suggests oscillation of Firmicutes during the light–dark cycle (19, 20). However, this is attributable to the significant variation of Bacteroidetes, which are highly abundant and oscillate, rather than the variation of Firmicutes, which are relatively stable throughout the day but change in proportion due to outgrowth of Bacteriodetes.
Consumed food influences the microbial communities in the intestine. Fasting is associated with Bacteroidetes dominance and ingestion of food with a proportional increase of Firmicutes (11, 12). Mice are active in the dark phase and consume the majority of their food during the first several hours of the dark phase (27). Therefore, during the daytime, when the mice are resting and consuming less food, Bacteroidetes are predominant, reaching the highest abundance toward the end of the light phase. The influence of food may reflect the varying nutrient availability to bacteria. Glycans and polysaccharides from the diet and the host mucus provide carbon sources to the intestinal bacteria (28). Unlike the host-derived glycans which are constantly available, dietary glycans fluctuate in both composition and abundance. As an adaption, several strains in Bacteroidetes evolved to use host mucosal glycans when dietary glycans are in short supply (29, 30). This may partially explain the blooming of Bacteroidetes in the resting phase.
Circadian feeding behavior has been suggested to influence microbial rhythmicity–diurnal oscillation was restored by restricting the feeding of Per1/2 KO mice to the dark or light phase (19). Partial restoration of microbial oscillation could be accomplished by consolidating high-fat feeding to the dark phase (20). However, because circadian rhythms of host behavior and physiology can be entrained by daily cycles of restricted feeding (31), it is possible that feeding in the dark phase partially restored the circadian rhythm of the host. Hence, it remains to be determined whether the restoration of microbial oscillation is due to a direct influence of feeding, due to restoration of the host circadian clock, or due to the combination of the two.
In addition to regulating the circadian rhythmicity of microbiota, Bmal1 also influenced both the abundance and composition of the microbiota. Given the evidence that Bmal1 exerts an anti-inflammatory effect in mice (32), it is noteworthy that Bmal1 deletion shifted the microbiota configuration toward a phenotype that may be proinflammatory. For example, expansion of Rikenellaceae has been reported due to high-fat diet feeding (33) and during the pathological progression of inflammatory bowel disease (34). Clostridiaceae had been found to be increased in patients following ileal pouch-anal anastomosis (35), in patients with ulcerative colitis and Crohn’s disease (36), and in mice during the progression of lupus (37). Decrease of Allobaculum is associated with high-fat diet feeding in mice (38). Our findings do not presently identify the mechanism through which Bmal1 affects the configuration of the microbiota and it is also unknown whether deletion of the Period genes influenced taxonomic composition (19).
Sex regulates the fecal microbial composition in line with the host circadian clock. Although microbiota in both genders exhibited circadian rhythmicity, females showed more significant oscillation than males (Fig. 1). However, the effect of host sex is secondary to the host circadian clock in shaping the rhythmicity, because Bmal1 deletion abolished the rhythmicity irrespective of sex. This interpretation is further strengthened by the near-complete loss of diurnal oscillation of microbiota in Per1/2 deficient mice, irrespective of sex (19). Sex also conditions the impact of Bmal1 deletion on microbiota composition (Fig. 4 and Fig. S6), indicating an interaction between sex and genotype. Sex-dependent effects on the microbiome have been suggested in various animal models (39–41). In mice, male and female microbiota diverge after puberty, reflecting the sex bias in expression of autoimmune diseases, such as type 1 diabetes (40, 42). Although the mechanism remains unclear, a bidirectional interaction between microbiota and host hormone levels seems likely, because the divergence between male and female microbiota can be reversed by male castration (42). Moreover, differential effects of dietary manipulation are conditioned by sex in fish, mice and potentially humans (41).
Our findings specify pathways of host regulation of fecal microbiota composition and motivate exploration of the host circadian clock and microbial circadian rhythmicity. The present study and previous work (19, 20) highlight the need to consider sex, genotype, feeding pattern, and timing of sample collection in microbiome studies. Work presented here further highlights the importance of analyzing the absolute abundances of bacteria in addition to the proportions to understand the intestinal microbiome.
Materials and Methods
A detailed description of the methods is provided in SI Materials and Methods.
Animals.
All C57BL/6 mice and Bmal1 KO mice were raised in our animal facility. Mice 10–14 wk of age were used for all experiments. All animals were fed ad libitum with regular chow diet (5010, LabDiet) for the course of study. Mice were kept under 12-h light/12-h dark (LD) cycle, with lights on at 7:00 AM and off at 7:00 PM. Experimental protocols were reviewed and approved by the Institute for Animal Care and Use Committee at the University of Pennsylvania.
Study Design.
Study 1: Microbial oscillation in WT mice.
C57BL/6 mice were caged according to litter and sex. Seven male mice (housed in two cages with three in one cage and four in the other) and seven female mice (housed in two cages with three in one cage and four in the other) were studied. Fecal pellets from each mouse were sampled every 4 h for 48 h. A total of 182 samples were collected for microbiota composition analysis by pyrosequencing (SI Materials and Methods). Sequencing yielded 360,809 reads. After removing samples with less than 200 reads, 180 samples were available for analysis (SI Materials and Methods).
Study 2: Effect of Bmal1 deletion on microbial oscillation in mice.
Homozygous Bmal1 KO mice were established by mating heterozygous pairs. Bmal1 KO mice were housed separately from the littermate wild-type (WT) controls immediately after the genotype was confirmed to minimize the influence of coprophagia (43). Four female (housed in two cages with two in each) and two male (housed in two cages with one in each) Bmal1 KO mice as well as two female (housed in two cages with one in each) and three male (housed in two cages with two in one cage and one in the other) littermate control mice were studied. Fecal pellets from each mouse were sampled every 4 h for 48 h. A total of 143 samples were collected for microbiota composition analysis by pyrosequencing (SI Materials and Methods). Sequencing yielded 142,553 reads. After removing samples with less than 200 reads, 140 samples were available for analysis (SI Materials and Methods).
Statistical Analysis.
Statistical tests for rhythmicity were performed using JTK_CYCLE algorithm as described (21), reporting Bonferroni-adjusted P values. Statistical analyses for bacterial abundance were performed with Mann–Whitney test, and P values were corrected for multiple comparisons using the procedure of Benjamini and Hochberg to control for a false discovery rate (FDR) of less than 5%. All data were expressed as means ± SEM. The PERMANOVA (44) procedure was applied based on pairwise UniFrac distance to assess the sources of variation, and P values were obtained using permutation tests.
SI Materials and Methods
Sample Collection and DNA Extraction.
Two to three fresh fecal pellets from each individual mouse were collected every 4 h continuously for 48 h. Samples were weighed, placed in empty vials, and immediately stored at −80 °C for future use.
Bacterial DNA was isolated from fecal pellets using PSP Spin Stool DNA Plus Kit (Stratec) with slight modification. Briefly, the fecal samples were thawed on ice and transferred to Lysing Matrix E tubes (MP Biomedicals) with 1,400 μL of stool stabilizer from the PSP kit. They were then disrupted using the TissueLyser II (Qiagen) for 6 min at 30 Hz. Samples were then heated at 95 °C for 15 min, cooled on ice for 1 min, and spun down at 13,400 × g for 1 min. The supernatant was then transferred to the PSP InviAdsorb tubes and the rest of the protocol for the PSP Spin Stool DNA Plus was followed according to the manufacturer's instructions. To maximize the extraction efficiency, each sample underwent two rounds of elution. Extracted DNA was quantified using NanoDrop 1000 (Thermo Scientific) and stored at −20 °C for future use.
Every DNA extraction included a negative extraction control in which water was used instead of fecal pellets. All controls went through the same DNA extraction process as well as the subsequent amplification and sequencing.
16S rRNA Quantification.
Quantification of 16S rRNA gene copies was performed by real-time PCR using the Taqman method in triplicate reactions with 10 ng of DNA per reaction. Degenerate bacterial 16S rRNA-specific primers were used for amplification and their sequences were as follows: forward primer, 5′-AGAGTTTGATCCTGGCTCAG-3′; reverse primer, 5′-CTGCTGCCTYCCGTA-3′; probe: 5′-/56-FAM/TAA +CA+C ATG +CA+A GT+C GA/3BHQ_1/-3′, where “+” precedes the position of a LNA base.
Quantitative PCR was carried out on a 7900HT Real-Time PCR System (Applied Biosystems). Thermocycling was performed as follows: initiation at 95 °C for 5 min followed by 40 cycles of 94 °C × 30 s, 50 °C × 30 s, and 72 °C × 30 s. Signals were collected during the elongation step at 72 °C.
A standard curve prepared from a near full length clone of Escherichia coli 16S inserted into a Topo Vector was used for normalization for each run of real-time PCR.
V1-V2 16S rRNA Gene Region Amplification and Sequencing.
DNA (100 ng) was amplified with barcoded primers annealing to the V1-V2 region of the 16S rRNA gene using AccuPrime Taq DNA Polymerase System with Buffer 2 (Life Technologies). PCR reactions were performed on a thermocycler using the following conditions: initiation at 95 °C for 5 min followed by 20 cycles of 95 °C × 30 s, 56 °C × 30 s, and 72 °C × 1 min 30 s, then a final extension step at 72 °C for 8 min. The amplicons from each DNA sample, which was amplified in quadruplicate, were pooled and purified with Agencourt AMPure XP beads (Beckman Coulter) following the manufacturer’s instructions. Purified DNA samples were then sequenced using the 454/Roche GS FLX Titanium chemistry (454 Life Sciences).
16S rRNA Gene Sequence Analysis.
Sequence data were processed with QIIME v 1.8.0 (25) using default parameters. Samples with less than 200 counts were removed from further analysis. Sequences were clustered into operational taxonomic units (OTUs) at 97% similarity and then assigned taxonomy using the uclust consensus taxonomy classifier. Sequences were aligned using PyNAST (45) and a phylogenetic tree was constructed using FastTree (46). Weighted and unweighted UniFrac (23) distances were calculated for each pair of samples for assessment of community similarity and generation of principal coordinate analysis (PCoA) plots. The relative abundances of taxa were generated for each sample using QIIME, and the inferred absolute abundances of taxa were calculated by multiplying the 16S rRNA copy number and the taxonomic relative abundance within a given sample.
Acknowledgments
We gratefully acknowledge the support and advice of Kyle Bittinger, Alice Laughlin, Tom Price, and Gregory Grant. This work was supported by National Heart, Lung, and Blood Institute Grant 1U54HL117798. G.A.F. is the Robert L. McNeil, Jr. Professor in Translational Medicine and Therapeutics.
Footnotes
The authors declare no conflict of interest.
This article is a PNAS Direct Submission.
This article contains supporting information online at www.pnas.org/lookup/suppl/doi:10.1073/pnas.1501305112/-/DCSupplemental.
References
- 1.Benson AK, et al. Individuality in gut microbiota composition is a complex polygenic trait shaped by multiple environmental and host genetic factors. Proc Natl Acad Sci USA. 2010;107(44):18933–18938. doi: 10.1073/pnas.1007028107. [DOI] [PMC free article] [PubMed] [Google Scholar]
- 2.Biagi E, et al. Through ageing, and beyond: Gut microbiota and inflammatory status in seniors and centenarians. PLoS One. 2010;5(5):e10667. doi: 10.1371/journal.pone.0010667. [DOI] [PMC free article] [PubMed] [Google Scholar]
- 3.Jernberg C, Löfmark S, Edlund C, Jansson JK. Long-term impacts of antibiotic exposure on the human intestinal microbiota. Microbiology. 2010;156(Pt 11):3216–3223. doi: 10.1099/mic.0.040618-0. [DOI] [PubMed] [Google Scholar]
- 4.Annalisa N, et al. Gut microbioma population: An indicator really sensible to any change in age, diet, metabolic syndrome, and life-style. Mediators Inflamm. 2014;2014:901308. doi: 10.1155/2014/901308. [DOI] [PMC free article] [PubMed] [Google Scholar]
- 5.Wu GD, et al. Linking long-term dietary patterns with gut microbial enterotypes. Science. 2011;334(6052):105–108. doi: 10.1126/science.1208344. [DOI] [PMC free article] [PubMed] [Google Scholar]
- 6.Song SJ, et al. Cohabiting family members share microbiota with one another and with their dogs. eLife. 2013;2:e00458. doi: 10.7554/eLife.00458. [DOI] [PMC free article] [PubMed] [Google Scholar]
- 7.Zhao L. The gut microbiota and obesity: From correlation to causality. Nat Rev Microbiol. 2013;11(9):639–647. doi: 10.1038/nrmicro3089. [DOI] [PubMed] [Google Scholar]
- 8.Wu GD, Bushmanc FD, Lewis JD. Diet, the human gut microbiota, and IBD. Anaerobe. 2013;24:117–120. doi: 10.1016/j.anaerobe.2013.03.011. [DOI] [PubMed] [Google Scholar]
- 9.David LA, et al. Diet rapidly and reproducibly alters the human gut microbiome. Nature. 2014;505(7484):559–563. doi: 10.1038/nature12820. [DOI] [PMC free article] [PubMed] [Google Scholar]
- 10.De Filippo C, et al. Impact of diet in shaping gut microbiota revealed by a comparative study in children from Europe and rural Africa. Proc Natl Acad Sci USA. 2010;107(33):14691–14696. doi: 10.1073/pnas.1005963107. [DOI] [PMC free article] [PubMed] [Google Scholar]
- 11.Crawford PA, et al. Regulation of myocardial ketone body metabolism by the gut microbiota during nutrient deprivation. Proc Natl Acad Sci USA. 2009;106(27):11276–11281. doi: 10.1073/pnas.0902366106. [DOI] [PMC free article] [PubMed] [Google Scholar]
- 12.Costello EK, Gordon JI, Secor SM, Knight R. Postprandial remodeling of the gut microbiota in Burmese pythons. ISME J. 2010;4(11):1375–1385. doi: 10.1038/ismej.2010.71. [DOI] [PMC free article] [PubMed] [Google Scholar]
- 13.Saini C, Suter DM, Liani A, Gos P, Schibler U. The mammalian circadian timing system: Synchronization of peripheral clocks. Cold Spring Harb Symp Quant Biol. 2011;76:39–47. doi: 10.1101/sqb.2011.76.010918. [DOI] [PubMed] [Google Scholar]
- 14.Green CB, Takahashi JS, Bass J. The meter of metabolism. Cell. 2008;134(5):728–742. doi: 10.1016/j.cell.2008.08.022. [DOI] [PMC free article] [PubMed] [Google Scholar]
- 15.Yang G, et al. Knitting up the raveled sleave of care. Sci Transl Med. 2013;5(212):212rv3. doi: 10.1126/scitranslmed.3007225. [DOI] [PubMed] [Google Scholar]
- 16.Hut RA, Beersma DG. Evolution of time-keeping mechanisms: Early emergence and adaptation to photoperiod. Philos Trans R Soc Lond B Biol Sci. 2011;366(1574):2141–2154. doi: 10.1098/rstb.2010.0409. [DOI] [PMC free article] [PubMed] [Google Scholar]
- 17.Johnson CH. Precise circadian clocks in prokaryotic cyanobacteria. Curr Issues Mol Biol. 2004;6(2):103–110. [PubMed] [Google Scholar]
- 18.Iwasaki H, Taniguchi Y, Ishiura M, Kondo T. Physical interactions among circadian clock proteins KaiA, KaiB and KaiC in cyanobacteria. EMBO J. 1999;18(5):1137–1145. doi: 10.1093/emboj/18.5.1137. [DOI] [PMC free article] [PubMed] [Google Scholar]
- 19.Thaiss CA, et al. Transkingdom control of microbiota diurnal oscillations promotes metabolic homeostasis. Cell. 2014;159(3):514–529. doi: 10.1016/j.cell.2014.09.048. [DOI] [PubMed] [Google Scholar]
- 20.Zarrinpar A, Chaix A, Yooseph S, Panda S. Diet and feeding pattern affect the diurnal dynamics of the gut microbiome. Cell Metab. 2014;20(6):1006–1017. doi: 10.1016/j.cmet.2014.11.008. [DOI] [PMC free article] [PubMed] [Google Scholar]
- 21.Hughes ME, Hogenesch JB, Kornacker K. JTK_CYCLE: An efficient nonparametric algorithm for detecting rhythmic components in genome-scale data sets. J Biol Rhythms. 2010;25(5):372–380. doi: 10.1177/0748730410379711. [DOI] [PMC free article] [PubMed] [Google Scholar]
- 22.Ko CH, Takahashi JS. Molecular components of the mammalian circadian clock. Hum Mol Genet. 2006;15(Spec No 2):R271–R277. doi: 10.1093/hmg/ddl207. [DOI] [PubMed] [Google Scholar]
- 23.Lozupone C, Knight R. UniFrac: A new phylogenetic method for comparing microbial communities. Appl Environ Microbiol. 2005;71(12):8228–8235. doi: 10.1128/AEM.71.12.8228-8235.2005. [DOI] [PMC free article] [PubMed] [Google Scholar]
- 24.Vazquez-Baeza Y, Pirrung M, Gonzalez A, Knight R. EMPeror: A tool for visualizing high-throughput microbial community data. Gigascience. 2013;2(1):16-217X-2-16. doi: 10.1186/2047-217X-2-16. [DOI] [PMC free article] [PubMed] [Google Scholar]
- 25.Caporaso JG, et al. QIIME allows analysis of high-throughput community sequencing data. Nat Methods. 2010;7(5):335–336. doi: 10.1038/nmeth.f.303. [DOI] [PMC free article] [PubMed] [Google Scholar]
- 26.Yu EA, Weaver DR. Disrupting the circadian clock: Gene-specific effects on aging, cancer, and other phenotypes. Aging (Albany, NY) 2011;3(5):479–493. doi: 10.18632/aging.100323. [DOI] [PMC free article] [PubMed] [Google Scholar]
- 27.Paschos GK, et al. Obesity in mice with adipocyte-specific deletion of clock component Arntl. Nat Med. 2012;18(12):1768–1777. doi: 10.1038/nm.2979. [DOI] [PMC free article] [PubMed] [Google Scholar]
- 28.Koropatkin NM, Cameron EA, Martens EC. How glycan metabolism shapes the human gut microbiota. Nat Rev Microbiol. 2012;10(5):323–335. doi: 10.1038/nrmicro2746. [DOI] [PMC free article] [PubMed] [Google Scholar]
- 29.Martens EC, Chiang HC, Gordon JI. Mucosal glycan foraging enhances fitness and transmission of a saccharolytic human gut bacterial symbiont. Cell Host Microbe. 2008;4(5):447–457. doi: 10.1016/j.chom.2008.09.007. [DOI] [PMC free article] [PubMed] [Google Scholar]
- 30.Sonnenburg JL, et al. Glycan foraging in vivo by an intestine-adapted bacterial symbiont. Science. 2005;307(5717):1955–1959. doi: 10.1126/science.1109051. [DOI] [PubMed] [Google Scholar]
- 31.Stephan FK. Phase shifts of circadian rhythms in activity entrained to food access. Physiol Behav. 1984;32(4):663–671. doi: 10.1016/0031-9384(84)90323-8. [DOI] [PubMed] [Google Scholar]
- 32.Curtis AM, et al. Circadian control of innate immunity in macrophages by miR-155 targeting Bmal1. Proc Natl Acad Sci USA. 2015;112(23):7231–7236. doi: 10.1073/pnas.1501327112. [DOI] [PMC free article] [PubMed] [Google Scholar]
- 33.Kim KA, Gu W, Lee IA, Joh EH, Kim DH. High fat diet-induced gut microbiota exacerbates inflammation and obesity in mice via the TLR4 signaling pathway. PLoS One. 2012;7(10):e47713. doi: 10.1371/journal.pone.0047713. [DOI] [PMC free article] [PubMed] [Google Scholar]
- 34.Alkadhi S, Kunde D, Cheluvappa R, Randall-Demllo S, Eri R. 2014. The murine appendiceal microbiome is altered in spontaneous colitis and its pathological progression. Gut Pathog 6:25-4749-6-25. eCollection 2014. [DOI] [PMC free article] [PubMed]
- 35.Tannock GW, et al. Comprehensive analysis of the bacterial content of stool from patients with chronic pouchitis, normal pouches, or familial adenomatous polyposis pouches. Inflamm Bowel Dis. 2012;18(5):925–934. doi: 10.1002/ibd.21936. [DOI] [PubMed] [Google Scholar]
- 36.Zhang T, et al. [Changes of fecal flora and its correlation with inflammatory indicators in patients with inflammatory bowel disease] Nan Fang Yi Ke Da Xue Xue Bao. 2013;33(10):1474–1477. [PubMed] [Google Scholar]
- 37.Zhang H, Liao X, Sparks JB, Luo XM. Dynamics of gut microbiota in autoimmune lupus. Appl Environ Microbiol. 2014;80(24):7551–7560. doi: 10.1128/AEM.02676-14. [DOI] [PMC free article] [PubMed] [Google Scholar]
- 38.Qiao Y, Sun J, Xie Z, Shi Y, Le G. Propensity to high-fat diet-induced obesity in mice is associated with the indigenous opportunistic bacteria on the interior of Peyer’s patches. J Clin Biochem Nutr. 2014;55(2):120–128. doi: 10.3164/jcbn.14-38. [DOI] [PMC free article] [PubMed] [Google Scholar]
- 39.McKenna P, et al. The macaque gut microbiome in health, lentiviral infection, and chronic enterocolitis. PLoS Pathog. 2008;4(2):e20. doi: 10.1371/journal.ppat.0040020. [DOI] [PMC free article] [PubMed] [Google Scholar]
- 40.Yurkovetskiy L, et al. Gender bias in autoimmunity is influenced by microbiota. Immunity. 2013;39(2):400–412. doi: 10.1016/j.immuni.2013.08.013. [DOI] [PMC free article] [PubMed] [Google Scholar]
- 41.Bolnick DI, et al. Individual diet has sex-dependent effects on vertebrate gut microbiota. Nat Commun. 2014;5:4500. doi: 10.1038/ncomms5500. [DOI] [PMC free article] [PubMed] [Google Scholar]
- 42.Markle JG, et al. Sex differences in the gut microbiome drive hormone-dependent regulation of autoimmunity. Science. 2013;339(6123):1084–1088. doi: 10.1126/science.1233521. [DOI] [PubMed] [Google Scholar]
- 43.Deloris Alexander A, et al. Quantitative PCR assays for mouse enteric flora reveal strain-dependent differences in composition that are influenced by the microenvironment. Mamm Genome. 2006;17(11):1093–1104. doi: 10.1007/s00335-006-0063-1. [DOI] [PubMed] [Google Scholar]
- 44.McArdle BH, Anderson MJ. Fitting multivariate models to community data: A comment on distance-based redundancy analysis. Ecology. 2001;82(1):290–297. [Google Scholar]
- 45.Caporaso JG, et al. PyNAST: A flexible tool for aligning sequences to a template alignment. Bioinformatics. 2010;26(2):266–267. doi: 10.1093/bioinformatics/btp636. [DOI] [PMC free article] [PubMed] [Google Scholar]
- 46.Price MN, Dehal PS, Arkin AP. FastTree: Computing large minimum evolution trees with profiles instead of a distance matrix. Mol Biol Evol. 2009;26(7):1641–1650. doi: 10.1093/molbev/msp077. [DOI] [PMC free article] [PubMed] [Google Scholar]


