

Significance
Neuronal sequences in the CA1 hippocampal region during short burst events (called sharp wave ripples) reliably reflect the slower sequential order of place activation during exploration, patterned by local-circuit interneurons. We tested the hypothesis that in addition to afferent drive, local mechanisms contribute critically to the sequential patterning of pyramidal cells and the diverse interneuron types. We show that optogenetic activation of a small group of CA1 pyramidal cells in mouse hippocampus yields consistent multineuronal spike sequences, and that their sequential firing order is similar to that observed during spontaneous “ripple” and theta oscillations. Thus, multineuronal spike sequences are not exclusively inherited from upstream sources but result from local-circuit dynamics and biophysical properties of the individual neurons.
Keywords: hippocampus, mouse, optogenetics, ripples, temporal precision
Abstract
Sequential activity of multineuronal spiking can be observed during theta and high-frequency ripple oscillations in the hippocampal CA1 region and is linked to experience, but the mechanisms underlying such sequences are unknown. We compared multineuronal spiking during theta oscillations, spontaneous ripples, and focal optically induced high-frequency oscillations (“synthetic” ripples) in freely moving mice. Firing rates and rate modulations of individual neurons, and multineuronal sequences of pyramidal cell and interneuron spiking, were correlated during theta oscillations, spontaneous ripples, and synthetic ripples. Interneuron spiking was crucial for sequence consistency. These results suggest that participation of single neurons and their sequential order in population events are not strictly determined by extrinsic inputs but also influenced by local-circuit properties, including synapses between local neurons and single-neuron biophysics.
A hypothesized hallmark of cognition is self-organized sequential activation of neuronal assemblies (1). Self-organized neuronal sequences have been observed in several cortical structures (2–5) and neuronal models (6–7). In the hippocampus, sequential activity of place cells (8) may be induced by external landmarks perceived by the animal during spatial navigation (9) and conveyed to CA1 by the upstream CA3 region or layer 3 of the entorhinal cortex (10). Internally generated sequences have been also described in CA1 during theta oscillations in memory tasks (4, 11), raising the possibility that a given neuronal substrate is responsible for generating sequences at multiple time scales. The extensive recurrent excitatory collateral system of the CA3 region has been postulated to be critical in this process (4, 7, 12, 13).
The sequential activity of place cells is “replayed” during sharp waves (SPW) in a temporally compressed form compared with rate modulation of place cells (14–20) and may arise from the CA3 recurrent excitatory networks during immobility and slow wave sleep. The SPW-related convergent depolarization of CA1 neurons gives rise to a local, fast oscillatory event in the CA1 region (“ripple,” 140–180 Hz; refs. 8 and 21). Selective elimination of ripples during or after learning impairs memory performance (22–24), suggesting that SPW ripple-related replay assists memory consolidation (12, 13). Although the local origin of the ripple oscillations is well demonstrated (25, 26), it has been tacitly assumed that the ripple-associated, sequentially ordered firing of CA1 neurons is synaptically driven by the upstream CA3 cell assemblies (12, 15), largely because excitatory recurrent collaterals in the CA1 region are sparse (27). However, sequential activity may also emerge by local mechanisms, patterned by the different biophysical properties of CA1 pyramidal cells and their interactions with local interneurons, which discharge at different times during a ripple (28–30). A putative function of the rich variety of interneurons is temporal organization of principal cell spiking (29–32). We tested the “local-circuit” hypothesis by comparing the probability of participation and sequential firing of CA1 neurons during theta oscillations, natural spontaneous ripple events, and “synthetic” ripples induced by local optogenetic activation of pyramidal neurons.
Results
Spike Rates and Multineuronal Spike Sequences During Theta Waves and Ripple Events Are Correlated.
The firing rates of CA1 pyramidal cells (PYR) and putative interneurons (INT) during theta oscillations and ripple events were correlated (rank correlations: PYR: 0.59, P < 0.001, permutation test; INT: 0.89, P < 0.001; n = 268 PYR and 37 INT recorded from four freely moving mice; Fig. 1A). To compare the rate modulation during theta and ripples on a neuron-by-neuron basis, we computed a “gain” measure for each unit, defined as the mean spiking rate during an event (ripple or theta cycle), divided by the baseline spiking rate. Although spike gain was higher during ripples than during theta (median ratio: PYR: 2.8, P < 0.001, Wilcoxon’s signed-rank paired test; INT: 2.2, P < 0.001), the spike gain of PYR during theta and ripples was correlated (rank correlations: PYR: 0.21, P < 0.001; INT: 0.27, P = 0.06; Fig. 1B). Thus, spike rates and their modulation are correlated during ripple and theta brain states.
Fig. 1.

Spike rates and multineuronal spike sequences are correlated during ripple and theta oscillations. (A) Spike rates during ripples and theta are correlated. Each dot indicates the spike rate of one unit (n = 268 pyramidal cells, PYR, and 37 interneurons, INT, from 11 sessions in four freely moving mice), averaged over ≥100 (median, 1,274) ripple events and ≥1,000 (median, 18,250) theta cycles. Numbers: rank correlation coefficients; ***P < 0.005, permutation test. (B) Spike gain (defined as the mean spike rate of a given unit during ripples, divided by the baseline rate; baseline periods include nonripple and nontheta immobility epochs) is correlated during ripples and theta-associated behaviors. (C) Spike sequences during ripples and theta are correlated. For presentation purposes, the rank of each simultaneously recorded unit (12 INT, 43 PYR) during an example session was averaged separately during ripple events (left) and theta cycles (center), and sorted according to the ripple rank; error lines, SEM. Numbers indicate rank correlations based on INT only (blue), PYR only (red), or all cells (black); ***P < 0.005, permutation test. (D) Sequence consistency during ripples, theta, and theta vs. ripples (11 sessions in four mice). Dots, individual sessions; bars, group means (SEM); black dots, sessions with significant (P < 0.05, permutation test) rank correlation (“consistent” sequences); magenta dots, session illustrated in C. ***P < 0.005, Wilcoxon’s signed rank test (zero median null). For details and rationale of this analysis, see Fig. 4. (E) Fraction of sessions with consistent sequences. Dashed line shows chance level; error bars, SEM; ***P < 0.005, exact Binomial test. (F) Sequence consistency is maintained when only INT are considered. */**/***, signed-rank test. (G) When only PYR are considered, sequence self-consistency during ripples and theta is maintained. NS: not significant, signed-rank test, zero-median null.
During ripples, the spiking of multiple simultaneously recorded neurons (median, 24; range, 9–60) occurred in recurring sequences (median self-consistency: 0.28, P < 0.001, Wilcoxon’s signed-rank test, zero-median null, n = 11 sessions from four mice; Fig. 1 C–E) during most sessions (10 of 11 sessions, 91%, with self-consistent sequences, P < 0.05, permutation test). The same neurons exhibited sequential spiking also during individual theta cycles (median self-consistency: 0.24, P < 0.001) during all sessions (11 of 11, 100%; Fig. 1 C–E). To compare the relationship between sequential ordering of neurons during individual ripple events and theta cycles (“cross-class consistency”), we used the spike sequences during ripple events as a template against which spiking during each theta cycle was compared. In 10 of 11 cases (91%, chance level, 5%, P < 0.001, exact Binomial test), the sequences during ripples and theta were similar (median cross-class consistency: 0.21, P < 0.001; Fig. 1 C–E). Similar results were observed when only INT (median, 4; range, 2–12) were used in comparing sequences (median cross-class consistency: 0.18, P = 0.03; 8 of 9 sessions, P < 0.001; Fig. 1F). However, when only PYR (median, 22; range, 6–51) were considered, the median cross-class consistency fell to chance level (P = 0.83; Fig. 1G). On a session-by-session basis, 6 of 11 (55%; P < 0.001) sessions exhibited significant rank correlations, although half were consistent (3 of 11, 27%, P = 0.02; median cross-class consistency: 0.05) and half were reversed (3 of 11, 27%, P = 0.02; median, -0.04; Fig. 1G).
These correlations suggest that the same neuronal substrates are responsible for generating sequential firing of neurons during both theta and ripple states. Because layer 3 of the entorhinal input to CA1 is not active during ripples (33), it is unlikely that the entorhinal input is responsible for generating correlated sequences across different states. Sequences may be generated by the upstream CA3 region or locally in CA1 but these results alone cannot disambiguate the contributions of the two regions.
Single Neuron Spiking Modulations Are Correlated During Spontaneous and Induced Ripples.
Upon recording from the CA1 pyramidal cell layer of freely moving mice, high frequency “ripple” oscillations (21) were readily observed (Fig. 2Ab). During spontaneous ripple events, individual neurons increased their firing rate several-fold (28): pyramidal cells (PYR) about 5.1-fold (mean over n = 268 PYR; SEM: 0.5), and interneurons 4.1-fold (SEM: 0.6; n = 37 INT recorded from four freely moving CaMKII::ChR2 mice; Fig. 2B, Inset). Units with higher baseline (nonripple) firing rates also had higher firing rates during spontaneous ripples (rank correlation coefficient: PYR: 0.55, P < 0.001, permutation test; INT: 0.86, P < 0.001; Fig. 2B). In these same animals and brain state (Fig. S1), we also induced synthetic high-frequency oscillations (26) using focal application of blue light (estimated light intensity at the center of the CA1 pyramidal cell layer, 0.01–1 mW/mm2; Fig. 2Ac). Illumination in the opsin-free (control) mouse failed to induce oscillations or spikes (Fig. S2). During synthetic ripples induced at threshold intensity (the lowest intensity that generated ripples with comparable power to spontaneous ripples; ref. 26), firing rates of individual units also increased: PYR spiking increased 4.7-fold (SEM: 0.6), and INT spiking increased 1.8-fold (SEM: 0.4; Fig. 2C). The marked increase of PYR relative to INT spiking (P = 0.01, Mann–Whitney U test) is consistent with direct activation of PYR (and indirect activation of INT) in these animals during induced ripples. For both PYR and INT, the firing rates during induced ripples were correlated with the firing rates during spontaneous ripples on a neuron-by-neuron basis (rank correlations: PYR: 0.45, INT: 0.91, P < 0.001 for both; Fig. 2D). Spike gain was correlated during induced and spontaneous ripples (rank correlations: PYR: 0.24, INT: 0.74, P < 0.001 for both; Fig. 2E). Thus, firing rates and their modulations during induced ripples are not an arbitrary outcome of opsin- or optics-dependent parameters (expression level, distance from light source). Furthermore, the tendency of a given unit to modify its spike rate during CA3-driven (SPW induced) ripples is correlated with its tendency to modify spiking during locally driven (i.e., light-induced) ripples.
Fig. 2.
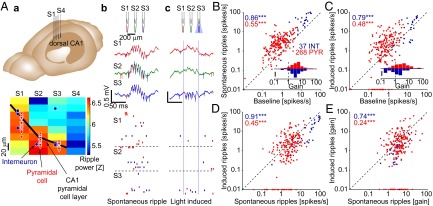
Spike rates and their modulations are correlated during spontaneous and induced ripples. (A) Experimental configuration. (a) A four-shank diode-probe mounted on a movable microdrive is implanted in the dorsal hippocampus of a freely moving CaMKII::ChR2 mouse and lowered gradually until multiple-unit spiking and CA1 ripples are recorded. (b) Wide-band traces (1-5000 Hz) from three shanks during a spontaneous ripple. Blue ticks, INT spikes; red ticks, PYR spikes. c. Traces from the same sites during a “synthetic ripple” induced by focal illumination (light power: 3–4 μW; estimated intensity in center of the layer: ∼0.1 mW/mm2). (B) Spike rates during spontaneous ripples are correlated with baseline rate; baseline periods include nonripple nontheta immobility. Each dot indicates the spike rate of a single unit (n = 268 PYR and 37 INT from 11 sessions in four freely moving CaMKII::ChR2 mice), averaged over ≥100 (median, 521) spontaneous ripple events. Inset shows the distributions of spike gain; 10 equal-sized bins; scale bar, 20%. (C) Spike rates during induced ripples are correlated with baseline rate. Same units as in B, averaged over ≥10 (median, 53) induced ripple events. (D) Spike rates are correlated during spontaneous and induced ripples. (E) Spike gain is correlated during spontaneous and induced ripples. Numbers: rank correlation coefficients; ***P < 0.005, permutation test.
Fig. S1.
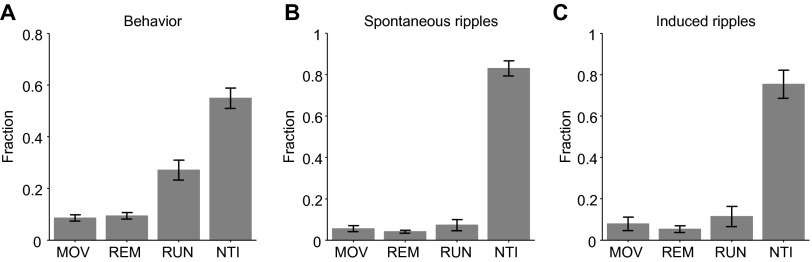
Distribution of time spent in each brain state. Four brain states were defined: RUN (theta mobility), REM (theta immobility), NTI (nontheta immobility), and MOV (nontheta mobility, e.g., grooming). (A) Distribution of time spent in each behavioral state (averaged over 11 sessions in four freely moving CaMKII::ChR2 mice; error bars, SEM). (B) Probability for an observed spontaneous ripple to occur in each of the four states. (C) Probability for a synthetically generated ripple to have been triggered in each state. Although only about half of the time was spent in NTI (55% ± 4%), both spontaneous and induced ripples occurred predominantly during that state (83% ± 4% and 75% ± 7%, respectively; P = 0.33, t test).
Fig. S2.

Diode-probe illumination in the opsin-free mouse does not induce spiking or generate ripples. (A) Snapshot of wide-band traces (500 ms) from CA1 of a urethane-anesthetized wild-type mouse. Note spontaneous spiking (38 PYR and 9 INT) and ripples on all four shanks (S1, shank 1; S2, shank 2, and so on). (B) Snapshot of recording during sequential illumination (vertical blue bars) of the four diode-probe shanks (estimated light intensity at the center of the CA1 pyramidal layer, 0.6 mW/mm2). No artifacts, induced spikes, or induced ripples can be seen. (C) Peri-stimulus time histograms (PSTHs) during diode-probe illumination. Each panel shows the PSTHs for all same-shank INT (blue) or PYR (red) during illumination of the same shank; each row shows the PSTH for one unit (white/black indicate minimal/maximal firing rates), and the plot above shows the PSTH averaged over all units. Calibration is 1 spike/s for all plots. In contrast to the effect in opsin-expressing mice (compare to Fig. 2 in the main text; also see refs. 26, 48, and 49), note lack of consistent modulation (activation or suppression) during focal illumination, indicating that diode-probe illumination by itself does not induce thermal, optical, or electromagnetic modulation of neural activity.
Correlated rate modulations are not sufficient to generate precise spike sequences. To determine the time relations between single neuron spiking and ripple cycles, we defined a phase for each spike that occurred during a ripple. Most units (224 of 268 PYR, 84%; 34 of 37 INT, 95%) exhibited consistent locking to ripple phase (P < 0.05, Rayleigh test), and phase-locked PYR spiked consistently earlier than phase-locked INT (mean± SEM phases: PYR: 156 ± 1.7°, INT: 254 ± 6.7°; corresponding to time lag of 1.8 ± 0.2 ms; Fig. 3A; Fig. 3C, x axis). Similar results were observed during induced ripples (mean ± SEM phases: PYR: 138 ± 4.4°, INT: 288 ± 9.8°; Fig. 3B; Fig. 3C, y axis). On a neuron-by-neuron basis, the spike phases during spontaneous and induced ripples were correlated (circular–circular correlation coefficient: PYR: 0.7, P < 0.001, χ2 test; INT: 0.42, P = 0.04; n = 97 PYR and 26 INT phase-locked during both spontaneous and induced ripples; Fig. 3). Therefore, the precise temporal relations between single unit spiking and ripple cycles are preserved during spontaneous and induced ripples.
Fig. 3.

Preferred spike phases are correlated during spontaneous and induced ripple cycles. (A) Example pair of CA1 units recorded by same shank (S3 in Fig. 2A) during 302 spontaneous ripple events. Raster shows spike times, aligned to ripple cycle peaks (dashed lines, zero phase); each dot indicates the time of one spike (red, PYR; blue, INT). Polar plots show the circular distribution of the same spikes (right direction, zero phase). PYR spikes precede INT spikes on each cycle. (B) Spike times of the same pair of units during 70 induced ripple events. Note similar phase preference to the spontaneous case. (C) Each dot indicates the mean (“preferred”) cycle phase for spikes of one cell (red, PYR; blue, INT) during spontaneous and induced ripples. Dark large dots, units with phase locking (P < 0.05, Rayleigh test) during both spontaneous and induced ripples; crosshairs indicate group means (SEM). Histograms show marginal frequency distributions of the mean spike phases for all units (10 equal-sized bins; scale bar, 20%). n = 268 PYR and 37 INT from 11 sessions in four freely moving CaMKII::ChR2 mice. Numbers: circular-circular correlation coefficients; *P < 0.05; ***P < 0.005, χ2 test.
Multineuronal Spike Sequences Are Correlated During Spontaneous Oscillations and Induced Ripples.
Because both spike rates and within-ripple cycle phase preference of spiking were correlated between spontaneous and induced ripples, we next examined whether sequential order of neuronal firing within ripple events is consistent. To this end, we rank ordered the spikes of all pyramidal cells and interneurons that occurred in a given event (Fig. 4A), and determined the consistency of multineuronal spiking across events (Fig. 4B); because induced ripples were focal (one site was illuminated at a time; Fig. 2Ac), this analysis was done on a site-by-site basis. During spontaneous ripples, most multineuronal sequences were self-consistent (23 of 27 recording sites, 85%; P < 0.001, exact Binomial test), with a median rank correlation of 0.28 (P < 0.001, Wilcoxon’s signed-rank test with a zero-median null; Fig. 4C). During induced ripples, 46% (12 of 26, P < 0.001) of the sequences were self-consistent, with a median rank correlation of 0.21 (P < 0.001; 0.32 for the consistent sequences; Fig. 4D). Similar results were observed under anesthesia (separate cohort of n = 5 urethane-anesthetized mice; Fig. S3). Thus, multineuronal spike sequences during induced ripples are not random.
Fig. 4.

Spike sequences are correlated during spontaneous and induced ripples. (A) Example ripples and associated local spiking. Traces are the same as in Fig. 2A, blue traces, filtered 80–250 Hz. Units (red hues, PYR; blue hues, INT) were sorted according to the time of first spike occurrence during the spontaneous ripple. Dashed lines indicate ripple (or light) onset and offset; note similar rank order during the induced event. (B) Permutation test for sequence consistency. (Upper) Distribution of the observed rank correlations for multineuronal spike sequences during 302 spontaneous ripple events (black; same site as in A) and the correlations for randomly permuted (“shuffled”) unit labels (gray; single shuffle; scale bars, 5%). (Lower) Distribution of 1000 shuffled means. The observed mean rank correlation (dashed line), 0.16, is larger than all shuffled means (P < 0.001). (C) Spike sequence consistency during spontaneous ripples (n = 27 sites in 11 sessions; four freely moving CaMKII::ChR2 mice; template method). Black, sites with significant (P < 0.05, permutation test) rank correlation (“consistent” sequences); gray, not significantly consistent. (D) Sequence consistency during spontaneous ripples (S; same data as in C), induced ripples (I), and induced vs. spontaneous ripples. Data are from the same animals as in C. Dots, individual sites; bars, group means (SEM); black dots, sites with consistent sequences; magenta dot, example dataset used in B. ***P < 0.005, Wilcoxon’s signed rank test (zero median null). (E) Fraction of recording sites with consistent sequences. Dashed line shows chance level. Error bars, SEM; ***P < 0.005, exact Binomial test.
Fig. S3.

Spike rates, modulations, and sequences are consistent during anesthesia. (A) Comparison of spike rates during spontaneous and induced ripples during anesthesia. Data includes n = 190 PYR and 40 INT from n = 29 sites in 5 urethane-anesthetized CaMKII::ChR2 mice. Numbers, rank correlations; **P < 0.01; ***P < 0.005, permutation test. (B) Spike gain during spontaneous and induced ripples. (C) Multineuronal sequence consistency. NS: not significant; ***P < 0.005, permutation test. Spontaneous and induced (cross-class) sequences are not consistent. (D) Fraction of sites with consistent sequences. ***P < 0.005, exact Binomial test.
Sequences during spontaneous and induced ripples were not independent: 13 of 26 induced sequences (50%, P < 0.001) were consistent with their same-site spontaneous counterparts, with a median rank correlation of 0.13 (P < 0.001; 0.21 for the consistent sequences; Fig. 4D). The median rank correlation was not different for the three datasets (spontaneous-ripple self-consistency; induced-ripple self-consistency; and cross-class consistency of induced-ripple, relative to spontaneous ripple sequences; P = 0.35, Kruskal–Wallis test). Similar results were observed in all freely moving animals (Table S1). Although the probability to observe consistent sequences was highest during spontaneous ripples (compared with induced-ripples and cross-class sequences, P = 0.003 and P = 0.006, χ2 test; Fig. 4E), consistent sequences occurred at similar probabilities during induced ripples and across classes (P = 0.78, Fig. 4E). Sequences during individual theta cycles and induced ripples were also interdependent: 10 of 25 (40%, P < 0.001) sites exhibited theta vs. induced ripples cross-class consistency, with a median rank correlation of 0.17 (P < 0.001; 0.32 for the consistent sequences; Fig. S4). Thus, sequences observed during spontaneous theta or ripple oscillations and induced ripples are similar, indicating that despite being driven by very different inputs (medial septum-associated theta, CA3-associated SPW, and local optically induced ChR2 activation), spiking during these three constellations share some common generative mechanisms.
Table S1.
Distribution of sequence consistency results between animals
| Preparation | Mouse number | Number of sites | Consistent sequences during spontaneous ripples | Consistent sequences during induced ripples | Cross-class consistency |
| FM | 331 | 9 | 7 | 7 | 7 |
| 428 | 4 | 4 | 2 | 1 | |
| 482 | 9 | 9 | 2 | 4 | |
| 552 | 5 | 3 | 3 | 3 | |
| Total | 27 | 23 | 14 | 15 | |
| UA | 622 | 6 | 6 | 5 | 2 |
| 624 | 6 | 6 | 6 | 2 | |
| 629 | 6 | 6 | 5 | 1 | |
| 763 | 5 | 2 | 3 | 1 | |
| 765 | 6 | 6 | 4 | 0 | |
| Total | 29 | 26 | 23 | 6 |
FM, freely moving; UA, urethane-anesthetized; consistent, P < 0.05, permutation test. All results pertain to template method, PYR+INT participation.
Fig. S4.

Multineuronal spike sequences during theta and induced ripples are correlated. (A) Sequence consistency during theta, induced ripples, and induced ripples vs. theta (27 sites in 11 sessions in four freely moving CaMKII::ChR2 mice). Dots, individual sessions; bars, group means (SEM); black dots, sites with significant (P < 0.05, permutation test) rank correlation (“consistent” sequences; see Fig. 4). ***P < 0.005, Wilcoxon’s signed rank test (zero median null). (B) Fraction of sessions with consistent sequences. Dashed line shows chance level; error bars, SEM; ***P < 0.005, exact Binomial test.
In constructing the multineuronal spike sequences, we considered spikes of all simultaneously recorded neurons, regardless of cell type. When limiting the participation to PYR, only 4 of 27 sites exhibited consistent sequences during spontaneous ripples (15%, P = 0.04, exact Binomial test) and the median rank correlation was lower (0.04, P = 0.02, signed-rank test). Similarly, only 7 of 22 (32%, P < 0.001; median rank, 0.13, P = 0.23) sequences were consistent during induced ripples, and cross-class consistency fell to chance level (3 of 22 sites, 13%; P = 0.09; median rank, 0.06, P = 0.25; Fig. 5A). Moreover, cross-class rank correlations were 3.4 times lower than when both PYR and INT were considered (P = 0.04, Wilcoxon’s paired signed-rank test; Fig. 5A, Right). When limiting participation to INT, sequences were still consistent (Fig. 5B), and cross-class consistency was 1.75 times lower than when all neurons were considered (P = 0.55, paired signed-rank test; rank correlation: 0.54, P < 0.001), suggesting that rate difference between PYR and INT and/or intrinsic PYR-INT correlations are not accountable for the observed consistency. Thus, although interneurons comprised only a small subpopulation of the participating units (12%) and were indirectly activated during optical ripple induction, they made an important contribution to the consistency of multineuronal sequences during both spontaneous and induced ripples.
Fig. 5.

Spike sequences are more consistent when interneuron spiking is considered. (A) Spike sequence consistency when only pyramidal cells (PYR) are considered. (Left) Individual site means; S: spontaneous; I: induced; NS: not significant; *P < 0.05; **P < 0.01; ***P < 0.005, Wilcoxon’s signed rank test (zero median null). (Center) Fraction of sites with consistent sequences; */***, exact Binomial test. (Right) cross-class sequence consistency, based on PYR only (y axis) vs. PYR+INT (x axis); dots, individual site mean (SEM) rank correlations. c, rank correlation, **P < 0.01; ***P < 0.005, permutation test; r, median ratio, *P < 0.05; ***P < 0.005, Wilcoxon’s paired signed-rank test (both are between values on ordinate and values on abscissa). Data are from n = 27 sites in 11 sessions from four freely moving CaMKII::ChR2 mice. Most events are not consistent. (B) Similar analysis, considering only interneurons (INT). Most events are consistent. Including both PYR and INT almost doubles the cross-class sequence consistency. (C) Data of Fig. 4 (both PYR and INT considered) analyzed using a “pair-wise” method (Methods). In most cases, sequences are consistent. (Right) Cross-class consistency yielded by the pair-wise method (y axis) and by the template method (x axis) is correlated.
We have used a cross-validated template method for determining the consistency of multineuronal sequences. Upon using an alternative “pair-wise” method, the exact values of the rank correlations were lower than those yielded by the template method (P = 0.002, signed-rank paired test; Fig. 5C). However, the numbers of consistent sequences (spontaneous ripples: 26 of 27, 96%; induced ripples: 14 of 25, 56%; cross-class consistency: 18 of 26, 69%) were similar to those detected using the template method (P > 0.05 for all three comparisons, χ2 test), and on a site-by-site basis, the values yielded by the two methods were correlated (0.58, P = 0.006, permutation test). Thus, although rank correlations were widely distributed and rarely exceeded values of 0.5 (during theta, ripples, and induced ripples) indicating relatively loose self- and cross-class consistency of multineuronal sequences, the observations are robust to the choice of analysis method.
Discussion
We found sequential activation of CA1 neuronal populations during theta oscillations, spontaneous ripples, and optogenetically induced ripple oscillations. Both firing rates and sequences were correlated across theta and spontaneous ripples. The participating neurons overlapped during theta, spontaneous and synthetic ripples, with high rate correlations across these states. Moreover, sequential ordering of neurons was also correlated across native and optogenetically induced events. These results indicate that mechanisms confined to the CA1 region contribute to both ripple- and theta-associated neuronal sequences. We suggest that sequential spiking patterns observed in the CA1 region in the intact animal arise from the interplay between extrinsic inputs (from CA3 and the entorhinal cortex), local synaptic interactions, and intrinsic cellular conductances.
The sequential ordering of pyramidal neurons during sharp wave ripples often faithfully reflects the sequential patterning of place cells before immobility and sleep. The “replay” of waking activity has been assumed to play a critical role in memory consolidation and transfer of information from the hippocampus to the neocortex (12, 13, 15–18), because selective elimination of ripples after task learning impairs memory performance (22–24). Recent studies also emphasized the prospective and constructive role of ripple sequences (16–19). Sequential activity of CA1 pyramidal neurons during ripples and in memory tasks during theta oscillations has been implicitly assumed to be generated in the recurrent excitatory networks of the hippocampal CA3 region and inherited through synaptic activity by the CA1 neuronal population (4, 12, 16, 21, 23) although direct evidence has not been shown experimentally. Our findings demonstrate that the CA1 region also contributes to the generation of these forward and reversed sequences.
Recently, we demonstrated that local optogenetic stimulation of CA1 pyramidal neurons is sufficient to induce fast LFP oscillations with many properties similar to spontaneously occurring ripples (26). Sequential activation of neurons during such artificial events by itself is not surprising: one can assume that the distribution of ChR2 is not equal across neurons and that light scattering from the optic fiber tip to the neuronal tissue is unequal. Thus, one might expect that optogenetic induction of synthetic ripples would be highly stereotyped. However, under the hypothesis of heterogeneous ChR2 distribution and unequal light distribution, no relationship of firing patterns is expected between spontaneous and synthetic ripples. In contrast, we observed strong firing rate correlations of both pyramidal cells and putative interneurons between baseline activity, spontaneous and induced ripples. Furthermore, phase-locking of neurons to ripple waves was also correlated. Finally, the temporal ordering of pyramidal cells and interneurons during theta oscillations, spontaneous and induced ripples was weakly yet consistently correlated.
When only sequences of pyramidal neurons were considered, the correlation between spontaneous and induced oscillations was not significant. However, this was also the case when sequence patterns were correlated within the same conditions. Interneurons were embedded in the assembly sequences, similar to a previous study examining the stability of sequential activation of pyramidal cells and interneurons during slow oscillations in the neocortex (34). Single interneurons are typically controlled by a limited number of pyramidal cell assemblies (35, 36) and suppress the competing assemblies, which can explain their orderly presence in the sequential patterns. In turn, interneuron spiking may provide a scaffold – a temporal backbone – for pyramidal cell spiking. It may well be that many more pyramidal neurons took part in the sequential patterning of activity than those monitored here by the silicon probes; recordings of larger ensembles of pyramidal cells in future experiments are needed to address this hypothesis.
How can correlations between internally and externally driven events arise? One clue lies in the wide dynamic range of the excitability of pyramidal cells and the spike transfer between pyramidal cells and fast spiking interneurons (37). An expected outcome of such a wide distribution of intrinsic properties is that the participation probability and temporal patterning of CA1 neurons during spontaneous ripples can be only partially dictated by the upstream CA3 neurons, and that the intrinsic properties bias the participation probability and sequential recruitment of neurons in response to optogenetic activation. In line with this reasoning, pyramidal neurons vary extensively in their responses to in vitro current injection (38, 39). Thus, even if every neuron experienced an identical ramp of input current (from the CA3 population during spontaneous ripple events or from the light stimulus during synthetic ripples), diverse spike patterns and sequential activity would still ensue due to intrinsic neuronal/circuit heterogeneity.
The similar participation probability and sequential patterning of putative interneurons during both spontaneous and induced ripples indicate that, in addition to the hypothesized biophysical heterogeneity of neurons, local synaptic interactions are also important. Sequential firing of interneuron spikes, intermingled with pyramidal neurons during spontaneous ripples, is not unexpected given the timing relations observed among the distinct interneuron classes during ripples (28–30). Although most interneurons receive predominantly local input, others also receive synaptic input from CA3 and extrahippocampal sources (40). Our findings demonstrate that similar sequential patterning of CA1 pyramidal cells and interneurons can be induced by local mechanisms and somewhat independently of the nature of triggering inputs.
We hypothesize that the intersection of three sources of mechanisms explains the observed spike correlations between spontaneous and synthetic ripples as well as their variability: sequential input drive from CA3, wide distribution of intrinsic cellular properties, and differences in local connectivity (the last two leading to unequal responses to extrinsic activation). The preexisting sequences may themselves reflect the local circuit configurations shaped by previous experiences, by the developmental genetic program, or any combination thereof. This hypothesis does not reduce the importance of spatiotemporally structured input from CA3 and experience-induced synaptic changes, yet emphasizes that intrinsic cellular properties and local synaptic interactions in the CA1 region (41) also play an important role in shaping the sequential firing of CA1 neurons. Sequentially ordered firing patterns are not unique to the hippocampus but also occur in the neocortex during the UP state of slow oscillations (34, 42), suggesting that intrinsic neuronal and local-circuit properties may play a similar role in other systems as well.
Our findings demonstrate that circuit and intrinsic channel properties of neurons – and in particular, interactions between principal cells and interneurons – play a role in determining the probability by which particular neurons are drawn for a given task (15) and may influence their sequential activation during both theta and ripple oscillations in the intact animal. Previous work already indicated that spike rates of pyramidal cells and interneurons in CA1 (37, 43), and of head direction neurons in the thalamus and postsubiculum (44), are robustly correlated across brain states. Correlated sequences and pair-wise correlations between waking exploration and sleep are often taken as evidence for experience-induced synaptic plasticity (13–15, 45). However, preexisting correlations have also been reported between sleep epochs that precede and follow a novel experience (“preplay;” refs. 43 and 46). These observations, combined with the present findings using optical activation of hippocampal circuits, indicate that learning-induced effects should be carefully separated from preexisting conditions biased by the intrinsic properties of neurons and the local interactions between pyramidal cells and interneurons (41–43, 46, 47).
Methods
Ten mice were used in this study; nine expressed ChR2 in CA1 pyramidal cells under the CaMKII promoter, and one was opsin-free; all mice were implanted with multisite diode probes (48). Each probe had four or six shanks (intershank spacing, 200 μm) with 8 or 10 sites per shank (intersite spacing, 20 μm), and each shank was associated with an optical fiber coupled to a miniature LED or laser diode. Light stimulation (50- to 70-ms light pulses) was applied on every shank separately during spontaneous behavior in the home cage (n = 4 mice) or during urethane anesthesia (n = 6 mice; ref. 49). Offline, spikes were sorted and classified as putatitve PYR or INT using a Gaussian mixture model (49). Spike sequences were detected and compared using a cross-validated template method or an alternate pair-wise method; statistical significance was verified by resampling (permutation test). An α level of 0.05 was used throughout. All animal handling procedures were approved by the New York University Animal Care and Facilities committee. For more details, see SI Methods.
SI Methods
Animals and Surgery.
Four freely moving and six urethane anesthetized mice were used in this study. All animals expressed ChR2 under the CaMKII promoter. In two of the freely moving animals, virus (rAAV5/CaMKIIa-hChR2(h134R)-EYFP; viral titer estimated at 4 × 10¹² IU/mL; University of North Carolina viral core facility, courtesy of K. Deisseroth) was injected stereotactically into CA1 (AP -1.6, ML 1.1, DV 1.1 ± 0.2 mm; 55 nl/site; Nanoject II, Drummond). The other animals were cross-bred transgenics [B6.Cg-Tg(Camk2a-cre)T29-1Stl female, Jackson Labs 005359; cross-bred with B6;129S-Gt(ROSA)26Sortm32(CAG-COP4*H134R/EYFP)Hze/J male, Jackson Labs 012569; five mice] or opsin-free (C57BL/6J, Jackson Labs; one mouse). In all animals, a craniotomy was made above the right hemisphere (AP −1.6 and ML 1.1 mm), and a 32-site/four-shank probe (Buzsaki32, NeuroNexus) equipped with four blue and/or violet diodes (48) was mounted on a movable microdrive and implanted in the neocortex under isoflurane anesthesia. After recovery from anesthesia, subsequent downward movements of the probe were made in 35- to 70-μm increments over 12- to 24-h intervals until approaching the CA1 pyramidal cell layer, recognized by the appearance of multiple high-amplitude units and spontaneous ripple events. After implantation, animals were kept one to a cage on a reversed light/dark cycle. Experiments with urethane-anesthetized animals (1.5 g/kg) utilitized 64-site, six-shank/six-LED diode-probes and followed similar procedures (49). Peak light power, measured at the tip of the shanks before implantation, was 29 ± 12 μW (mean ± SD) for 470-nm LEDs and 239 ± 61 μW for 405-nm laser diodes.
Electrophysiology and Photostimulation.
Neural activity was wide-band filtered (1–5,000 Hz, RC Electronics), amplified (20×, HST/32V-G20 headstage, Plexon; and 50×, RC Electronics), and digitized (16 bit, 20 kHz digitization, DataMax) or amplified and multiplexed on the headstage (0.3–10,000 Hz, 400×; RHA2132, Intan) and then digitized (14 bit, 20 kHz, AmpliPex). Freely moving animals were equipped with a 3-axis accelerometer (ADXL-330, Analog Devices) for monitoring head-movements, two head-mounted LEDs for online video tracking, or both. Recordings from freely moving animals were carried out in the home cage during spontaneous behavior. After each session the probe was either left in place or advanced in 35–70 μm steps and the brain was allowed to settle overnight. At each location in the brain, neuronal activity was inspected for spontaneous spiking activity, and if encountered, a baseline period of at least 15 min was recorded followed by light stimulation.
All shanks were equipped with diodes, driven by a custom-made 16-channel current source (48), controlled by a programmable DSP (25 kHz, RX6 or RX8, Tucker-Davis Technologies) via MATLAB (MathWorks). Photostimulation was performed at each shank separately at the minimal light intensity that evoked an effect detectable by visual inspection during the experiment, and at multiple intensities above and below that level. All stimuli were a-periodic and had a square pulse (50-70 ms) envelope.
Spike Sorting and Ripple Detection.
For offline analysis, spike waveforms were extracted from the wide-band recorded signals and sorted into individual units (49). Briefly, waveforms were linearly detrended, projected onto a common basis obtained by principal component analysis of the data, and sorted automatically followed by manual adjustment. Only well-isolated units (amplitude >50 μV; l-ratio <0.05; interspike interval index <0.2) were used. Subsequently each unit was tagged as excitatory/inhibitory [based on peaks/troughs in the short-time (±5 ms) pair-wise cross correlation; P < 0.001, convolution test] and/or classified as putative PYR or INT (based on a Gaussian-mixture model; P < 0.05; ref. 49). We recorded a total of 582 well isolated cells from CA1 of four freely moving and six anesthetized mice. Of these, 496 were PYR and 86 were INT.
Ripples were detected independently at each recording site (26). Briefly, the wide-band signal was band-pass filtered (80–250 Hz), and instantaneous power was computed by clipping extreme values to 5 SD, rectifying, and low-pass filtering (52.5 Hz). The mean and SD were computed from the power of the clipped signal during slow-wave sleep (defined as nontheta, nonmovement periods) in the absence of light stimulation. Subsequently, the power of the original trace was computed, and all events exceeding 5 SD from the mean were selected. Short events (duration < 15 ms) were discarded, and adjacent events (gap < 15 ms) were merged. Events were then expanded until the power fell below 2 SD and aligned by the trough (of the nonrectified signal) closest to the peak power. For each shank separately, the site with the maximal ripple amplitude was determined and defined as the center of the CA1 pyramidal cell layer.
Sequence Determination.
For the analysis of sequences, only sites in which at least 100 spontaneous ripples were observed and at least 10 optical stimuli were applied at threshold intensity were used, yielding a total of 56 distinct sites (27 in freely moving mice; 29 in urethane-anesthetized mice) recorded during 16 sessions (one to three sessions per mouse). Threshold intensity (defined as the minimal light intensity that induced synthetic ripples with amplitude not smaller than that observed during spontaneous ripples; ref. 26) was used, because at higher intensities many spikes are superimposed near the induced ripple cycle troughs and cannot be disambiguated using extracellular recording methods.
For each event class (theta cycle, spontaneous ripple, or induced ripple), all spiking units were considered, both those recorded on the same shank as the ripple and on other shanks, because interneurons on distant shanks modulate their timing during spatially confined ripple events (26). Only events with at least two spiking units were considered. For each specific event, the spiking units were rank ordered chronologically. For instance, if the considered units are 1, 2, 3, 4, and 5, and during a given event units 2 and 4 spiked, 4 first, then unit 4 received rank = 1 and unit 2 received rank = 2. If a given unit spiked more than once during an event, only the first spike was considered. Two methods were used: template and pair-wise. In the cross-validated template method, a template for each specific ripple or theta event was constructed based on the averaged rank of all units over all other events (i.e., excluding that specific event). Then the rank correlation between each specific event and its template was computed, and averaged over all events; this includes n comparisons (n being the number of valid events). In the pair-wise method, there is no template; rather, the rank correlation is computed between each pair of events (n × (n − 1)/2 comparisons).
For comparing spike sequences during spontaneous and induced events (cross-class consistency), the same two methods were used. In the template method, the template was based on the spontaneous events, whereas the events tested were the induced events. In the pair-wise method, rank correlations were computed between all possible spontaneous and synthetic ripple events (i.e., spontaneous–spontaneous and induced–induced correlations were not considered). Thus, in this application, the template method is asymmetric, whereas the pair-wise method is symmetric (i.e., the null hypothesis is the same, with a different alternative).
Statistical significance of sequence consistency was determined by a permutation test, randomly shuffling the ranks of the units that participated in each event and carrying out the entire procedure, culminating in the computation of the mean rank correlation. This was repeated 1,000 times and the observed mean rank correlation was compared with the distribution of the randomly permuted mean rank correlations (Fig. 4B).
Statistical Testing.
For a given effect size, the power of any statistical test depends on the α level. To increase the sensitivity of detecting effects, results are reported based on a significance threshold α = 0.05, and all groups included enough samples to enable rejection of the null at that level. Wilcoxon’s signed-rank test was used for paired testing (or, one-sided, for a zero-median null) and Mann–Whitney U test (two-sided) was used for comparing the medians of unpaired groups. For proportions, the exact Binomial test (single comparisons) and the χ2 test (pairwise or multiple groups) were used. Circular measures were tested using the χ2 or the Rayleigh test. All results were verified independently by resampling (permutation) tests.
Acknowledgments
We thank Karl Deisseroth for providing adeno-associated viruses, Kamran Diba for insightful comments, and Shigeyoshi Fujisawa for help maintaining transgenic animals. This work was supported by the Rothschild Foundation (to E.S.), Human Frontiers in Science Program LT-000346/2009-L (to E.S.), Machiah Foundation 20090098 (to E.S.), National Institutes of Health Grants (MH54671; MH102840; NS074015), the Mathers Foundation, The Human Frontier Science Program, and the National Science Foundation (Temporal Dynamics of Learning Center Grant SBE 0542013).
Footnotes
The authors declare no conflict of interest.
This article is a PNAS Direct Submission. H.E. is a guest editor invited by the Editorial Board.
This article contains supporting information online at www.pnas.org/lookup/suppl/doi:10.1073/pnas.1508785112/-/DCSupplemental.
References
- 1.Hebb DO. The Organization of Behavior. Wiley & Sons; New York: 1949. [Google Scholar]
- 2.Prut Y, et al. Spatiotemporal structure of cortical activity: Properties and behavioral relevance. J Neurophysiol. 1998;79(6):2857–2874. doi: 10.1152/jn.1998.79.6.2857. [DOI] [PubMed] [Google Scholar]
- 3.Fujisawa S, Amarasingham A, Harrison MT, Buzsáki G. Behavior-dependent short-term assembly dynamics in the medial prefrontal cortex. Nat Neurosci. 2008;11(7):823–833. doi: 10.1038/nn.2134. [DOI] [PMC free article] [PubMed] [Google Scholar]
- 4.Pastalkova E, Itskov V, Amarasingham A, Buzsáki G. Internally generated cell assembly sequences in the rat hippocampus. Science. 2008;321(5894):1322–1327. doi: 10.1126/science.1159775. [DOI] [PMC free article] [PubMed] [Google Scholar]
- 5.Harvey CD, Coen P, Tank DW. Choice-specific sequences in parietal cortex during a virtual-navigation decision task. Nature. 2012;484(7392):62–68. doi: 10.1038/nature10918. [DOI] [PMC free article] [PubMed] [Google Scholar]
- 6.Abeles M. Corticonics: Neural Circuits of the Cerebral Cortex. Cambridge University Press; New York: 1991. [Google Scholar]
- 7.Itskov V, Curto C, Pastalkova E, Buzsáki G. Cell assembly sequences arising from spike threshold adaptation keep track of time in the hippocampus. J Neurosci. 2011;31(8):2828–2834. doi: 10.1523/JNEUROSCI.3773-10.2011. [DOI] [PMC free article] [PubMed] [Google Scholar]
- 8.O’Keefe J, Nadel L. The Hippocampus as a Cognitive Map. Oxford University Press; Oxford: 1978. [Google Scholar]
- 9.O’Keefe J, Burgess N. Geometric determinants of the place fields of hippocampal neurons. Nature. 1996;381(6581):425–428. doi: 10.1038/381425a0. [DOI] [PubMed] [Google Scholar]
- 10.Fyhn M, Molden S, Witter MP, Moser EI, Moser MB. Spatial representation in the entorhinal cortex. Science. 2004;305(5688):1258–1264. doi: 10.1126/science.1099901. [DOI] [PubMed] [Google Scholar]
- 11.MacDonald CJ, Lepage KQ, Eden UT, Eichenbaum H. Hippocampal “time cells” bridge the gap in memory for discontiguous events. Neuron. 2011;71(4):737–749. doi: 10.1016/j.neuron.2011.07.012. [DOI] [PMC free article] [PubMed] [Google Scholar]
- 12.Buzsáki G. Two-stage model of memory trace formation: A role for “noisy” brain states. Neuroscience. 1989;31(3):551–570. doi: 10.1016/0306-4522(89)90423-5. [DOI] [PubMed] [Google Scholar]
- 13.Wilson MA, McNaughton BL. Reactivation of hippocampal ensemble memories during sleep. Science. 1994;265(5172):676–679. doi: 10.1126/science.8036517. [DOI] [PubMed] [Google Scholar]
- 14.Nádasdy Z, Hirase H, Czurkó A, Csicsvari J, Buzsáki G. Replay and time compression of recurring spike sequences in the hippocampus. J Neurosci. 1999;19(21):9497–9507. doi: 10.1523/JNEUROSCI.19-21-09497.1999. [DOI] [PMC free article] [PubMed] [Google Scholar]
- 15.Lee AK, Wilson MA. Memory of sequential experience in the hippocampus during slow wave sleep. Neuron. 2002;36(6):1183–1194. doi: 10.1016/s0896-6273(02)01096-6. [DOI] [PubMed] [Google Scholar]
- 16.Foster DJ, Wilson MA. Reverse replay of behavioural sequences in hippocampal place cells during the awake state. Nature. 2006;440(7084):680–683. doi: 10.1038/nature04587. [DOI] [PubMed] [Google Scholar]
- 17.Diba K, Buzsáki G. Forward and reverse hippocampal place-cell sequences during ripples. Nat Neurosci. 2007;10(10):1241–1242. doi: 10.1038/nn1961. [DOI] [PMC free article] [PubMed] [Google Scholar]
- 18.Karlsson MP, Frank LM. Awake replay of remote experiences in the hippocampus. Nat Neurosci. 2009;12(7):913–918. doi: 10.1038/nn.2344. [DOI] [PMC free article] [PubMed] [Google Scholar]
- 19.Davidson TJ, Kloosterman F, Wilson MA. Hippocampal replay of extended experience. Neuron. 2009;63(4):497–507. doi: 10.1016/j.neuron.2009.07.027. [DOI] [PMC free article] [PubMed] [Google Scholar]
- 20.Pfeiffer T, Draguhn A, Reichinnek S, Both M. Optimized temporally deconvolved Ca²⁺ imaging allows identification of spatiotemporal activity patterns of CA1 hippocampal ensembles. Neuroimage. 2014;94:239–249. doi: 10.1016/j.neuroimage.2014.03.030. [DOI] [PubMed] [Google Scholar]
- 21.Buzsáki G, Horváth Z, Urioste R, Hetke J, Wise K. High-frequency network oscillation in the hippocampus. Science. 1992;256(5059):1025–1027. doi: 10.1126/science.1589772. [DOI] [PubMed] [Google Scholar]
- 22.Girardeau G, Benchenane K, Wiener SI, Buzsáki G, Zugaro MB. Selective suppression of hippocampal ripples impairs spatial memory. Nat Neurosci. 2009;12(10):1222–1223. doi: 10.1038/nn.2384. [DOI] [PubMed] [Google Scholar]
- 23.Ego-Stengel V, Wilson MA. Disruption of ripple-associated hippocampal activity during rest impairs spatial learning in the rat. Hippocampus. 2010;20(1):1–10. doi: 10.1002/hipo.20707. [DOI] [PMC free article] [PubMed] [Google Scholar]
- 24.Jadhav SP, Kemere C, German PW, Frank LM. Awake hippocampal sharp-wave ripples support spatial memory. Science. 2012;336(6087):1454–1458. doi: 10.1126/science.1217230. [DOI] [PMC free article] [PubMed] [Google Scholar]
- 25.Sullivan D, et al. Relationships between hippocampal sharp waves, ripples, and fast gamma oscillation: Influence of dentate and entorhinal cortical activity. J Neurosci. 2011;31(23):8605–8616. doi: 10.1523/JNEUROSCI.0294-11.2011. [DOI] [PMC free article] [PubMed] [Google Scholar]
- 26.Stark E, et al. Pyramidal cell-interneuron interactions underlie hippocampal ripple oscillations. Neuron. 2014;83(2):467–480. doi: 10.1016/j.neuron.2014.06.023. [DOI] [PMC free article] [PubMed] [Google Scholar]
- 27.Thomson AM, Radpour S. Excitatory connections between CA1 pyramidal cells revealed by spike triggered averaging in slices of rat hippocampus are partially NMDA receptor mediated. Eur J Neurosci. 1991;3(6):587–601. doi: 10.1111/j.1460-9568.1991.tb00845.x. [DOI] [PubMed] [Google Scholar]
- 28.Csicsvari J, Hirase H, Czurkó A, Mamiya A, Buzsáki G. Oscillatory coupling of hippocampal pyramidal cells and interneurons in the behaving Rat. J Neurosci. 1999;19(1):274–287. doi: 10.1523/JNEUROSCI.19-01-00274.1999. [DOI] [PMC free article] [PubMed] [Google Scholar]
- 29.Klausberger T, Somogyi P. Neuronal diversity and temporal dynamics: The unity of hippocampal circuit operations. Science. 2008;321(5885):53–57. doi: 10.1126/science.1149381. [DOI] [PMC free article] [PubMed] [Google Scholar]
- 30.Varga C, Golshani P, Soltesz I. Frequency-invariant temporal ordering of interneuronal discharges during hippocampal oscillations in awake mice. Proc Natl Acad Sci USA. 2012;109(40):E2726–E2734. doi: 10.1073/pnas.1210929109. [DOI] [PMC free article] [PubMed] [Google Scholar]
- 31.Freund TF, Buzsáki G. Interneurons of the hippocampus. Hippocampus. 1996;6(4):347–470. doi: 10.1002/(SICI)1098-1063(1996)6:4<347::AID-HIPO1>3.0.CO;2-I. [DOI] [PubMed] [Google Scholar]
- 32.Fishell G, Rudy B. Mechanisms of inhibition within the telencephalon: “where the wild things are”. Annu Rev Neurosci. 2011;34:535–567. doi: 10.1146/annurev-neuro-061010-113717. [DOI] [PMC free article] [PubMed] [Google Scholar]
- 33.Chrobak JJ, Buzsáki G. Selective activation of deep layer (V-VI) retrohippocampal cortical neurons during hippocampal sharp waves in the behaving rat. J Neurosci. 1994;14(10):6160–6170. doi: 10.1523/JNEUROSCI.14-10-06160.1994. [DOI] [PMC free article] [PubMed] [Google Scholar]
- 34.Luczak A, Barthó P, Marguet SL, Buzsáki G, Harris KD. Sequential structure of neocortical spontaneous activity in vivo. Proc Natl Acad Sci USA. 2007;104(1):347–352. doi: 10.1073/pnas.0605643104. [DOI] [PMC free article] [PubMed] [Google Scholar]
- 35.Maurer AP, Cowen SL, Burke SN, Barnes CA, McNaughton BL. Phase precession in hippocampal interneurons showing strong functional coupling to individual pyramidal cells. J Neurosci. 2006;26(52):13485–13492. doi: 10.1523/JNEUROSCI.2882-06.2006. [DOI] [PMC free article] [PubMed] [Google Scholar]
- 36.Geisler C, Robbe D, Zugaro M, Sirota A, Buzsáki G. Hippocampal place cell assemblies are speed-controlled oscillators. Proc Natl Acad Sci USA. 2007;104(19):8149–8154. doi: 10.1073/pnas.0610121104. [DOI] [PMC free article] [PubMed] [Google Scholar]
- 37.Mizuseki K, Buzsáki G. Preconfigured, skewed distribution of firing rates in the hippocampus and entorhinal cortex. Cell Reports. 2013;4(5):1010–1021. doi: 10.1016/j.celrep.2013.07.039. [DOI] [PMC free article] [PubMed] [Google Scholar]
- 38.Jarsky T, Mady R, Kennedy B, Spruston N. Distribution of bursting neurons in the CA1 region and the subiculum of the rat hippocampus. J Comp Neurol. 2008;506(4):535–547. doi: 10.1002/cne.21564. [DOI] [PubMed] [Google Scholar]
- 39.Dougherty KA, Islam T, Johnston D. Intrinsic excitability of CA1 pyramidal neurones from the rat dorsal and ventral hippocampus. J Physiol. 2012;590(Pt 22):5707–5722. doi: 10.1113/jphysiol.2012.242693. [DOI] [PMC free article] [PubMed] [Google Scholar]
- 40.Freund TF, Antal M. GABA-containing neurons in the septum control inhibitory interneurons in the hippocampus. Nature. 1988;336(6195):170–173. doi: 10.1038/336170a0. [DOI] [PubMed] [Google Scholar]
- 41.Lee SH, et al. Parvalbumin-positive basket cells differentiate among hippocampal pyramidal cells. Neuron. 2014;82(5):1129–1144. doi: 10.1016/j.neuron.2014.03.034. [DOI] [PMC free article] [PubMed] [Google Scholar]
- 42.Luczak A, Barthó P, Harris KD. Spontaneous events outline the realm of possible sensory responses in neocortical populations. Neuron. 2009;62(3):413–425. doi: 10.1016/j.neuron.2009.03.014. [DOI] [PMC free article] [PubMed] [Google Scholar]
- 43.Hirase H, Leinekugel X, Czurkó A, Csicsvari J, Buzsáki G. Firing rates of hippocampal neurons are preserved during subsequent sleep episodes and modified by novel awake experience. Proc Natl Acad Sci USA. 2001;98(16):9386–9390. doi: 10.1073/pnas.161274398. [DOI] [PMC free article] [PubMed] [Google Scholar]
- 44.Peyrache A, Lacroix MM, Petersen PC, Buzsáki G. Internally organized mechanisms of the head direction sense. Nat Neurosci. 2015;18(4):569–575. doi: 10.1038/nn.3968. [DOI] [PMC free article] [PubMed] [Google Scholar]
- 45.Mizunuma M, et al. Unbalanced excitability underlies offline reactivation of behaviorally activated neurons. Nat Neurosci. 2014;17(4):503–505. doi: 10.1038/nn.3674. [DOI] [PubMed] [Google Scholar]
- 46.Dragoi G, Tonegawa S. Preplay of future place cell sequences by hippocampal cellular assemblies. Nature. 2011;469(7330):397–401. doi: 10.1038/nature09633. [DOI] [PMC free article] [PubMed] [Google Scholar]
- 47.Kudrimoti HS, Barnes CA, McNaughton BL. Reactivation of hippocampal cell assemblies: Effects of behavioral state, experience, and EEG dynamics. J Neurosci. 1999;19(10):4090–4101. doi: 10.1523/JNEUROSCI.19-10-04090.1999. [DOI] [PMC free article] [PubMed] [Google Scholar]
- 48.Stark E, Koos T, Buzsáki G. Diode probes for spatiotemporal optical control of multiple neurons in freely moving animals. J Neurophysiol. 2012;108(1):349–363. doi: 10.1152/jn.00153.2012. [DOI] [PMC free article] [PubMed] [Google Scholar]
- 49.Stark E, et al. Inhibition-induced theta resonance in cortical circuits. Neuron. 2013;80(5):1263–1276. doi: 10.1016/j.neuron.2013.09.033. [DOI] [PMC free article] [PubMed] [Google Scholar]