

Significance
This study describes a previously undefined role for myotubularin-related protein 3 (MTMR3) in modulating pattern recognition receptor (PRR)-induced responses and identifies mechanisms mediating these outcomes in primary human macrophages. It further defines that MTMR3 in the inflammatory bowel disease risk MTMR3/HORMAD2/LIF/OSM locus accounts for the genotype-dependent regulation of PRR-initiated outcomes in macrophages. Our studies highlight mechanisms whereby MTMR3 may contribute to intestinal inflammation, specifically both by inhibiting autophagy and by enhancing signaling and cytokine secretion upon stimulation of a broad range of PRRs.
Keywords: Crohn's disease, ulcerative colitis, NOD2, genetics, Toll-like receptors
Abstract
Inflammatory bowel disease (IBD) is characterized by dysregulated host:microbial interactions and cytokine production. Host pattern recognition receptors (PRRs) are critical in regulating these interactions. Multiple genetic loci are associated with IBD, but altered functions for most, including in the rs713875 MTMR3/HORMAD2/LIF/OSM region, are unknown. We identified a previously undefined role for myotubularin-related protein 3 (MTMR3) in amplifying PRR-induced cytokine secretion in human macrophages and defined MTMR3-initiated mechanisms contributing to this amplification. MTMR3 decreased PRR-induced phosphatidylinositol 3-phosphate (PtdIns3P) and autophagy levels, thereby increasing PRR-induced caspase-1 activation, autocrine IL-1β secretion, NFκB signaling, and, ultimately, overall cytokine secretion. This MTMR3-mediated regulation required the N-terminal pleckstrin homology-GRAM domain and Cys413 within the phosphatase domain of MTMR3. In MTMR3-deficient macrophages, reducing the enhanced autophagy or restoring NFκB signaling rescued PRR-induced cytokines. Macrophages from rs713875 CC IBD risk carriers demonstrated increased MTMR3 expression and, in turn, decreased PRR-induced PtdIns3P and autophagy and increased PRR-induced caspase-1 activation, signaling, and cytokine secretion. Thus, the rs713875 IBD risk polymorphism increases MTMR3 expression, which modulates PRR-induced outcomes, ultimately leading to enhanced PRR-induced cytokines.
Inflammatory bowel disease (IBD) is characterized by dysregulated intestinal immune homeostasis and cytokine production (1). Given the key role for host–microbe interactions in the intestine, proper regulation of pattern recognition receptor (PRR) signaling and cytokine secretion is critical. Although a number of loci have now been associated with IBD (2), altered functions for the majority of these loci are unknown. Defining these functions is essential to our understanding of IBD pathophysiology and to our ability to ultimately target these implicated pathways.
Polymorphisms in the MTMR3/HORMAD2/LIF/OSM region on chromosome 22 are associated with Crohn’s disease and ulcerative colitis (2, 3), the two IBD subtypes. The specific gene(s) mediating the association and the functional consequences of the polymorphisms are not yet reported, although leukemia inhibitory factor (LIF) and Oncostatin M (OSM) have been proposed as candidates (2). Myotubularin-related protein 3 (MTMR3) is a member of the myotubularin family. Mutations in certain myotubularin members can lead to neuromuscular diseases (4). Active myotubularin members possess phosphoinositide 3-protein tyrosine phosphatase activity; the active phosphatase domain located in the MTMR3 N-terminal region dephosphorylates phosphatidylinositol 3-phosphate (PtdIns3P) and PtdIns(3,5)P2 (4, 5). PtdIns3P is an important lipid mediator of membrane trafficking and signaling and participates in effector recruitment to autophagic membranes. Consistently, MTMR3 can inhibit constitutive autophagy in select cell lines (5–7). However, MTMR3 biology has been relatively unexplored, and a role for MTMR3 in regulating PRR-initiated outcomes, which are relevant to the intestinal immune system, has not been reported. Further, its role in primary human cells, where responses can be dramatically different (8), has not been examined. Given the importance of PRR regulation in intestinal tissues and the ability of autophagy to modulate PRR-initiated outcomes, we hypothesized that MTMR3 would regulate PRR-induced autophagy and thereby PRR-induced signaling and cytokine secretion. We further hypothesized that the IBD-associated polymorphisms in the MTMR3/HORMAD2/LIF/OSM region would modulate these outcomes.
In this study, we identified a role for MTMR3 in PRR-initiated responses in primary human macrophages. Upon PRR stimulation, MTMR3 decreased PtdIns3P levels and autophagy, which in turn increased caspase-1 activation and autocrine IL-1β secretion, PI3K and NFκB activation, and secretion of long-term cytokines. The MTMR3-mediated regulation of these PRR-induced outcomes required the pleckstrin homology-Glucosyltransferase, Rab-like GTPase activator and Myotubularins (PH-GRAM) domain and Cys413 within the phosphatase domain of MTMR3. Further, MTMR3 transiently relocalized from the cytoplasm to the nucleus after PRR stimulation, corresponding to the PRR-induced PtdIns3P and autophagy observed in the cytoplasm. Monocyte-derived macrophages (MDMs) from rs713875 CC genotype IBD risk carriers expressed increased MTMR3 mRNA and protein, and, in turn, decreased PRR-induced PtdIns3P and autophagy levels and increased PRR-induced caspase-1 activation, signaling and cytokine secretion relative to G carriers. These results collectively establish a role for the MTMR3 gene in the MTMR3/HORMAD2/LIF/OSM region in association with IBD pathogenesis and highlight a previously undefined mechanism for MTMR3 in modulating PRR-induced autophagy and cytokine secretion, two processes critical to intestinal immune homeostasis.
Results
Human Myeloid-Derived Cells from IBD Risk-Associated rs713875 CC Carriers Demonstrate Increased PRR-Induced Cytokine Secretion.
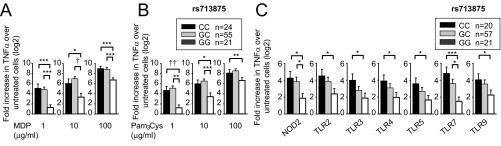
PRR-initiated outcomes, including cytokine secretion, in myeloid-derived cells are important in IBD pathophysiology (9). As the rs713875 MTMR3/HORMAD2/LIF/OSM region polymorphism associated with IBD (3) contains genes with roles in autophagy [e.g., MTMR3 (5–7)], which can indirectly modulate cytokine secretion, and genes regulating T-cell cytokines [e.g., LIF (10)], we questioned if this polymorphism modulates PRR-initiated cytokines. The PRR nucleotide-binding oligomerization domain 2 (NOD2) is associated to Crohn’s disease (1). We therefore used muramyl dipeptide (MDP), the peptidoglycan component that specifically activates NOD2, to treat MDMs from 100 healthy individuals. We examined IL-1β protein secretion, given its role in amplifying cytokines in MDMs (11). IL-1β secretion was normalized to untreated cells, and data were log2 transformed. MDMs from rs713875 C risk genotype carriers secreted increased IL-1β upon NOD2 stimulation compared with GG carriers (Fig. 1A). Effects were most pronounced at low MDP doses, but persisted at higher doses (Fig. 1A). Similar results were observed with tumor necrosis factor (TNF)α secretion (Fig. S1A).
Fig. 1.

Human myeloid cells from disease-associated rs713875 C carriers demonstrate increased cytokine secretion upon PRR stimulation. Human MDMs (n = 100) were treated for 24 h with (A) 1, 10, or 100 μg/mL MDP or (B) 1, 10, or 100 μg/mL Pam3Cys. (C) MDDCs (n = 98) were treated for 24 h with 1 μg/mL MDP (NOD2 ligand), 1 μg/mL Pam3Cys (TLR2), 0.1 μg/mL polyI:C (TLR3), 0.01 μg/mL lipid A (TLR4), 0.5 ng/mL flagellin (TLR5), 0.1 μg/mL CL097 (TLR7), or 0.1 μg/mL CpG DNA (TLR9) for 24 h. Fold induction of secreted IL-1β protein (log2 transformed) upon PRR stimulation stratified on rs713875 genotype + SEM. *P < 0.05; **P < 0.01; ***P < 0.001; †P < 1 × 10⁻⁴.
Fig. S1.
Primary human myeloid cells from disease-associated rs713875 CC carriers demonstrate increased TNFα secretion upon PRR stimulation. Human MDMs (n = 100) were treated for 24 h with (A) 1, 10, or 100 μg/mL MDP or (B) 1, 10, or 100 μg/mL Pam3Cys. (C) Human MDDCs (n = 98) were treated for 24 h with 1 μg/mL MDP (NOD2 ligand), 1 μg/mL Pam3Cys (TLR2 ligand), 0.1 μg/mL polyI:C (TLR3 ligand), 0.01 μg/mL lipid A (TLR4 ligand), 0.5 ng/mL flagellin (TLR5 ligand), 0.1 μg/mL CL097 (TLR7 ligand), or 0.1 μg/mL CpG DNA (TLR9 ligand) for 24 h. Shown is fold induction of secreted TNFα protein (log2 transformed) upon PRR stimulation stratified on the rs713875 genotype + SEM. *P < 0.05; **P < 0.01; ***P < 0.001; †P < 1 × 10⁻⁴; ††P < 1 × 10⁻⁵.
Both the NOD2 ligand peptidoglycan and the TLR2 ligand lipotechoic acid are present in Gram-positive bacteria. MDMs treated with Pam3Cys, a synthetic TLR2 ligand, also showed increased IL-1β (Fig. 1B) and TNFα (Fig. S1B) protein secretion. Cytokine secretion from NOD2- and TLR2-stimulated MDMs (Fig. 1 A and B) and monocyte-derived dendritic cells (MDDCs) (Fig. 1C) was similarly regulated by rs713875 genotype. In the intestine, additional PRRs are activated by microbial products. In MDDCs from a separate cohort of 98 healthy individuals, rs713875 C carriers secreted increased IL-1β (Fig. 1C) and TNFα (Fig. S1C) following TLR2, TLR3, TLR4, TLR5, TLR7, and TLR9 stimulation. Taken together, myeloid cells from rs713875 IBD risk carriers in the MTMR3/HORMAD2/LIF/OSM region show increased PRR-induced cytokine secretion.
MTMR3 Is Required for Optimal PRR-Induced Cytokine Secretion.
We next questioned which gene(s) in the MTMR3/HORMAD2/LIF/OSM region accounts for the genotype-dependent regulation of PRR-induced cytokine secretion observed. HORMAD2 regulates cell cycle progression, and its expression has not been described in myeloid cells. We did not detect HORMAD2 mRNA in primary human MDMs; as expected, it was expressed in HepG2 liver cells (Fig. S2A). We then used siRNA to effectively knock down the expression of LIF, OSM (Fig. S2B), and MTMR3 (Fig. S2C). Leukemia inhibitory factor (LIF) and Oncostatin M (OSM) knockdown did not affect PRR-induced cytokine secretion (Fig. S2D). We confirmed the lack of a role for LIF and OSM in regulating PRR-induced cytokine secretion through an independent approach using LIF receptor and OSM blocking antibodies (Fig. S2E). The antibodies were functional, as they effectively decreased IFNγ secretion from stimulated Jurkat T cells (Fig. S2F). In contrast, MTMR3 knockdown decreased NOD2-induced pro- and anti-inflammatory cytokines (Fig. 2A). Cell viability was intact (Fig. S3A), and cells remained responsive to an alternative pathway through dectin stimulation (Fig. S3B). We confirmed Fig. 2A results with three additional siRNA constructs to MTMR3 (Fig. S3 C and D). Moreover, we considered additional gene candidates somewhat further from rs713875, including NF2, CABP7, and ZMAT5. Effective knockdown of these genes (Fig. S2G) did not alter NOD2-induced cytokine secretion in human MDMs (Fig. S2D). Finally, consistent with the rs713875 genotype regulation of cytokines upon stimulation of various PRRs (Fig. 1C and Fig. S1C), MTMR3 knockdown in MDMs decreased cytokine secretion upon stimulation of multiple PRRs (Fig. S3E).
Fig. S2.

LIF, OSM, NF2, CABP7, and ZMAT5 do not modulate NOD2-induced cytokine secretion in human MDMs. (A) Human MDMs (n = 4) were assessed for HORMAD2 mRNA expression and normalized to a positive control using HepG2 cells. (B) MDMs (n = 4) were transfected with scrambled, LIF, or OSM siRNA for 48 h. Fold change in expression of indicated transcripts compared with scrambled siRNA-transfected cells (represented by the dotted line at 1) + SEM. (C) MDMs (n = 4) were transfected with scrambled or MTMR3 siRNA for 48 h. (Left) Fold change in expression of MTMR3 mRNA compared with scrambled siRNA-transfected cells (represented by the dotted line at 1) + SEM. (Right) Western blot of MTMR3 expression from two representative donors. Numbers above lanes indicate densitometry measures normalized to scrambled siRNA-transfected cells from each donor. (D) MDMs (n = 4) were transfected with scrambled, LIF, OSM, NF2, CABP7, or ZMAT5 siRNA for 48 h and then treated with 100 μg/mL MDP for 24 h. Shown is cytokine secretion + SEM. (E) MDMs (n = 6) were incubated with anti-LIF receptor or anti-OSM blocking antibody (R&D Systems, Inc.) or an isotype control, along with 100 μg/mL MDP for 24 h. Shown is cytokine secretion + SEM. (F) Jurkat cells (three replicates) were incubated with anti-LIF receptor or anti-OSM blocking antibody, along with 25 ng/mL phorbol 12-myristate 12-acetate (PMA) and 1 μM ionomycin (Iono) for 24 h. Shown is IFN-γ secretion + SEM. (G) MDMs (n = 4) were transfected with scrambled, NF2, CABP7, or ZMAT5 siRNA for 48 h. Fold change in expression of indicated transcripts compared with scrambled siRNA-transfected cells (represented by the dotted line at 1) + SEM. (H) LIF and OSM mRNA expression (expressed as the change in CT values normalized to GAPDH and represented as a linear scale) + SEM stratified by rs713875 genotype (n = 10 per genotype). ND, not detected; Scr, scrambled; tx, treatment. **P < 0.01; ***P < 0.001.
Fig. 2.

MTMR3 regulates PRR-induced cytokine secretion, and MDMs from rs713875 C IBD risk carriers have increased MTMR3 expression. (A) MDMs (n = 4) were transfected with scrambled or MTMR3 siRNA for 48 h, then treated with 100 μg/mL MDP for 24 h. Mean cytokine secretion + SEM. Similar results were observed for an additional n = 6. (B and C) MDMs from rs713875 CC, CG, or GG carriers (n = 12 per genotype) were assessed for (B) MTMR3 mRNA expression (change in CT value normalized to GAPDH and represented as a linear scale) + SEM or (C) protein expression by Western blot. Representative Western blot from n = 3 per genotype and densitometry summary for the full cohort (normalized to GAPDH) + SEM. Scr, scrambled. **P < 0.01; ***P < 0.001.
Fig. S3.

Multiple independent siRNA constructs to MTMR3 decrease NOD2-induced cytokines, and MTMR3 regulates a broad range of PRRs. (A) MDMs (n = 3) were transfected with scrambled or MTMR3 siRNA for 48 h and then treated with 100 μg/mL MDP for 24 h and stained with annexin V and propidium iodide (PI). UV treatment at 50–100 J/m2 was used as a positive control. Shown is percent annexin V+/PI+ cells (percent dead cells) + SEM. (B) MDMs (n = 3) were transfected with scrambled or MTMR3 siRNA for 48 h, then treated with 100 μg/mL dispersible whole glucan particles (WGP) or 100 μg/mL curdlan (cur) (Invivogen) for 24 h. Treatment with 100 μg/mL MDP was used as a positive control for consequences of MTMR3 knockdown. Shown is IL-10 secretion + SEM. (C and D) MDMs (n = 4) were transfected with scrambled or MTMR3 siRNA [three different siRNA constructs, d-008039–02 (#1), d-008039–03(#2), or d-008039–04 (#3); Dharmacon] for 48 h and (C) fold change in MTMR3 mRNA expression was assessed, or (D) cells were treated for 100 μg/mL MDP for 24 h, and cytokine secretion + SEM is shown. (E) Human MDMs (n = 6) were transfected with scrambled or MTMR3 siRNA for 48 h and then treated for 24 h with 10 μg/mL Pam3Cys (TLR2), 100 μg/mL polyI:C (TLR3), 0.1 μg/mL lipid A (TLR4), 5 ng/mL flagellin (TLR5), 1 μg/mL CLO97 (TLR7), or 10 μg/mL CpG DNA (TLR9). Shown is cytokine secretion + SEM. NS, not significant; scr, scrambled; tx, treatment. *P < 0.05; **P < 0.01; ***P < 0.001.
IBD Risk rs713875 C Carriers Express Higher Levels of MTMR3.
Given the ability of MTMR3 to regulate PRR-induced cytokines and the location of the rs713875 polymorphism in a region ∼165 kb from MTMR3, we hypothesized the polymorphism would lead to altered MTMR3 expression. Rs713875 C risk carriers demonstrated increased MTMR3 mRNA (Fig. 2B) and protein (Fig. 2C) expression relative to GG individuals. As reducing MTMR3 expression through siRNA decreased PRR-induced cytokines (Fig. 2A), the increased MTMR3 expression in rs713875 C risk carriers is consistent with the increased PRR-induced cytokines observed in these cells. Of note, the rs713875 genotype did not regulate the expression of two other genes in the region, LIF or OSM (Fig. S2H). Taken together, the rs713875 risk genotype increases MTMR3 mRNA and protein expression, and MTMR3 increases PRR-induced cytokine secretion, thereby implicating MTMR3 in the regulation of PRR-induced cytokines in myeloid-derived cells from rs713875 carriers.
MTMR3 Is Required for Optimal PRR-Induced NFκB and PI3K Activation.
NOD2 stimulation activates the MAPK, NFκB, and PI3K pathways (11–15), and these pathways lead to cytokine secretion (15, 16). We therefore asked if these pathways were modulated by MTMR3. As expected, ERK, p38, and JNK were activated upon NOD2 stimulation (Fig. S4A). However, MTMR3 knockdown did not alter their activation (Fig. S4A). In contrast, MTMR3 knockdown significantly decreased NOD2-induced activation of the NFκB (Fig. S4B) and PI3K (Fig. S4C) pathways.
Fig. S4.

MTMR3 regulates PRR-induced NFκB and PI3K signaling. MDMs (n = 8) were transfected with scrambled or MTMR3 siRNA for 48 h and then treated with 100 μg/mL MDP for 15 min. (Left) Representative flow cytometry plots with MFI values for (A) phospho-ERK, phospho-p38, and phospho-JNK, (B) phospho-IκBα, and (C) phospho-Akt. (Right) Summarized data represented as the fold phosphoprotein induction normalized to untreated, scrambled siRNA-transfected cells + SEM. Similar results were observed for an additional n = 8. NS, not significant; scr, scrambled; tx, treatment; ††P < 1 × 10⁻⁵.
MTMR3 Inhibits PRR-Induced Autophagy.
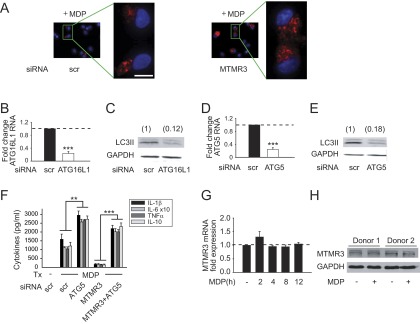
We next questioned the mechanisms through which MTMR3 regulates PRR-induced signaling and cytokines. MTMR3 has not been previously implicated in regulating cytokine secretion in general, and PRR-induced cytokine secretion in particular. MTMR3 inhibits constitutive autophagy in select cell lines (5–7). Autophagy can inhibit inflammasome activation, thereby decreasing IL-1β secretion (17–19). Whereas IL-1β can contribute to both apoptotic and nonapoptotic cell death (20), autocrine IL-1β secretion can also dramatically amplify PRR-induced secretion of additional cytokines in human MDMs (11, 15). Prior studies identified that NOD2 stimulation can contribute to autophagy (21–23). We therefore hypothesized that MTMR3 would regulate NOD2-induced autophagy. As expected, NOD2 stimulation induced autophagy in MDMs as assessed by LC3II up-regulation by Western blot (Fig. 3A); we previously ensured that NOD2-induced LC3II expression was due to increased autophagic flux (24). Upon MTMR3 knockdown, the baseline low level of LC3II expression was not altered, but NOD2-induced autophagy was increased relative to scrambled siRNA-transfected cells (Fig. 3A). We confirmed these results through an independent microscopic approach examining LC3 punctae (Fig. 3B and Fig. S5A for higher magnification). Therefore, MTMR3 inhibits NOD2-induced autophagy in human MDMs.
Fig. 3.
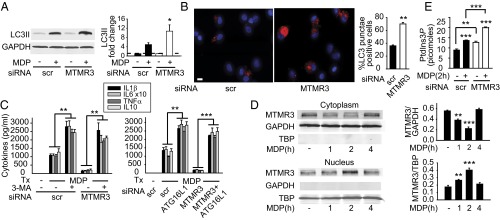
MTMR3 inhibits NOD2-induced autophagy. (A and B) MDMs were transfected with scrambled or MTMR3 siRNA for 48 h and then treated with 100 μg/mL MDP for 6 h. (A) Representative Western blot of LC3II expression and summarized densitometry of fold LC3II induction normalized to untreated, scrambled siRNA-transfected cells (represented by the dotted line at 1) + SEM (n = 10). (B) Cells were immunostained for LC3II (red) and nucleus (DAPI; blue). Representative image and summarized data (n = 6; 10 fields per donor), shown as the percent of LC3 punctae-positive cells + SEM. (Scale bar, 10 μm.) (C) MDMs (n = 4) were transfected with MTMR3 siRNA ± transfected with scrambled or ATG16L1 siRNA for 48 h or ± treated with 10 mM 3-MA for 1 h and then treated with 100 μg/mL MDP for 24 h. Cytokine secretion + SEM. Similar results were observed for an additional n = 6. (D) MDMs were treated with 100 μg/mL MDP for the indicated times. MTMR3 expression in the cytoplasm and nucleus by Western blot. Summarized data for MTMR3 expression normalized to the loading controls + SEM (n = 6). Loading controls included GAPDH for cytoplasm and TBP for nucleus. (E) MDMs (n = 4) were transfected with scrambled or MTMR3 siRNA for 48 h, then treated with 100 μg/mL MDP for 2 h. PtdIns3P levels + SEM. Similar results were observed in an additional n = 4. Scr, scrambled; tx, treatment. *P < 0.05; **P < 0.01; ***P < 0.001.
Fig. S5.
Attenuation of autophagy restores NOD2-induced cytokines in MTMR3-deficient MDMs. (A) MDMs from Fig. 3B that were immunostained for LC3II (red) and nucleus (DAPI; blue) are shown with higher magnification of the selected fields. (Scale bar, 10 μm.) (B–E) MDMs (n = 4) were transfected with scrambled, (B and C) ATG16L1, or (D and E) ATG5 siRNA for 48 h. (B and D) Fold change in mRNA expression compared with untreated, scrambled siRNA-transfected MDMs (represented by the dotted line at 1) + SEM. (C and E) Transfected MDMs were treated with 100 μg/mL MDP for 6 h, and LC3II expression was assessed by Western blot. Densitometry values are indicated above the bands. (F) MDMs (n = 4) were transfected with scrambled or MTMR3 siRNA, alone or in combination with scrambled or ATG5 siRNA for 48 h and then treated with 100 μg/mL MDP for 24 h. Shown is cytokine secretion + SEM. (G) MDMs (n = 4) were treated with 100 μg/mL MDP for the indicated times. Shown is fold change in MTMR3 mRNA expression compared with untreated cells (represented by the dotted line at 1) + SEM. (H) MDMs were treated with 100 μg/mL MDP for 24 h. Shown is MTMR3 expression as assessed by Western blot in MDMs from two of four donors. Scr, scrambled; tx, treatment **P < 0.01; ***P < 0.001.
We next questioned if the MTMR3-mediated regulation of NOD2-induced autophagy, in turn, regulates NOD2-induced cytokine secretion. We therefore inhibited the enhanced autophagy observed upon NOD2 stimulation in MTMR3-deficient cells through two independent approaches, pharmacological inhibition using 3-methyl adenine (3-MA) and siRNA to two separate autophagy-associated proteins, the Crohn’s disease-associated ATG16L1 (3) and ATG5. We confirmed that ATG16L1 (Fig. S5B) and ATG5 (Fig. S5D) knockdown resulted in decreased NOD2-induced autophagy (Fig. S5 C and E). Reducing autophagy through each of these approaches rescued NOD2-induced cytokines in MTMR3-deficient MDMs (Fig. 3C and Fig. S5F). Therefore, MTMR3 decreases NOD2-induced autophagy, which in turn increases NOD2-induced cytokine secretion.
Upon NOD2 stimulation, MTMR3 Relocalizes to the Nucleus, and PtdIns3P Levels Increase.
We next questioned how MTMR3 expression and localization is regulated during NOD2 stimulation in MDMs. Neither MTMR3 mRNA (Fig. S5G) nor protein (Fig. S5H) expression was altered upon NOD2 stimulation. Previous reports examining MTMR3 overexpression found MTMR3 distributed in the cytoplasm and reticular network in HeLa cells (5, 7). Given that MTMR3 inhibits autophagy, and yet autophagy increases with NOD2 stimulation, we hypothesized that MTMR3 might undergo cellular redistribution upon NOD2 stimulation. Endogenous MTMR3 was distributed predominantly in the cytoplasm of unstimulated human MDMs (Fig. 3D). However, upon NOD2 stimulation, MTMR3 transiently redistributed to the nucleus, with redistribution peaking 2 h after stimulation (Fig. 3D). Interestingly, Alfy, which enhances autophagy, demonstrates a reverse nuclear to autophagic membrane translocation (25). MTMR3 has been reported to dephosphorylate PtdIns3P, thereby reducing cellular PtdIns3P levels (4, 5). Local PtdIns3P levels are associated with autophagy initiation and maturation (26, 27). We therefore asked if NOD2-induced PtdIns3P levels were regulated in accordance with MTMR3 relocalization. PtdIns3P levels increased 2 h after NOD2 stimulation (Fig. 3E), consistent with the decreased cytoplasmic MTMR3 (Fig. 3D). Moreover, both baseline and NOD2-stimulated PtdIns3P levels were higher in MTMR3 knockdown relative to control knockdown macrophages (Fig. 3E). The degree of PtdIns3P modulation is consistent with that observed with the myotubularin MTMR1 (28). TLR4 and TLR9 stimulation also led to MTMR3 nuclear localization (Fig. S6A), and MTMR3-dependent attenuation of PtdIns3P (Fig. S6B) and autophagy (Fig. S6C). Taken together, MTMR3 regulates PtdIns3P levels, with the PRR-mediated increase of cytoplasmic PtdIns3P levels associated with a transient redistribution of MTMR3 from the cytoplasm to the nucleus, such that this redistribution may serve as a mechanism for regulating PtdIns3P and autophagy levels.
Fig. S6.
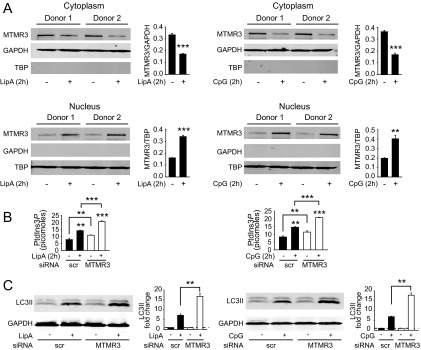
Upon TLR4 and TLR9 stimulation, MTMR3 translocates to the nucleus and is required for optimal PtdIns3P and autophagy induction. (A) MDMs were treated with 0.1 μg/mL lipid A or 0.1 μg/mL CpG for 2 h. Shown is MTMR3 expression in the cytoplasm and nucleus by Western blot, and summarized data are represented as MTMR3 expression compared with the loading control + SEM (n = 4). Loading controls included GAPDH for cytoplasm and TBP for nucleus. (B and C) MDMs were transfected with scrambled or MTMR3 siRNA and then treated with 0.1 μg/mg lipid A or 0.1 μg/mL CpG. (B) PtdIns3P levels are shown at 2 h with mean + SEM (n = 4). Significance comparisons are between untreated to PRR ligand-treated samples or as indicated. (C) Representative Western blot of LC3II expression and summarized densitometry represented as the fold LC3II induction normalized to untreated, scrambled siRNA-transfected cells (represented by the dotted line at 1) + SEM (n = 4). Scr, scrambled. **P < 0.01; ***P < 0.001.
MTMR3 Is Required Both for Optimal NOD2-Induced Caspase-1 Activation and Early Autocrine IL-1β Secretion and for IL-1R–Induced Signaling.
Autophagy can inversely regulate inflammasome activation (17–19); inflammasome activation, in turn, results in production of mature IL-1β, which is critical for NOD2-induced secretion of a broad range of cytokines (11, 15) (Fig. S7A). Therefore, we questioned if MTMR3 increases NOD2-induced caspase-1 activation. Upon MTMR3 knockdown in MDMs, NOD2-induced caspase-1 activation (Fig. 4A and Fig. S7B) and early IL-1β secretion (within 15 min) (Fig. 4B) was decreased; this early IL-1β secretion is caspase-1–dependent and transcriptionally independent (11, 29). Furthermore, consistent with IL-1R signaling through the IRAK-1-TRAF6 pathway common to PRRs and with MTMR3 regulation of cytokine induction upon stimulation of various PRRs (Fig. 1 and Fig. S3E), MTMR3 was required for optimal IL-1R–induced signaling (Fig. S7C) and cytokine secretion (Fig. 4C). Therefore, MTMR3 is required both for optimal NOD2-induced caspase-1 activation and early autocrine IL-1β secretion and for IL-1R–mediated responses to this autocrine IL-1β. Consistent with the requirement for MTMR3 in optimal IL-1R–induced signaling, supplementing NOD2-stimulated MTMR3-deficient MDMs with IL-1β was unable to fully restore cytokines (Fig. S7D). As NOD2-induced autocrine IL-1β was required for optimal NFκB activation (Fig. 4D) and MTMR3 was required for optimal NOD2-induced NFκB activation (Fig. S4B), we questioned if restoring NFκB activation in MTMR3-deficient MDMs (Fig. S7E) could restore NOD2-induced cytokines. We found this to be the case (Fig. 4E). Therefore, MTMR3 both increases NOD2-induced caspase-1 activation, which increases autocrine IL-1β secretion, and directly regulates IL-1R signaling; these combined effects increase NFκB signaling and amplify the secretion of additional cytokines.
Fig. S7.
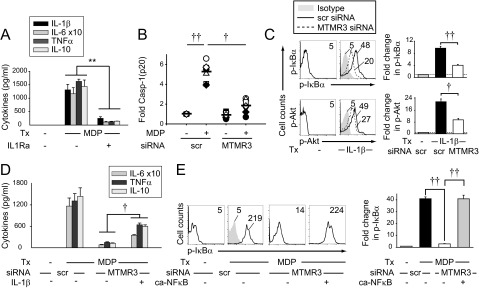
MTMR3 is required for optimal IL-1β–induced signaling. (A) MDMs (n = 8) were pretreated with 0.5 μg/mL IL1Ra for 1 h and then treated with 100 μg/mL MDP for 24 h. Shown is cytokine secretion + SEM. (B) MDP-treated MDMs from Fig. 4A are graphed with each symbol representing a donor to demonstrate interindividual variation. (C) MDMs (n = 4) were transfected with scrambled or MTMR3 siRNA and then treated with 10 ng/mL IL-1β for 15 min. (Left) Representative flow cytometry with MFI values shown. (Right) Summary phosphoprotein induction + SEM. (D) MDMs (n = 4) were transfected with scrambled or MTMR3 siRNA and then treated with 100 μg/mL MDP ± 10 ng/mL IL-1β for 24 h. Mean cytokine secretion + SEM. Similar results were observed for an additional n = 8. (E) MDMs (n = 8) were transfected with scrambled or MTMR3 siRNA, in combination with empty vector or IKK-2 S177D S181E (ca-NFκB, leading to constitutive activation of NFκB) for 24 h, and then treated with 100 μg/mL MDP for 15 min. (Left) Representative flow cytometry with MFI values shown. Isotype control (shaded histogram). (Right) Summary phospho-IκBα induction + SEM. Scr, scrambled; tx, treatment. **P < 0.01; ***P < 0.001; †P < 1 × 10⁻⁴; ††P < 1 × 10⁻⁵.
Fig. 4.
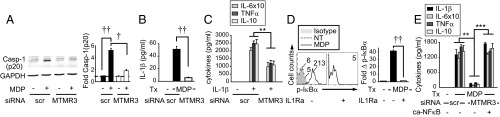
MTMR3 is required both for optimal NOD2-induced caspase-1 activation and early autocrine IL-1β secretion and for IL-1R-induced signaling. (A) MDMs were transfected with scrambled or MTMR3 siRNA, then treated with 100 μg/mL MDP for 6 h. Representative Western blot for active caspase-1 p20 expression and summarized data for fold caspase-1 normalized to untreated, scrambled siRNA-transfected cells (represented by the dotted line at 1) + SEM (n = 8). (B) MDMs (n = 4) were transfected with scrambled or MTMR3 siRNA, then pretreated with IL-1Ra (to block IL-1β consumption) and treated with 100 μg/mL MDP for 15 min. Early IL-1β secretion + SEM. (C) MDMs (n = 4) were transfected with scrambled or MTMR3 siRNA and then treated with 10 ng/mL IL-1β for 24 h. Cytokine secretion + SEM. (D) MDMs (n = 8) were pretreated with 0.5 μg/mL IL1Ra for 1 h and then treated with 100 μg/mL MDP for 15 min, and phospho-IκBα induction was assessed. Representative histogram with mean fluorescence intensity (MFI) values and summary of fold phospho-IκBα induction + SEM. (E) MDMs (n = 4) were transfected with scrambled or MTMR3 siRNA, along with empty vector or a vector expressing IKK-2 S177D S181E leading to constitutive NFκB activation (ca-NFκB) and then treated with 100 μg/mL MDP for 24 h. Cytokine secretion + SEM. Scr, scrambled; tx, treatment. **P < 0.01; ***P < 0.001; †P < 1 × 10⁻⁴; ††P < 1 × 10⁻⁵.
MTMR3 Modulation of PRR Outcomes Requires the PH-GRAM Domain and Catalytic C413 in the Phosphatase Domain of MTMR3.
We next sought to define structural requirements in MTMR3 for its regulation of PRR-induced outcomes. The N-terminal PH-GRAM domain (which can mediate binding to PtdIns3P) and the catalytic-regulating Cys413 within the phosphatase domain of MTMR3 are required for catalytic activity toward the PtdIns3P substrate and for inhibiting constitutive autophagy in cell lines (5, 7). To determine if these sites were required for regulating PtdIns3P levels and autophagy upon PRR stimulation in MDMs, we generated MTMR3 mutants with a PH-GRAM domain deletion (deletion amino acids 1–119) and a Cys413 replacement with serine (Fig. S8A). The three MTMR3 variants overexpressed to equivalent levels in MDMs (∼fourfold over endogenous MTMR3) (Fig. S8B); as expected, the PH-GRAM deletion showed a lower expressing band in addition to endogenous MTMR3 (Fig. S8B). WT MTMR3 overexpression in MDMs reduced NOD2-induced PtdIns3P levels (Fig. 5A) and autophagy (Fig. 5B), and increased NOD2-induced caspase-1 activation (Fig. 5C) and cytokine secretion (Fig. 5D). In contrast, the PH-GRAM deletion and C413S MTMR3 variants were impaired in these outcomes (Fig. 5). Similar to endogenous MTMR3, each of the MTMR3 variants underwent nuclear localization upon NOD2 stimulation (Fig. S8C). Therefore, through complementary knockdown and overexpression approaches, we establish a clear role for MTMR3 in modulating NOD2-induced PtdIns3P levels and autophagy, caspase-1 activation, and subsequent autocrine IL-1β–initiated signaling, which in turn regulate secretion of additional cytokines. We further define that each of these outcomes is dependent upon the PH-GRAM domain and Cys413 within the phosphatase domain of MTMR3.
Fig. S8.

Transfected MTMR3 constructs express MTMR3 to equivalent levels and can translocate to the nucleus with NOD2 stimulation. (A) Schematic of MTMR3 domains and location of the ΔPH-G (PH-GRAM deletion) and C413S (within the phosphatase domain [PTP]) mutants generated. (B and C) MDMs were transfected with 2 μg EV, MTMR3 (WT), MTMR3-ΔPH-G (ΔPH-G), MTMR3-C413S (C413S) for 24 h. (B) MTMR3 (#12443; Cell Signaling) expression by Western blot. The MTMR3-ΔPH-G (ΔPH-G) is running at a lower molecular weight, consistent with the deletion (estimated 115 kDa). Molecular weight marker positions are shown. A summary graph is shown for expression of the MTMR3 variant-transfected cells relative to EV-transfected cells for n = 4. (C) Transfected cells were treated with 100 μg/mL MDP for 2 h. Representative Western blots showing MTMR3 expression in the cytoplasm and nucleus. Separate gels were examined for loading controls, which included GAPDH for cytoplasm and TBP for nucleus. Summarized data are represented as MTMR3 expression compared with the loading control and normalized to EV-transfected cells + SEM (n = 4). Numbers above the bars are the expression of MDP-treated relative to untreated cells for each respective transfected condition. Densitometry for endogenous and transfected bands are combined in the summation. ***P < 0.001.
Fig. 5.

MTMR3 overexpression reduces NOD2-induced autophagy and increases NOD2-induced caspase-1 activation and subsequent cytokine secretion. (A–D) MDMs were transfected with HA-MTMR3 (WT), HA-MTMR3-ΔPH-G (Δ1–119 amino acids), HA-MTMR3-C413S, or empty vector (EV) for 24 h. (A–C) Transfected MDMs were treated with 100 μg/mL MDP and assessed for (A) PtdIns3P levels at 2 h + SEM (n = 4), or (B) LC3II and (C) active caspase-1 p20 expression by Western blot at 6 h. (Left) Representative Western blot. (Right) Summarized data of fold LC3II or caspase-1 p20 normalized to untreated, EV-transfected cells + SEM (n = 4). (D) Transfected MDMs were treated with 100 μg/mL MDP for 24 h. Cytokines + SEM (n = 4). ***P < 0.001; †P < 1 × 10⁻⁴; ††P < 1 × 10⁻⁵.
rs713875 risk C Allele in the MTMR3 Region Is Associated with Decreased NOD2-Induced PtdIns3P and Autophagy and Increased NOD2-Induced Caspase-1 Activation and Signaling.
Given the increased MTMR3 expression (Fig. 2) and increased PRR-induced cytokines (Fig. 1) in rs713875 C individuals, we next examined signaling regulation in these risk carriers. As MTMR3 regulates NOD2-induced NFκB and PI3K activation (Fig. S4), we examined these pathways. MDMs from rs713875 CC risk carriers demonstrated increased NOD2-induced NFκB and PI3K pathway activation relative to GG carriers (Fig. 6A); CG carriers were not significantly different from CC risk carriers (Fig. 6A), consistent with the cytokine outcomes in Fig. 1. Moreover, upon NOD2 stimulation, cells from rs713875 CC risk carriers had reduced cellular PtdIns3P levels (Fig. 6B) and autophagy (Fig. 6C) and increased caspase-1 activation (Fig. 6D) relative to GG carriers, in accordance with the increased cytokines in rs713875 CC MDMs (Fig. 1). Of note, MTMR3 was able to localize to the nucleus after NOD2 stimulation in both CC and GG carriers, albeit MTMR3 nuclear levels in CC carriers were higher, in accordance with overall higher cellular levels (Fig. S9).
Fig. 6.

Upon NOD2 stimulation, MDMs from rs713875 CC risk carriers demonstrate increased NFκB and PI3K pathway activation, reduced PtdIns3P and autophagy levels, and increased caspase-1 activation relative to GG carriers. (A) MDMs from rs713875 CC, CG, or GG carriers (n = 8 per genotype) were treated with 100 μg/mL MDP for 15 min. (Left) Representative flow cytometry of phosphoproteins with MFI values. (Right) Summarized data of fold increase in phosphoprotein relative to untreated samples + SEM. Similar results were observed for an additional n = 15 per genotype in CC and GG carriers. (B) MDMs from rs713875 CC or GG carriers (n = 24 per genotype) were treated with 100 μg/mL MDP for 2 h and assessed for PtdIns3P levels. (C and D) MDMs from rs713875 CC or GG carriers (n = 9 per genotype) were treated with 100 μg/mL MDP for 6 h and assessed by Western blot for (C) LC3II and (D) active caspase-1 p20 expression. Representative blots from n = 3 per genotype and summarized data (n = 9 per genotype) + SEM for LC3II or caspase-1 p20 expression normalized to GAPDH. *P < 0.05; **P < 0.01; ***P < 0.001; ††P < 1 × 10⁻⁵.
Fig. S9.

MTMR3 translocates to the nucleus upon NOD2 stimulation of MDMs from rs713875 CC and GG carriers. MDMs were treated with 100 μg/mL MDP for 2 h. Shown is MTMR3 expression in the cytoplasm and nucleus by Western blot stratified on rs713875 genotype. Loading controls included GAPDH for cytoplasm and TBP for nucleus. Summarized data are represented as MTMR3 expression normalized to the respective loading control + SEM (n = 8 per genotype). Statistical comparisons are between untreated and MDP-treated cells within same genotype (directly above bars) or as indicated. ***P < 0.001.
Discussion
In this study, we dissected a previously unidentified role for MTMR3 in PRR-induced outcomes and defined mechanisms through which the IBD-associated risk variant in the MTMR3 region modulates these outcomes. We found that MTMR3 increases PRR-induced signaling and cytokine secretion in human macrophages. We identified mechanisms for this PRR-mediated regulation; MTMR3 decreases PRR-induced PtdIns3P levels and autophagy, thereby increasing PRR-induced caspase-1 activation and autocrine IL-1β secretion, along with subsequent amplification of signaling and secretion of additional cytokines. The PH-GRAM domain and catalytic function of MTMR3 were required for these outcomes. Consistent with the roles that we define for MTMR3 in PRR-induced signaling, the enhanced MTMR3 expression in rs713875 IBD risk CC carriers is associated with decreased NOD2-induced cellular PtdIns3P levels and autophagy and increased PRR-induced caspase-1 activation, signaling, and cytokine secretion, thereby resulting in enhanced inflammatory outcomes (Fig. S10A).
Fig. S10.

A model for the role of MTMR3 in PRR-induced outcomes. (A) Upon PRR stimulation, MTMR3 dephosphorylates PtdIns3P, thereby decreasing cellular PtdIns3P levels, resulting in inhibition of PRR-induced autophagy. This is associated with increased PRR-induced caspase-1 activation and early IL-1β secretion, which in turn amplifies NFκB activation and secretion of additional cytokines. MTMR3 also directly regulates IL-1R–initiated signaling, consistent with the shared signaling pathways between PRRs and the IL-1R. MDMs from rs713875 CC disease risk carriers show increased MTMR3 expression, decreased PRR-induced PtdIns3P levels and autophagy, and increased NOD2-induced caspase-1 activation, signaling, and cytokine secretion. (B) MDMs (n = 8) were transfected with scrambled or MTMR3 siRNA and then treated with 10 ng/mL TNFα (GenScript), 10 ng/mL IL-12 (Peprotech), or 10 ng/mL IFNγ (GenScript) for 15 min. Phospho-IκBα and phospho-Akt induction was assessed by flow cytometry. Summary of fold phosphoprotein induction + SEM is shown. Scr, scrambled; tx, treatment. *P < 0.05; †P < 1 × 10⁻⁴; ††P < 1 × 10⁻⁵.
We have found that MTMR3 is required for both optimal NOD2-induced autocrine IL-1β secretion (through regulation of PRR-induced inflammasome activation) and optimal signaling through the IL-1R, highlighting multiple levels at which MTMR3 regulates PRR-induced cytokines. MTMR3 is also required for optimal signaling in response to TNFα, IL-12, and IFNγ treatment of MDMs (Fig. S10B), thereby implicating MTMR3 in modulating a range of cytokines and PRR ligands.
Loss-of-function IBD risk polymorphisms are observed in IRGM and ATG16L1 (2, 3), which are positive regulators of autophagy. Mice generated to express the ATG16L1 variant associated with Crohn’s disease demonstrate decreased autophagy and increased IL-1β production (30). We now identify a distinct mechanism for decreasing PRR-induced autophagy through the IBD-associated gain-of-function of an autophagy inhibitor, MTMR3. Autophagy is able to both increase bacterial clearance and decrease PRR-induced cytokine secretion in macrophages, two cellular outcomes that are critical to intestinal immune homeostasis. Intestinal macrophages, which have increased levels of autophagy relative to peripheral macrophages (24), similarly demonstrate improved bacterial clearance, despite a dramatic reduction in PRR-induced cytokines (31), thereby highlighting the importance of the dual regulation of these cellular processes in intestinal macrophages. Therefore, the reduced autophagy in MTMR3 IBD risk individuals may confer risk through the regulation of multiple downstream outcomes. Moreover, as PtdIns3P levels can contribute to membrane trafficking and various signaling protein outcomes, there are likely other cellular processes modulated in individuals with MTMR3 polymorphisms that contribute to both PRR-dependent and PRR-independent outcomes.
We have identified that polymorphisms in the MTMR3 region regulate outcomes across a broad range of PRRs in MDMs from IBD risk carriers. It is possible that in addition to MTMR3, rs713875 may regulate other genes in the region in distinct cell subsets and/or in additional functional outcomes. Our findings define a critical role for MTMR3 in processes crucial for intestinal immune homeostasis, including the regulation of PRR-initiated outcomes in human macrophages, and identify that in rs713875 MTMR3 IBD risk individuals, PRR-induced autophagy is decreased and inflammatory cytokines are increased, thereby highlighting that modulation of MTMR3 levels may provide a therapeutic benefit in intestinal inflammation and human IBD.
Materials and Methods
Patient Recruitment and Genotyping.
Informed consent was obtained per protocol approved by the institutional review board at Yale University. We recruited participants with no personal or family history of autoimmune/inflammatory disease, including psoriasis, systemic lupus erythematosus, rheumatoid arthritis, multiple sclerosis, type I diabetes mellitus, Crohn’s disease, and ulcerative colitis, or a history of HIV. Given the limitation in peripheral cell numbers and the range of innate responses we sought to examine, two separate cohorts of 100 and 98 individuals were recruited for NOD2/TLR2 dose–response studies in MDMs and PRR-induced cytokine studies in MDDCs, respectively. We performed genotyping by TaqMan (Applied Biosystems) or Sequenom platform (Sequenom, Inc.).
Myeloid Cell Isolation and Cell Culture.
Monocytes were purified from human peripheral blood mononuclear cells by positive CD14 selection (Miltenyi Biotec) or adhesion, tested for purity, and cultured with 10 ng/mL M-CSF (Shenandoah Biotechnology) (for MDMs) or 40 ng/mL GM-CSF and 40 ng/mL IL-4 (R&D Systems, Inc.) (for MDDCs), as in ref. 32. Cultured myeloid cells were treated with MDP (Bachem), lipid A (Peptides International), polyI:C, flagellin, CL097, or CpG DNA (Invivogen). In some cases, cells were treated with 3-methyladenine (3-MA) (Sigma-Aldrich) or IL1R antagonist (IL1Ra; Genscript). Supernatants were assayed for TNFα, IL-10 (BD Biosciences), IL-6, or IL-1β (eBioscience) by ELISA.
mRNA Expression Analysis.
RNA was isolated and reverse-transcribed, and quantitative PCR was performed with samples normalized to GAPDH, as per ref. 32. Primer sequences are available upon request.
Transfection of siRNAs and DNA Vectors.
Pooled siRNA containing four different siRNAs for each MTMR3 and ATG16L1 (SMARTpool, Dharmacon), scrambled siRNA (Dharmacon), or 2 μg HA-MTMR3 (generous gift of Michael J. Clague, University of Liverpool, Liverpool, UK, which was then subcloned into pcDNA.3), 2 μg IKK-2 S177D S181E [Addgene plasmid 11105; kindly deposited by Anjana Rao, La Jolla Institute for Allergy & Immunology, La Jolla, CA (33)] or empty vector, were transfected into MDMs using nucleofector kit (Amaxa). The HA-MTMR3 C413S mutant was generated through site-directed mutagenesis (QuikChange Lightning Kit; Agilent Technologies), and the N-terminal PH-GRAM deletion mutant was generated through PCR with deletion of the N-terminal 1–119 amino acids of WT HA-MTMR3 in pcDNA.3.
Protein Expression Analysis.
Western blot was performed using anti-LC3II (Cell Signaling), anti–caspase-1 p20 (Santa Cruz), or anti-MTMR3 (#12443; Cell Signaling), as per ref. 32. Nuclear/cytoplasmic isolations were performed per manufacturer instructions using the cell fractionation kit (Abcam) with MTMR3 (sc-47187; Santa Cruz) examined by Western blot. GAPDH (EMD Millipore) served as the loading control for cytoplasmic protein, and TATA-binding protein (TBP) (Cell Signaling) served as the control for nuclear protein. Phosphoproteins were determined using Alexa Fluor 647- or phycoerythrin-labeled antibodies to phospho-IκBα and phospho-Akt (Cell Signaling) by flow cytometry.
Microscopic Analysis.
MDMs were fixed in paraformaldehyde and then incubated with anti-LC3II (Cell Signaling), followed by Cy5-conjugated goat anti-rabbit IgG (Jackson Laboratories). Nuclei were stained with DAPI (Acros Organics). Fluorescence microscopy was conducted with the Zeiss Axio Observer microscope (Carl Zeiss Microscopy).
PtdIns3P Measurement.
PtdIns3P levels were quantified using a PtdIns3P mass assay kit per manufacturer’s protocol (Echelon Biosciences).
Statistical Analysis.
Significance was assessed using two-tailed Student t test. A Bonferroni correction was applied for multiple comparisons as appropriate. P < 0.05 was considered significant.
Acknowledgments
We thank Dr. Michael J. Clague for reagents. This work was supported by The Broad Foundation, the National Institutes of Health (DK099097, DK077905, DK062422, DK-P30-34989), and the Crohn’s and Colitis Foundation of America.
Footnotes
The authors declare no conflict of interest.
This article is a PNAS Direct Submission. D.A. is a guest editor invited by the Editorial Board.
This article contains supporting information online at www.pnas.org/lookup/suppl/doi:10.1073/pnas.1501752112/-/DCSupplemental.
References
- 1.Abraham C, Cho JH. Inflammatory bowel disease. N Engl J Med. 2009;361(21):2066–2078. doi: 10.1056/NEJMra0804647. [DOI] [PMC free article] [PubMed] [Google Scholar]
- 2.Jostins L, et al. Host-microbe interactions have shaped the genetic architecture of inflammatory bowel disease. Nature. 2012;491(7422):119–124. doi: 10.1038/nature11582. [DOI] [PMC free article] [PubMed] [Google Scholar]
- 3.Franke A, et al. Genome-wide meta-analysis increases to 71 the number of confirmed Crohn’s disease susceptibility loci. Nat Genet. 2010;42(12):1118–1125. doi: 10.1038/ng.717. [DOI] [PMC free article] [PubMed] [Google Scholar]
- 4.Robinson FL, Dixon JE. Myotubularin phosphatases: Policing 3-phosphoinositides. Trends Cell Biol. 2006;16(8):403–412. doi: 10.1016/j.tcb.2006.06.001. [DOI] [PubMed] [Google Scholar]
- 5.Walker DM, et al. Characterization of MTMR3. an inositol lipid 3-phosphatase with novel substrate specificity. Curr Biol. 2001;11(20):1600–1605. doi: 10.1016/s0960-9822(01)00501-2. [DOI] [PubMed] [Google Scholar]
- 6.Taguchi-Atarashi N, et al. Modulation of local PtdIns3P levels by the PI phosphatase MTMR3 regulates constitutive autophagy. Traffic. 2010;11(4):468–478. doi: 10.1111/j.1600-0854.2010.01034.x. [DOI] [PubMed] [Google Scholar]
- 7.Lorenzo O, Urbé S, Clague MJ. Analysis of phosphoinositide binding domain properties within the myotubularin-related protein MTMR3. J Cell Sci. 2005;118(Pt 9):2005–2012. doi: 10.1242/jcs.02325. [DOI] [PubMed] [Google Scholar]
- 8.Seok J, et al. Genomic responses in mouse models poorly mimic human inflammatory diseases. Proc Natl Acad Sci USA. 2013;110(9):3507–3512. doi: 10.1073/pnas.1222878110. [DOI] [PMC free article] [PubMed] [Google Scholar]
- 9.Abraham C, Medzhitov R. Interactions between the host innate immune system and microbes in inflammatory bowel disease. Gastroenterology. 2011;140(6):1729–1737. doi: 10.1053/j.gastro.2011.02.012. [DOI] [PMC free article] [PubMed] [Google Scholar]
- 10.Zhu M, Oishi K, Lee SC, Patterson PH. Studies using leukemia inhibitory factor (LIF) knockout mice and a LIF adenoviral vector demonstrate a key anti-inflammatory role for this cytokine in cutaneous inflammation. J Immunol. 2001;166(3):2049–2054. doi: 10.4049/jimmunol.166.3.2049. [DOI] [PubMed] [Google Scholar]
- 11.Hedl M, Abraham C. Distinct roles for Nod2 protein and autocrine interleukin-1beta in muramyl dipeptide-induced mitogen-activated protein kinase activation and cytokine secretion in human macrophages. J Biol Chem. 2011;286(30):26440–26449. doi: 10.1074/jbc.M111.237495. [DOI] [PMC free article] [PubMed] [Google Scholar]
- 12.Park JH, et al. RICK/RIP2 mediates innate immune responses induced through Nod1 and Nod2 but not TLRs. J Immunol. 2007;178(4):2380–2386. doi: 10.4049/jimmunol.178.4.2380. [DOI] [PubMed] [Google Scholar]
- 13.Yang Y, et al. NOD2 pathway activation by MDP or Mycobacterium tuberculosis infection involves the stable polyubiquitination of Rip2. J Biol Chem. 2007;282(50):36223–36229. doi: 10.1074/jbc.M703079200. [DOI] [PubMed] [Google Scholar]
- 14.Hedl M, Abraham C. IRF5 risk polymorphisms contribute to interindividual variance in pattern recognition receptor-mediated cytokine secretion in human monocyte-derived cells. J Immunol. 2012;188(11):5348–5356. doi: 10.4049/jimmunol.1103319. [DOI] [PMC free article] [PubMed] [Google Scholar]
- 15.Hedl M, Abraham C. Nod2-induced autocrine interleukin-1 alters signaling by ERK and p38 to differentially regulate secretion of inflammatory cytokines. Gastroenterology. 2012;143(6):1530–1543. doi: 10.1053/j.gastro.2012.08.048. [DOI] [PMC free article] [PubMed] [Google Scholar]
- 16.Hedl M, Abraham C. A TNFSF15 disease-risk polymorphism increases pattern-recognition receptor-induced signaling through caspase-8-induced IL-1. Proc Natl Acad Sci USA. 2014;111(37):13451–13456. doi: 10.1073/pnas.1404178111. [DOI] [PMC free article] [PubMed] [Google Scholar]
- 17.Saitoh T, et al. Loss of the autophagy protein Atg16L1 enhances endotoxin-induced IL-1beta production. Nature. 2008;456(7219):264–268. doi: 10.1038/nature07383. [DOI] [PubMed] [Google Scholar]
- 18.Nakahira K, et al. Autophagy proteins regulate innate immune responses by inhibiting the release of mitochondrial DNA mediated by the NALP3 inflammasome. Nat Immunol. 2011;12(3):222–230. doi: 10.1038/ni.1980. [DOI] [PMC free article] [PubMed] [Google Scholar]
- 19.Shi CS, et al. Activation of autophagy by inflammatory signals limits IL-1β production by targeting ubiquitinated inflammasomes for destruction. Nat Immunol. 2012;13(3):255–263. doi: 10.1038/ni.2215. [DOI] [PMC free article] [PubMed] [Google Scholar]
- 20.Miao EA, Rajan JV, Aderem A. Caspase-1-induced pyroptotic cell death. Immunol Rev. 2011;243(1):206–214. doi: 10.1111/j.1600-065X.2011.01044.x. [DOI] [PMC free article] [PubMed] [Google Scholar]
- 21.Cooney R, et al. NOD2 stimulation induces autophagy in dendritic cells influencing bacterial handling and antigen presentation. Nat Med. 2010;16(1):90–97. doi: 10.1038/nm.2069. [DOI] [PubMed] [Google Scholar]
- 22.Travassos LH, et al. Nod1 and Nod2 direct autophagy by recruiting ATG16L1 to the plasma membrane at the site of bacterial entry. Nat Immunol. 2010;11(1):55–62. doi: 10.1038/ni.1823. [DOI] [PubMed] [Google Scholar]
- 23.Homer CR, Richmond AL, Rebert NA, Achkar JP, McDonald C. ATG16L1 and NOD2 interact in an autophagy-dependent antibacterial pathway implicated in Crohn’s disease pathogenesis. Gastroenterology. 2010;139(5):1630–1641, 1641.e1–1641.e2. doi: 10.1053/j.gastro.2010.07.006. [DOI] [PMC free article] [PubMed] [Google Scholar]
- 24.Lahiri A, Abraham C. Activation of pattern recognition receptors up-regulates metallothioneins, thereby increasing intracellular accumulation of zinc, autophagy, and bacterial clearance by macrophages. Gastroenterology. 2014;147(4):835–846. doi: 10.1053/j.gastro.2014.06.024. [DOI] [PMC free article] [PubMed] [Google Scholar]
- 25.Simonsen A, et al. Alfy, a novel FYVE-domain-containing protein associated with protein granules and autophagic membranes. J Cell Sci. 2004;117(Pt 18):4239–4251. doi: 10.1242/jcs.01287. [DOI] [PubMed] [Google Scholar]
- 26.Vergne I, Deretic V. The role of PI3P phosphatases in the regulation of autophagy. FEBS Lett. 2010;584(7):1313–1318. doi: 10.1016/j.febslet.2010.02.054. [DOI] [PMC free article] [PubMed] [Google Scholar]
- 27.Dall’Armi C, Devereaux KA, Di Paolo G. The role of lipids in the control of autophagy. Curr Biol. 2013;23(1):R33–R45. doi: 10.1016/j.cub.2012.10.041. [DOI] [PMC free article] [PubMed] [Google Scholar]
- 28.Taylor GS, Maehama T, Dixon JE. Myotubularin, a protein tyrosine phosphatase mutated in myotubular myopathy, dephosphorylates the lipid second messenger, phosphatidylinositol 3-phosphate. Proc Natl Acad Sci USA. 2000;97(16):8910–8915. doi: 10.1073/pnas.160255697. [DOI] [PMC free article] [PubMed] [Google Scholar]
- 29.Hedl M, Abraham C. Secretory mediators regulate Nod2-induced tolerance in human macrophages. Gastroenterology. 2011;140(1):231–241. doi: 10.1053/j.gastro.2010.09.009. [DOI] [PMC free article] [PubMed] [Google Scholar]
- 30.Lassen KG, et al. Atg16L1 T300A variant decreases selective autophagy resulting in altered cytokine signaling and decreased antibacterial defense. Proc Natl Acad Sci USA. 2014;111(21):7741–7746. doi: 10.1073/pnas.1407001111. [DOI] [PMC free article] [PubMed] [Google Scholar]
- 31.Smythies LE, et al. Human intestinal macrophages display profound inflammatory anergy despite avid phagocytic and bacteriocidal activity. J Clin Invest. 2005;115(1):66–75. doi: 10.1172/JCI19229. [DOI] [PMC free article] [PubMed] [Google Scholar]
- 32.Hedl M, Li J, Cho JH, Abraham C. Chronic stimulation of Nod2 mediates tolerance to bacterial products. Proc Natl Acad Sci USA. 2007;104(49):19440–19445. doi: 10.1073/pnas.0706097104. [DOI] [PMC free article] [PubMed] [Google Scholar]
- 33.Mercurio F, et al. IKK-1 and IKK-2: Cytokine-activated IkappaB kinases essential for NF-kappaB activation. Science. 1997;278(5339):860–866. doi: 10.1126/science.278.5339.860. [DOI] [PubMed] [Google Scholar]