

Significance
Hepatitis C virus (HCV) infection stimulates the production of endogenous interferons (IFNs) and the following persistent activation of interferon-stimulated genes (ISGs) in the infected liver. In the patients with chronic HCV infection, high levels of activated ISGs in the liver at baseline were proved to predict poor response to pegylated IFN-α/ribavirin therapy. In this report, we demonstrate that the level of unphosphorylated IFN-stimulated gene factor 3 (U-ISGF3), not ISGF3, is increased by endogenous IFN-λs and IFN-β in HCV-infected hepatocytes and livers, leading to persistent activation of a set of ISGs. We also demonstrate that the high level of ISG15 induced by U-ISGF3 resulted in an increased level of ubiquitin-specific protease 18 (USP18), a critical negative regulator of the response to exogenous IFN-α.
Keywords: hepatitis C virus, U-ISGF3, interferon, interferon-stimulated genes
Abstract
Up-regulation of IFN-stimulated genes (ISGs) is sustained in hepatitis C virus (HCV)-infected livers. Here, we investigated the mechanism of prolonged ISG expression and its role in IFN responsiveness during HCV infection in relation to unphosphorylated IFN-stimulated gene factor 3 (U-ISGF3), recently identified as a tripartite transcription factor formed by high levels of IFN response factor 9 (IRF9), STAT1, and STAT2 without tyrosine phosphorylation of the STATs. The level of U-ISGF3, but not tyrosine phosphorylated STAT1, is significantly elevated in response to IFN-λ and IFN-β during chronic HCV infection. U-ISGF3 prolongs the expression of a subset of ISGs and restricts HCV chronic replication. However, paradoxically, high levels of U-ISGF3 also confer unresponsiveness to IFN-α therapy. As a mechanism of U-ISGF3–induced resistance to IFN-α, we found that ISG15, a U-ISGF3-induced protein, sustains the abundance of ubiquitin-specific protease 18 (USP18), a negative regulator of IFN signaling. Our data demonstrate that U-ISGF3 induced by IFN-λs and -β drives prolonged expression of a set of ISGs, leading to chronic activation of innate responses and conferring a lack of response to IFN-α in HCV-infected liver.
Hepatitis C virus (HCV) infection tends to progress to chronic hepatitis. Acute HCV infection is spontaneously cleared in 20–30% of patients, but the majority of patients fail to clear the virus and develop a chronic persistent infection (1). Type I IFN-based regimens have been the standard therapy against HCV. Type I IFNs are antiviral cytokines that induce the expression of numerous IFN-stimulated genes (ISGs), many of which exert antiviral activities and suppress viral replication (2).
Recently, it was demonstrated that type III IFNs, also known as IFN-λs (IFN-λ1 or IL-29; -λ2 or IL-28A; and -λ3 or IL-28B), are a major type of IFNs produced by HCV-infected hepatocytes (3–6). The production of type III IFNs by HCV-infected hepatocytes results in the expression of ISGs, presumably through autocrine and/or paracrine signaling via the IFN-λ receptor (4–6). Recent study using a highly sensitive in situ hybridization system revealed that ISG mRNAs are increased and enriched in HCV-infected and adjacent cells (7). This finding suggests that HCV infection potently stimulates the production of endogenous IFNs, leading to ISG up-regulation in infected livers (7, 8). Indeed, continuous ISG up-regulation in HCV-infected livers has been demonstrated in chimpanzee models (9, 10) and HCV-infected human livers (11, 12).
In patients with chronic HCV infection, it has been demonstrated that those with high levels of ISGs in the liver at baseline respond poorly to pegylated IFN-α (peg–IFN-α)/ribavirin therapy (11–16). In particular, the baseline levels of ISG15, IFI27, IFI44, Mx1, and OAS1 could predict a poor response to the peg–IFN-α/ribavirin therapy (11, 12, 16). In addition, ubiquitin-specific protease 18 (USP18), which can block tyrosine-phosphorylation of signal transducers and activators of transcriptions (STATs) (17), is up-regulated in HCV-infected livers, and its expression level is higher in patients who do not respond to peg–IFN-α/ribavirin therapy (12). However, how the level of USP18 is increased and maintained in HCV-infected livers has not been clearly elucidated.
Binding of type I IFNs to their receptor leads to the activation of the intracellular Janus kinases JAK1 and TYK2. Next, STATs 1 and 2 are phosphorylated on their C-terminal tyrosine residues, and PY-STAT1 and PY-STAT2 then form a tripartite transcription factor with IFN response factor 9 (IRF9). This transcription factor, IFN-stimulated gene factor 3 (ISGF3), induces the expression of hundreds of ISGs (18, 19). Type III IFNs activate the same JAK-STAT pathway (20), inducing similar sets of ISGs, although the kinetics and intensity of these responses may differ in human hepatocytes (21, 22).
After cells are stimulated by type I IFNs, ISGF3 induces the initial response, but the related factor unphosphorylated ISGF3 (U-ISGF3), formed by high levels of IRF9, unphosphorylated STAT1 (U-STAT1), and unphosphorylated STAT2 (U-STAT2), drives a second, delayed response, inducing a subset of downstream ISGs (23–25). In a previous report, we showed that continuous exposure of cells to a low level of exogenous IFN-β led to prolonged up-regulation of only the U-ISGF3–induced ISGs (U-ISGs) (24). The IFN-stimulated response element sequences of the U-ISGs were distinct from the sequences of the ISGs induced by phosphorylated ISGF3 but not by U-ISGF3 (24). However, it has not been proven whether IFN-λs also lead to induction of U-ISGF3 and U-ISGs.
In the present study, we investigated the mechanism of persistent expression of ISGs in HCV-infected cells and the mechanism of IFN-α unresponsiveness in relation to U-ISGF3, using in vitro HCV infection systems and HCV-infected human liver tissues. In summary, HCV-infected hepatocytes produced substantial amounts of IFN-λs and a small amount of IFN-β, and continuous stimulation of hepatocytes by these IFNs increased the levels of IRF9, STAT1, and STAT2 without tyrosine phosphorylation and prolonged the expression of U-ISGs, including ISG15. The high level of ISG15 induced by U-ISGF3 resulted in an increased level of USP18, a critical negative regulator of the response to exogenous IFN-α.
Results
Increased Expression of STAT1, STAT2, and IRF9 Without PY-STAT1 in Liver Tissues of Patients with Chronic HCV Infection.
First, we examined the expression of the U-ISGF3 components and U-ISGs in liver tissues from patients with chronic HCV infections. Using immunoblotting, higher levels of STAT1, STAT2, and IRF9 were observed in HCV-infected livers than in control livers whereas STAT1 phosphorylated on Y701 (PY-STAT1) was present at only low levels or not detected at all even after long exposure of immunoblots of HCV-infected livers (Fig. 1A). In contrast, the levels of STAT1, STAT2, and IRF9 were not increased in hepatitis B virus (HBV)-infected liver tissues (Fig. 1B). The expression of U-ISGs, such as Mx1, OAS1, and ISG15 (24), was up-regulated in HCV-infected livers (Fig. 1C) whereas the expression of MyD88, ADAR, and IRF1, ISGs known to be driven only by phosphorylated ISGF3 (24), was not increased in HCV-infected livers (Fig. 1D). Collectively, these data indicate that the levels of U-ISGF3 and U-ISGs are increased in HCV-infected livers.
Fig. 1.

Expression of U-ISGF3 components and U-ISGs in livers of patients with chronic HCV infection. (A and B) Immunoblotting of STAT1, PY-STAT1, STAT2, and IRF9 was performed with control livers without viral hepatitis (n = 4) and HCV-infected livers (n = 8) (A) or HBV-infected livers (n = 8) (B). As a positive control for PY-STAT1, Huh-7–TLR3 cells were treated with IFN-β for 30 min. The Upper blot of PY-STAT1 was obtained after exposure for the same time as the blot of STAT1, and the Lower blot of PY-STAT1 was obtained after much longer exposure to detect the minimal amount of PY-STAT1. (C and D) The expression of U-ISGs (C) and ISGs known to be regulated only by ISGF3 (D) was examined by TaqMan real-time quantitative PCR in control livers without viral hepatitis (n = 5) and HCV-infected livers (n = 8). The data represent the means ± SD, *P < 0.05 compared with control.
HCV Infection Increases the Levels of U-ISGF3 and U-ISGs.
We verified the results obtained for HCV-infected livers by studying primary human hepatocytes (PHHs) infected with cell culture-derived HCV (JFH1 HCVcc; genotype 2a). Highly permissive PHHs were selected and used for this experiment. As observed in HCV-infected livers, the levels of STAT1, STAT2, and IRF9 increased after HCV infection whereas PY-STAT1 was barely observable in HCV-infected cells (Fig. 2A). Moreover, U-ISGs were robustly increased in HCV-infected cells, including Mx1, OAS1, and OAS2 (Fig. 2B). By contrast, ISGF3-dependent ISGs were not induced (MyD88 and ADAR in Fig. 2C) or were minimally induced (IRF1 in Fig. 2C) in HCV-infected cells. These findings were also confirmed by HCVcc infection of Huh-7 cells transduced with the TLR3 gene (Huh-7–TLR3). The levels of STAT1, STAT2, and IRF9 increased since 48 h after HCV infection. In contrast, PY-STAT1 was observed only on the first day of HCV infection (Fig. 2D). U-ISGs (24) were robustly up-regulated in HCV-infected Huh-7–TLR3 cells. However, ISGs known to be induced only by phosphorylated ISGF3 (24) were barely increased (Fig. 2E) although all of the examined ISGs were up-regulated by exogenous IFN-β treatment (Fig. S1).
Fig. 2.

Expression of U-ISGF3 components and U-ISGs in HCV-infected PHHs and Huh-7–TLR3 cells. (A–C) PHHs were infected with JFH1 HCVcc [multiplicity of infection (MOI) = 2] and harvested 5 d later. Immunoblotting of STAT1, PY-STAT1, STAT2, IRF9, and HCV core was performed (A). As a positive control of PY-STAT1, HCV-infected cells were treated with IFN-β for 30 min. The expression of U-ISGs (B) and ISGs known to be regulated only by phosphorylated ISGF3 (C) was examined by TaqMan real-time quantitative PCR. (D) Huh-7–TLR3 cells were infected with JFH1 HCVcc (MOI = 10) and harvested at the indicated time. Immunoblotting of STAT1, PY-STAT1, STAT2, IRF9, and HCV core was performed. As a positive control of PY-STAT1, HCV-infected Huh-7–TLR3 cells were treated with IFN-β for 30 min. (E) Huh-7–TLR3 cells were infected with JFH1 HCVcc (MOI = 10) and harvested 5 d later. The expression of U-ISGs (Left) and ISGs known to be regulated only by ISGF3 (Right) were examined by TaqMan real-time quantitative PCR. Data are presented as a ratio of the mRNA level in HCV-infected cells to the mRNA level in uninfected cells. Bar graphs represent the means ± SEM (n = 3). *P < 0.05, **P < 0.01 compared with control.
Fig. S1.

Up-regulation of ISGs in HCV-infected Huh-7–TLR3 cells by exogenous IFN-β treatment. HCV-infected Huh-7–TLR3 cells were treated with IFN-β for 6 h, and real-time qPCR was performed to quantify Mx1, OAS-1, MyD88, and IRF1 mRNA levels. Bar graphs represent the means ± SEM (n = 3). **P < 0.01, ***P < 0.001 compared with control.
Detection of U-ISGF3 Components in the Nuclei of HCV-Infected Cells and Their Binding to the Promoter Regions of ISGs.
Cell lysates were fractionated into nuclei and cytoplasm after HCV infection. Increased levels of STAT1, STAT2, and IRF9 were observed in the nuclear fractions of HCV-infected cells whereas PY-STAT1 was not detected without exogenous IFN-β treatment (Fig. 3A). Immunohistochemical staining also showed nuclear enrichment of STAT1 in HCV-infected livers, but PY-STAT1 was barely detected in HCV-infected livers (Fig. 3B). Chromatin immunoprecipitation (ChIP) assays were performed using HCV-infected cells, and we found that all three components of U-ISGF3 bound to the promoter regions of U-ISGs, such as Mx1 and IFI27 (24), but not to those of MyD88 and IRF1, which are known to be regulated only by ISGF3 (24) (Fig. 3C). For positive controls, ChIP assays were performed using the PY-STAT1 antibody in IFN-β–treated, HCV-infected Huh-7–TLR3 cells (Fig. S2). ChIP assays were also performed using HCV-infected liver tissues (Fig. 3D). IRF9 bound to the promoter region of Mx1, but PY-STAT1 did not. In the case of MyD88, neither IRF9 nor PY-STAT1 bound to the promoter region in HCV-infected liver tissues. Collectively, these data suggest that U-ISGF3 is present in the nuclei and directly regulates the expression of U-ISGs in HCV-infected cells.
Fig. 3.

Role of U-ISGF3 components in the induction of U-ISGs in HCV-infected Huh-7–TLR3 cells. (A) Huh-7–TLR3 cells were infected with JFH1 HCVcc (MOI = 10) and harvested 5 d later. The cell lysates were fractionated into nuclei and cytoplasm, and immunoblotting of STAT1, PY-STAT1, STAT2, IRF9, and HCV core was performed. As a positive control for PY-STAT1, HCV-infected Huh-7–TLR3 cells were treated with IFN-β for 30 min. (B) Immunohistochemical staining of STAT1 and PY-STAT1 was performed in control and HCV-infected livers. (C) Huh-7–TLR3 cells were infected with JFH1 HCVcc (MOI = 10) and harvested 5 d later. Next, ChIP assays were performed to examine the binding of STAT1, STAT2, and IRF9 to the promoter regions of the ISGs such as MyD88, IRF1, Mx1, and IFI27. The reactions were performed in triplicate, and the means were normalized to 1% of the chromatin input. (D) HCV-infected livers were used for ChIP assays to examine the binding of PY-STAT1 and IRF9 to the promoter regions of the MyD88 and Mx1. Bar graphs represent the means ± SEM (n = 3). *P < 0.05 compared with control.
Fig. S2.
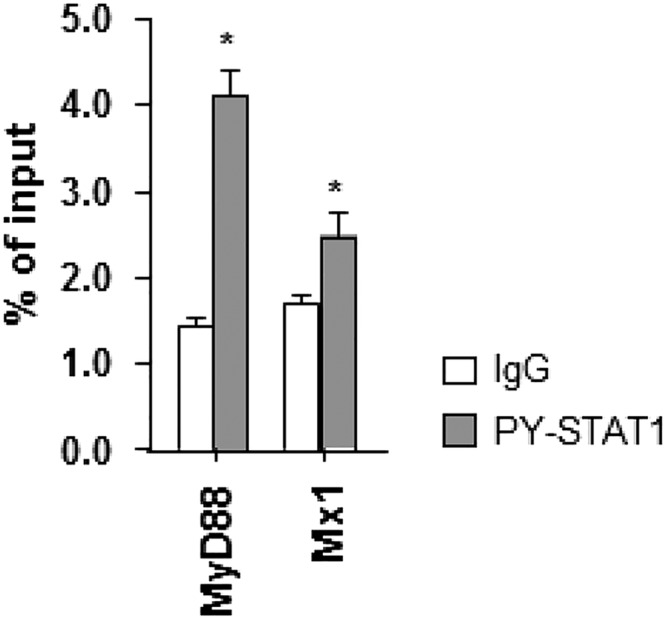
Binding of PY-STAT1 to the promoter of MyD88 and Mx1 4 h after IFN-β stimulation. HCV-infected Huh-7–TLR3 cells were treated with IFN-β for 4 h, and a ChIP assay was performed using anti-PY-STAT1 antibody. Bar graphs represent the means ± SEM (n = 3). *P < 0.05 compared with control.
Induction of U-ISGs by High Levels of STAT1, STAT2, and IRF9 Without IFN Stimulation.
Y701F-STAT1 is a mutant STAT1 that cannot be phosphorylated on Y701, blocking access of the WT STAT1 to the receptor (26). To clarify the mechanism of U-ISGF3 in the induction of U-ISGs, we overexpressed Y701F-STAT1, STAT2, and IRF9 in Huh-7.5 cells by lentiviral gene transduction without exogenous IFN treatment (Fig. 4A). Of note, Huh-7.5 cells express substantial levels of STAT1 and STAT2 but not IRF9 at baseline (Fig. 4A). The expression of U-ISGs was also examined. The expression of Mx1 and OAS1 was not increased by overexpression of Y701F-STAT1 and STAT2, but their expression was increased by overexpression of IRF9 (Fig. S3), which was anticipated because Huh-7.5 cells express a very low level of IRF9 (Fig. 4A). Moreover, combined high expression of IRF9, Y701F-STAT1, and STAT2 further increased the expression of Mx1 and OAS1 (Fig. S3).
Fig. 4.

Induction of U-ISGs by increased expression of U-STAT1, STAT2, and IRF9 without IFN stimulation. (A–C) Huh-7.5 cells were transduced with lentiviruses carrying pLV control vector or expression vectors for Y701F-STAT1, STAT2, or IRF9. Then, immunoblotting of STAT1, STAT2, and IRF9 was performed (A). As a positive control for PY-STAT1 in the immunoblotting analysis, the transduced cells were treated with IFN-β for 30 min. The expression of a set of U-ISGs (B) and a set of ISGF3-downstream genes (C) was examined by TaqMan real-time quantitative PCR. (D) Full-length H77 (HCV genotype 1a) replicon-harboring Huh-7.5 cells were transduced with lentiviruses carrying pLV control vector or expression vector for IRF9, Y701F-STAT1, or STAT2. Intracellular HCV RNA titer was quantified by TaqMan real-time PCR. Bar graphs represent the means ± SEM (n = 3). *P < 0.05, **P < 0.01 compared with control.
Fig. S3.

Induction of Mx1 and OAS1 by increased expression of U-STAT1, STAT2, and IRF9 without IFN stimulation. Huh-7.5 cells were transduced with lentiviruses carrying pLV control vector or expression vectors for Y701F-STAT1, STAT2, or IRF9. The expression of Mx1 and OAS1 was examined by TaqMan real-time quantitative PCR. Bar graphs represent the means ± SEM (n = 3). *P < 0.05, **P < 0.01 compared with control.
We further examined the expression of additional ISGs after overexpression of Y701F-STAT1, STAT2, and IRF9 together. U-ISGs (ISG15, BST2, and MAP3K) were up-regulated after overexpression of these proteins (Fig. 4B), but genes regulated only by phosphorylated ISGF3 (ADAR, PKR, and CXCL16) were not (Fig. 4C). Finally, we overexpressed Y701F-STAT1, STAT2, and IRF9 in HCV (genotype 1a) replicon cells and found that the overexpression of these proteins decreased the HCV RNA titer (Fig. 4D). Collectively, these data show that, in human liver-derived cells, high levels of the U-ISGF3 components induce the expression of U-ISGs, which exert antiviral functions, without exogenous IFN treatment.
Endogenous Type I and III IFNs Induce U-ISGF3 and U-ISGs in HCV-Infected Cells.
Next, we attempted to examine which IFNs induced U-ISGF3 in HCV-infected cells. We observed robust production of IFN-λs, rather than IFN-β, in HCV-infected PHHs (Fig. S4A) and HCV-infected Huh-7–TLR3 cells (Fig. S4B), confirming previous reports (3–6).
Fig. S4.

Induction of endogenous IFN-λs and IFN-β in HCV-infected primary human hepatocytes and Huh-7–TLR3 cells. (A) Primary human hepatocytes were infected with JFH1 HCVcc (MOI = 2) and harvested 5 d later. The expression of IFN-β, IFN-λ1, and IFN-λ2 was examined at the mRNA level by TaqMan real-time quantitative PCR and at the protein level by ELISA. (B) Huh-7–TLR3 cells were infected with JFH1 HCVcc (MOI = 10). The infected cells were harvested at the indicated time points, and the expression of IFN-β, IFN-λ1, and IFN-λ2 was examined at the mRNA level by TaqMan real-time quantitative PCR and at the protein level by ELISA. The data represent the means ± SEM (n = 3). *P < 0.05, **P < 0.01 compared with control.
We investigated whether IFN-λs also induced high levels of the U-ISGF3 components and prolonged expression of U-ISGs, similarly to IFN-β (24). We treated Huh-7.5 cells with recombinant IFN-β and IFN-λs for up to 72 h, finding that the levels of STAT1, STAT2, and IRF9 were increased not only by IFN-β (Fig. S5A), but also by IFN-λs (Fig. S5B). PY-STAT1 and PY-STAT2 disappeared 12 h after IFN treatment, but the levels of STAT1, STAT2, and IRF9 remained high even after 72 h. After IFN-β treatment, ISGs regulated by ISGF3 (MyD88 and IRF1) showed early induction without delayed response (Fig. S5C). In contrast, U-ISGs (Mx1 and OAS1) showed sustained responses after IFN-β treatment (Fig. S5C). Compared with IFN-β, the tyrosine phosphorylation of STAT1 and STAT2 induced by all three types of IFN-λs was relatively weak, but U-ISGF3 was robustly induced by IFN-λs (Fig. S5B). Accordingly, the expression of ISGF3-dependent ISGs was marginally induced, but the U-ISGs were robustly induced after IFN-λ treatment in a delayed manner (Fig. S5D). These data were corroborated in the experiment using other liver-derived cells including PHHs, differentiated HepaRG cells, and HepG2 cells (Fig. S6). These liver-derived cells expressed considerable levels of IFNAR1 and IFNLR1 mRNAs (Fig. S7).
Fig. S5.

Induction of U-ISGF3 and U-ISGs after treatment of IFN-β and IFN-λs in Huh-7.5 cells. (A–D) Huh-7.5 cells were treated with 3 ng/mL IFN-β (A and C) or 100 ng/mL the indicated IFN-λ (B and D) and harvested at the indicated time points. Immunoblotting of STAT1, PY-STAT1, STAT2, PY-STAT2, and IRF9 was performed (A and B), and the expression of ISGs was examined by TaqMan real-time quantitative PCR (C and D). The data represent the means ± SEM (n = 3). *P < 0.05, **P < 0.01 compared with control.
Fig. S6.

Induction of U-ISGF3 after treatment of IFN-β and IFN-λ1 in PHHs, differentiated HepaRG cells, and HepG2 cells. PHHs, differentiated HepaRG cells, and HepG2 cells were treated with 1 ng/mL IFN-β or 100 ng/mL IFN-λ1 and harvested at the indicated time points. Immunoblotting of STAT1, PY-STAT1, STAT2, PY-STAT2, and IRF9 was performed.
Fig. S7.

IFNAR1 and IFNLR1 mRNA expression in various liver-derived cells. Real-time qPCR was performed to measure the level of IFNAR1 and IFNLR1 mRNA. Bar graphs represent the means ± SEM (n = 3).
Ultimately, we blocked the effect of endogenous IFN-λs or IFN-β with neutralizing antibodies in cultures of HCV-infected Huh-7–TLR3 cells, finding that the induction of U-ISGF3 components was abrogated by either blocking antibody (Fig. 5A). In addition, the induction of U-ISGs, such as Mx1 and OAS1, was also abrogated by blocking antibodies to either IFN-λs or IFN-β (Fig. 5B). Intriguingly, IFN-β blockade also reduced the production of IFN-λs in cultures of HCV-infected Huh-7–TLR3 cells (Fig. 5 C and D), as reported previously (4). These results indicate that, in HCV-infected cells, the effect of IFN-β on the induction of U-ISGF3 is mediated at least in part through the production of IFN-λs. Collectively, these results show that endogenous IFN-λs and -β produced by HCV infection lead to increased levels of U-ISGF3 and the prolonged induction of U-ISGs in HCV-infected cells.
Fig. 5.

Role of endogenous IFN-λs and IFN-β in the induction of U-ISGF3 components and U-ISGs in HCV-infected Huh-7–TLR3 cells. (A–D) Huh-7–TLR3 cells were infected with JFH1 HCVcc (MOI = 5) and cultured for 2 d. Next, 2,000 IU/mL of IFN-β–blocking antibody, 20 μg/mL IFN-λ–blocking antibody, or control IgG was added to the culture, and the cells were further maintained for 3 d and harvested. Immunoblotting of STAT1, PY-STAT1, STAT2, IRF9, and HCV core was performed (A), and the expression of Mx1 and OAS1 was examined by TaqMan real-time quantitative PCR (B). The expression of IFN-λ1 and IFN-λ2 was examined at the mRNA level using TaqMan real-time quantitative PCR (C) and at the protein level by ELISA (D). The data represent the means ± SEM (n = 3). **P < 0.01 compared with control.
The Expression of ISG15 and USP18 Proteins Is Increased by Prolonged Exposure of Cells to Type III IFNs and in HCV-Infected Livers.
It has been reported that high basal levels of some ISGs, mostly known as U-ISGs, correlate with poor response to peg-IFN-α/ribavirin therapy (11–15). As a mechanism of the unresponsiveness to IFN-α, we further investigated ISG15, one of the U-ISGs. ISG15 was recently shown to regulate the stability of the USP18 protein by preventing its ubiquitination (27), and USP18 is a well-known negative regulator of IFN-α signaling. We hypothesized that prolonged stimulation with IFN-λ induces U-ISGF3 and U-ISGs, including ISG15, and that subsequent stabilization of USP18 by ISG15 confers lack of response to exogenous IFN-α. Indeed, prolonged exposure to IFN-λ3 induced high levels of the U-ISGF3 components, but IFN-λ3–pretreated cells showed much weaker phosphorylation of STAT1 after treatment with exogenous IFN-α or peg–IFN-α2b than did control cells (Fig. 6A). Accordingly, the increase in ISG expression was far less in response to peg–IFN-α2b in IFN-λ3–pretreated cells (Fig. 6B). However, attenuated responses in STAT1 phosphorylation and ISG induction were not observed after treatment with exogenous IFN-β or IFN-λ1 in IFN-λ3–pretreated cells (Fig. S8). We also investigated the expression of ISG15 and USP18. In line with our hypothesis, ISG15 protein and mRNA levels were both increased in IFN-λ3–treated cells, but USP18 was increased only at the protein level (Fig. 6 C and D). Moreover, silencing of ISG15 decreased the protein level of USP18 in IFN-λ3–treated cells (Fig. 6E). Immunoblotting of ISG15 and USP18 in extract of HCV-infected livers showed that both ISG15 and USP18 were increased in HCV-infected livers (Fig. 6 F and G) and that the level of ISG15 was correlated with the level of USP18 in HCV-infected livers (Fig. 6H). These data mean that ISG15, one of the U-ISGs, regulates USP18 at the protein level and is likely to mediate the lack of response to exogenous IFN-α in IFN-λ3–pretreated cells and HCV-infected livers.
Fig. 6.

Increased levels of ISG15 and USP18 in cells after prolonged stimulation with IFN-λ3 or in HCV-infected livers. (A and B) Huh-7.5 cells were treated with 10 ng/mL IFN-λ3 for 5 d and rested for 16 h. Then, 100 IU of IFN-α or peg–IFN-α2b was added. After 30 min, immunoblotting was performed for the detection of STAT1, PY-STAT1, STAT2, and IRF9 (A). After peg–IFN-α2b treatment for 6 or 24 h, the expression of ISGs was examined by TaqMan real-time quantitative PCR (B). (C and D) Huh-7.5 cells were treated with 10 ng/mL IFN-λ3 for 5 d and rested for 16 h. Immunoblotting of ISG15 and USP18 was performed (C), and the mRNA levels of ISG15 and USP18 were examined by TaqMan real-time quantitative PCR (D). (E) Huh-7.5 cells were treated with 10 ng/mL IFN-λ3. After 5 d, siRNAs targeting USP18 or ISG15 were introduced by transfection. Forty-eight hours after transfection, cells were harvested, and immunoblotting of ISG15 and USP18 was performed. (F–H) Immunoblotting of ISG15 and USP18 was performed in control livers without viral hepatitis (n = 4) and HCV-infected livers (n = 8). Bands for STAT1, ISG15 and USP18 are presented (F). The relative band intensities (% of actin) are presented as scatter plots (G). Correlation between the band intensities of ISG15 and those of USP18 is presented (H). The data represent the means ± SEM (n = 3). *P < 0.05, **P < 0.01 compared with control.
Fig. S8.

Differential responses to exogenous IFN-α, IFN-β, and IFN-λ1 in IFN-λ3–pretreated cells. Huh-7.5 cells were pretreated with IFN-λ3 for 5 d, and treated with IFN-α, IFN-β, and IFN-λ1. Immunoblotting was performed 30 min after IFN stimulation to evaluate the phosphorylation of STAT1 (A), and real-time qPCR was performed 6 h after IFN stimulation to measure the level of Mx1 mRNA (B). Bar graphs represent the means ± SEM (n = 3). *P < 0.5.
Restoration of Peg–IFN-α Responses by Silencing ISG15 and/or USP18 in Cells Treated with IFN-λ3 for a Long Time.
Finally, we performed knock-down experiments to confirm the role of ISG15 and USP18 in IFN-α unresponsiveness in cells after prolonged stimulation by IFN-λ3. In control siRNA-transfected, IFN-λ3–pretreated cells, the phosphorylation of STAT1 induced by peg–IFN-α2b was attenuated (Fig. 7A). However, STAT1 phosphorylation was restored by transfection of USP18 siRNA (Fig. 7A). Transfection of ISG15 siRNA resulted in a decreased level of USP18, and phosphorylation of STAT1 was also restored (Fig. 7A). Moreover, peg–IFN-α2b–induced ISG expression was partly restored by transfection of USP18 or ISG15 siRNA and was restored even more by transfection of USP18 and ISG15 siRNAs in combination (Fig. 7B).
Fig. 7.

Enhanced response to peg–IFN-α after silencing of USP18 and/or ISG15 expression in cells after prolonged stimulation with IFN-λ3. (A and B) Huh-7.5 cells were treated with 10 ng/mL IFN-λ3 for 5 d, and the indicated siRNAs were introduced by transfection. Forty eight hours after transfection, the cells were treated with 100 IU of peg–IFN-α2b for 30 min, and immunoblotting of STAT1, PY-STAT1, STAT2, IRF9, USP18, and ISG15 was performed (A). Twenty-four hours after transfection, cells were treated with 50 IU of peg–IFN-α2b for 6 h, and TaqMan real-time quantitative PCR for Mx1 and OAS1 was performed (B). The data represent the means ± SEM (n = 3). **P < 0.01 compared with control.
Discussion
Using an in vitro HCVcc infection system and HCV-infected human livers, we have demonstrated that HCV-infected hepatocytes produce type III and I IFNs and that prolonged stimulation by endogenous IFNs increases the expression levels of the three U-ISGF3 component proteins and the activity of U-ISGF3. U-ISGF3 itself can induce U-ISGs even without exogenous IFN stimulation in human liver-derived cells and can elicit cellular innate responses. Our data show that endogenous IFNs produced by virus-infected cells induce U-ISGF3 and the expression of U-ISGs. In addition, we demonstrate that IFN-λs also induce a high level of U-ISGF3 and up-regulate U-ISGs, similarly to IFN-β. Among the-U-ISGs, ISG15 increases the stability of USP18 protein and mediates a lack of response to IFN-α. Taken together, our findings on U-ISGF3 activity in HCV infection explain why ISG expression is sustained in HCV-infected livers and why high basal levels of ISGs in the liver correlate with poor responses to IFN-α–based therapy in HCV-infected patients.
Recently, the effects of peg–IFN-α administration on STAT phosphorylation and ISG expression were studied using paired liver biopsy samples from patients with chronic HCV infection (28). In that study, peg–IFN-α administration resulted in prolonged expression of a subset of ISGs in HCV-infected livers although STAT1 was only transiently phosphorylated (28). Those data indicate that U-ISGF3 might play important roles in inducing ISGs at late time in response to peg–IFN-α. However, a role for U-STAT1 was apparently ruled out by a simple transfection experiment in that study (28). The authors transfected WT or Y701F-STAT1 into STAT1-deficient U3A cells, which were derived from 2fTGH cells. The STAT1 protein levels were higher in the STAT1-transfected U3A cells, compared with endogenous STAT1 protein levels in parental 2fTGH cells, and the OAS1 expression in STAT1-transfected U3A cells was not higher than in 2fTGH cells. Based on these data, the authors concluded that U-STAT1 cannot induce ISGs (28). But U-STAT1 can induce a subset of ISGs only when the cells express sufficient levels of other two component proteins, STAT2 and IRF9 (24). In BJ fibroblasts that express high levels of STAT2 and IRF9, overexpression of STAT1 alone can induce U-ISGs (25). However, hTERT-HME1 cells, which express a very low basal level of IRF9 and STAT2, expressed U-ISGs only after transfection of both IRF9 and STAT2, not after transfection of STAT1 alone (24). The Huh-7.5 cells used in the current study express a very low basal level of IRF9 (Fig. 4A), so that the expression of Mx1 and OAS1 was increased by transfection of IRF9, and not by transfection of STAT1 (Fig. S3). Furthermore, the combined transfection of IRF9, Y701F-STAT1, and STAT2 together drove a more prominent increase in U-ISGs induction in Huh-7.5 cells (Fig. S3) and STAT1-null fibroblasts (24). These data indicate that all of the three components of U-ISGF3, rather than U-STAT1 alone, are required for the induction of U-ISGs. In addition, U3A cells were isolated after extensive chemical mutagenesis (29), and those cells surely harbor many unknown defects, as well as the lack of STAT1 expression. We observed that U3A cells have defects in inducing many ISGs in response to IFN-β and IFN-γ even after transfection with WT STAT1 (Fig. S9). We find that the previous conclusion by Dill et al. (28) from an experiment in which STAT1 was reexpressed in U3A cells cannot be used as an evidence to deny a role for U-ISGF3 in ISG induction.
Fig. S9.

Defects in inducing ISGs in U3A cells. U3A cells were transfected with WT STAT1, and treated with 50 IU/mL IFN-β for 4 h. Many representative ISGs, including IFIT3, Mx1, and Casp1, were not induced. These genes were significantly induced in IFN-β–treated primary STAT1-null fibroblasts (8) transfected with WT STAT1. UT, untreated cells. The data represent the means ± SEM (n = 3).
Some patients with chronic HCV infections express a high basal level of ISGs in their infected livers (11–13, 16) and respond poorly to peg–IFN-α/ribavirin therapy (11–16). In particular, the basal levels of ISG15, IFI27, IFI44, Mx1, and OAS1 could be used to predict a poor response to this therapy (11, 12, 16). Interestingly, these ISGs are known to be regulated by U-ISGF3 (24). Considering that the IFNs produced by HCV infection are mainly IFN-λs, which elicit a weak initial response through ISGF3 but a robust and prolonged response through U-ISGF3 (Fig. S5), persistent HCV infection results in U-ISGF3–mediated, prolonged expression of U-ISGs in infected and neighboring hepatocytes. Indeed, our analyses of HCV-infected liver tissues showed that PY-STAT1 was barely detected whereas the components of U-ISGF3 and U-ISGs were maintained at high levels.
In the last part of the present study, we investigated how U-ISGF3 results in the poor response to IFN-α treatment, finding that ISG15, one of the U-ISGs, is responsible. ISG15 stabilizes USP18 protein by preventing its ubiquitination (27), and USP18 blocks the phosphorylation of STAT1 and STAT2 at the level of the receptor–kinase complex (17, 30–33). Thus, ISG15 hampers the type I IFN response (27). In the current study, ISG15 was up-regulated in cells with prolonged IFN-λ3 stimulation (Fig. 6 C and D) or in HCV-infected livers (Figs. 1C and 6F) as a U-ISG (Fig. 4B). In the case of USP18, the protein level increased in cells upon prolonged IFN-λ3 stimulation (Fig. 6C) or in HCV-infected livers (Fig. 6F). Intriguingly, silencing of ISG15 expression decreased the protein level of USP18 in cells exposed to prolonged IFN-λ3 stimulation (Fig. 6E) and increased the response to peg–IFN-α (Fig. 7 A and B). Collectively, we showed that, in HCV-infected livers, the basal expression of U-ISGF3–dependent ISG15 is critical in regulating the subsequent IFN-α response by regulating the abundance of USP18 protein.
In conclusion, we demonstrate that the level of U-ISGF3 is increased by endogenous IFN-λs and IFN-β in HCV-infected hepatocytes and livers. The induced U-ISGF3 causes sustained expression of U-ISGs, contributing to a poor response to IFN-α–based therapy via increased expression of ISG15 and USP18.
Materials and Methods
Detailed materials and methods can be found in SI Materials and Methods. Huh-7–TLR3 cells were generated by transduction of Huh-7 cells with lentivirus harboring the pLenti-CMV-hTLR3 vector. The function of TLR3 protein in Huh-7–TLR3 cells was confirmed by the experiment demonstrating the ability to produce IFN-λ after poly I:C stimulation. Hepatitis virus-infected, nontumorous liver tissues were obtained from eight patients with HCV-associated hepatocellular carcinoma (HCC) and eight patients with HBV-associated HCC through the National Biobank of Korea [Pusan National University Hospital (PNUH), Busan, Korea]. Six liver tissues without viral hepatitis were also obtained during surgical procedures such as cholecystectomy, adrenalectomy, and partial liver resection for intrahepatic duct stones at Daejeon St. Mary’s Hospital (Daejeon, Korea). The procedure was permitted by the approval of the institutional review board of Daejeon St. Mary‘s Hospital and Korea Advanced Institute of Science and Technology and the agreement of the patients.
SI Materials and Methods
Cell Lines, Primary Human Hepatocytes, and Reagents.
Huh-7 cells, Huh-7.5 cells (Apath, LLC), HepG2 cells (KCLB), and 293TN cells were maintained at 37 °C with 5% (vol/vol) CO2 in Dulbecco’s modified Eagle medium (DMEM) supplemented with 10% (vol/vol) FBS (WelGENE), 4.5 g/L glucose, l-glutamine, and 1% (wt/vol) penicillin/streptomycin (Invitrogen). Huh-7–TLR3 cells and IRF9, Y701F-STAT1, and STAT2-transduced Huh-7.5 cells were maintained in complete DMEM supplemented with 1 μg/mL puromycin. Huh-7.5 cells harboring the full-length H77 (genotype 1a) replicon were maintained in complete DMEM supplemented with 1 g/L G418 (A.G. Scientific). HepaRG cells were differentiated and maintained as previously described (34). Primary human hepatocytes were purchased from Invitrogen and shipped frozen. After thawing, the cells were centrifuged at 150 × g for 5 min and incubated in 24-well plates overnight. Primary human hepatocytes were maintained in Williams E Medium containing cell maintenance supplement reagents from Invitrogen. Highly HCVcc-permissive primary human hepatocytes were selected and used for this study. SiRNAs against STAT1, STAT2, and IRF9 were obtained from Santa Cruz Biotechnology. All of the DNA transfections were performed using Turbofect (Thermo Scientific/Affinity BioReagents) via a forward transfection method for 293TN cells and a reverse transfection method for Huh-7 cells. SiRNA transfections were performed using lipofectamine RNAi MAX (Invitrogen). Recombinant human IFN-β was obtained from Peptrotech, peg–IFN-α2b was obtained from MSD, and recombinant human IFN-λs were obtained from R&D Systems. Neutralizing antibody against IFN-β was purchased from PBL Assay Science and used at a concentration of 2,000 IU/mL for 72 h. Neutralizing antibody for IFN-λ was purchased from R&D Systems. This antibody was originally targeted against IFN-λ1, but it also has complete neutralizing activity against IFN-λ3 and partial activity against IFN-λ2. This antibody was used at a concentration of 20 μg/mL, which is sufficient to neutralize all three IFN-λs. IL-28A, IL-29 ELISA kits were purchased from RayBiotech. An IFN-β ELISA kit was purchased from Fujirebio.
Generation and Infection of JFH-1 HCVcc.
The Japanese Fulminant Hepatitis-1 (JFH-1) strain (genotype 2a) of HCVcc was generated and propagated as previously described (35). Five percent (vol/vol) human serum-supplemented, high glucose DMEM was used to culture Huh-7.5 cells to produce highly infectious JFH1 HCVcc (36). For the titration of HCV infectivity, a colorimetric focus-forming assay was performed as previously described (35). Huh-7–TLR3 cells were infected with JFH-1 HCVcc at a multiplicity of infection (MOI) of 5–10.
Lentiviral Particle Generation and Gene Transduction.
Plasmids encoding CMV promoter-driven cDNA clones of human STAT1, STAT2, IRF9, and Y701F-STAT1 have been described previously (24). To produce lentiviruses, VSV-G plasmid, gag-pol plasmid, and plasmids containing ORF clones were cotransfected into 293TN cells using Turbofect reagent (Thermo). Seventy-two hours after transfection, the culture supernatant of transfected 293TN cells was harvested and passed through a 0.45-μM syringe filter. The filtered supernatant was more than 30-fold concentrated with WELPROT virus concentration reagent (WelGENE). Huh-7.5 cells were transduced with concentrated lentiviral particles in medium containing 8 μg/mL polybrene (Sigma-Aldrich). The transduced cells were selected in complete DMEM containing 1 μg/mL puromycin.
Liver Tissues.
Hepatitis virus-infected, nontumorous liver tissues were obtained from eight patients with HCV-associated hepatocellular carcinoma (HCC) and eight patients with HBV-associated HCC through the National Biobank of Korea (PNUH, Busan, Korea). During surgical resection of HCC, nontumorous tissues were obtained and frozen at −70 °C. A portion of the liver tissue was dissected, formalin-fixed, and paraffin-embedded for immunohistochemistry. The frozen tissues were lysed with radioimmunoprecipitation assay (RIPA) buffer for immunoblotting, or lysed with TRIzol reagent (Invitrogen) for total RNA extraction. Six liver tissues without viral hepatitis were also obtained during surgical procedures, such as cholecystectomy, adrenalectomy, and partial liver resection for intrahepatic duct stones at Daejeon St. Mary’s Hospital (Daejeon, Korea).
Paraffin-embedded tissues were used for immunohistochemistry to evaluate the expression of STAT1 and PY-STAT1. Mouse monoclonal anti-STAT1 (42/Stat1; BD Transduction Laboratories) and rabbit monoclonal anti-PY-STAT1 (58D6; Cell Signaling Technology) were used for immunohistochemistry.
Immunoblotting.
RIPA buffer was used to lyse cells and liver tissues. Subcellular fractionation into nuclear and cytoplasmic fractions was performed using the Subcellular Protein Fractionation Kit for Cultured Cells (Thermo). Ten micrograms of each cell lysate or nuclear/cytoplasmic lysate was loaded onto SDS/PAGE gels. For the lysis of human liver tissue, tissue homogenization preceded lysis using BioMasher (LMS). The antibodies used for immunoblotting were as follows: mouse monoclonal anti-STAT1 (42/Stat1; BD Transduction Laboratories), rabbit monoclonal anti-PY-STAT1 (58D6; Cell Signaling Technology), rabbit polyclonal anti-STAT2 (C-20; Santa Cruz Biotechnology), rabbit polyclonal anti-PY-STAT2 (Cell Signaling Technology), rabbit polyclonal anti-IRF9 (C-20; Santa Cruz Biotechnology), mouse monoclonal anti-ISG15 (3E5; Santa Cruz Biotechnology), rabbit monoclonal anti-USP18 (D4E7; Cell Signaling Technology), mouse monoclonal anti-HCV core (C7-50; Thermo), rabbit polyclonal anti-lamin A/C (Santa Cruz Biotechnology), mouse monoclonal anti-tubulin (B-5-1-2; Sigma-Aldrich), rabbit polyclonal anti-actin (Sigma-Aldrich), and horseradish peroxidase-conjugated secondary antibody (Jackson ImmunoResearch Laboratories). The detailed immunoblotting method has been described previously (37).
RNA Extraction, cDNA Synthesis, and Real-Time Quantitative PCR.
Total RNA isolation, cDNA synthesis, and TaqMan real-time quantitative PCR were performed as previously described (37). TaqMan Gene Expression Assays (Applied Biosystems) were used to determine the mRNA levels of the target genes. Quantification of intracellular HCV RNA copies was performed as previously described (37). When the expression of a gene was undetectable, a Ct value of 40 was assigned. The results were standardized to the mRNA level of β-actin, and the data are presented as the mean ± SEM.
ChIP Assay.
ChIP assays for cell lines were performed using a Pierce Agarose ChIP kit (Pierce), and ChIP assays for liver tissue were performed using a SimpleChIP Plus Enzymatic Chromatin IP Kit (Cell Signaling Technology) according to the manufacturers’ instructions. Briefly, whole-cell lysates from 0.5 × 10⁶ cells were immunoprecipitated using 2 μg of rabbit polyclonal anti-STAT1 (42/Stat1; BD Transduction Laboratories), rabbit polyclonal anti-STAT2 (C-20; Santa Cruz Biotechnology), rabbit polyclonal anti-IRF9 (C-20; Santa Cruz Biotechnology), or rabbit IgG. Real-time quantitative PCR using SYBR green master-mix (kappa) was used to amplify the promoter regions near the MyD88, IRF1, IFI27, and Mx1 genes. Sequences of the primer pairs have been described in a previous study (24). Reactions were performed in triplicate, and the means were normalized to 1% (vol/vol) of the chromatin input.
Statistical Analyses.
Data from experiments with cell lines and primary human hepatocytes are presented as the mean ± SEM. Data from human liver tissues are presented as the mean ± SD. Unpaired t tests or two-tailed Mann–Whitney U tests were performed for statistical analysis. All of the analyses were performed using GraphPad Prism version 5.01 (GraphPad Software). A P value of less than 0.05 was considered to be statistically significant.
Acknowledgments
We thank the members of the Hyehwa Forum for helpful and stimulating discussion. This work was supported by a grant from the Korean Health Technology R&D Project, Ministry of Health and Welfare, Republic of Korea (HI13C1263). This work was also supported by National Research Foundation Grants NRF-2012-M3C1A1-048860 and NRF-2014R1A2A1A10053662 and by the Korea Advanced Institute of Science and Technology Future Systems Healthcare Project, which is funded by the Ministry of Science, Information/CommunicationTechnology (ICT), and Future Planning of Korea. P.S.S. is supported by the project of Global PhD Fellowship NRF-2012H1A2A1012809 through the National Research Foundation of Korea funded by the Ministry of Science, ICT, and Future Planning of Korea.
Footnotes
The authors declare no conflict of interest.
This article contains supporting information online at www.pnas.org/lookup/suppl/doi:10.1073/pnas.1513341112/-/DCSupplemental.
References
- 1.Jeong SW, Jang JY, Chung RT. Hepatitis C virus and hepatocarcinogenesis. Clin Mol Hepatol. 2012;18(4):347–356. doi: 10.3350/cmh.2012.18.4.347. [DOI] [PMC free article] [PubMed] [Google Scholar]
- 2.Horner SM, Gale M., Jr Regulation of hepatic innate immunity by hepatitis C virus. Nat Med. 2013;19(7):879–888. doi: 10.1038/nm.3253. [DOI] [PMC free article] [PubMed] [Google Scholar]
- 3.Marukian S, et al. Hepatitis C virus induces interferon-λ and interferon-stimulated genes in primary liver cultures. Hepatology. 2011;54(6):1913–1923. doi: 10.1002/hep.24580. [DOI] [PMC free article] [PubMed] [Google Scholar]
- 4.Park H, et al. IL-29 is the dominant type III interferon produced by hepatocytes during acute hepatitis C virus infection. Hepatology. 2012;56(6):2060–2070. doi: 10.1002/hep.25897. [DOI] [PMC free article] [PubMed] [Google Scholar]
- 5.Thomas E, et al. HCV infection induces a unique hepatic innate immune response associated with robust production of type III interferons. Gastroenterology. 2012;142(4):978–988. doi: 10.1053/j.gastro.2011.12.055. [DOI] [PMC free article] [PubMed] [Google Scholar]
- 6.Israelow B, Narbus CM, Sourisseau M, Evans MJ. HepG2 cells mount an effective antiviral interferon-lambda based innate immune response to hepatitis C virus infection. Hepatology. 2014;60(4):1170–1179. doi: 10.1002/hep.27227. [DOI] [PMC free article] [PubMed] [Google Scholar]
- 7.Wieland S, et al. Simultaneous detection of hepatitis C virus and interferon stimulated gene expression in infected human liver. Hepatology. 2014;59(6):2121–2130. doi: 10.1002/hep.26770. [DOI] [PMC free article] [PubMed] [Google Scholar]
- 8.Park SH, Rehermann B. Immune responses to HCV and other hepatitis viruses. Immunity. 2014;40(1):13–24. doi: 10.1016/j.immuni.2013.12.010. [DOI] [PMC free article] [PubMed] [Google Scholar]
- 9.Su AI, et al. Genomic analysis of the host response to hepatitis C virus infection. Proc Natl Acad Sci USA. 2002;99(24):15669–15674. doi: 10.1073/pnas.202608199. [DOI] [PMC free article] [PubMed] [Google Scholar]
- 10.Wieland SF, Chisari FV. Stealth and cunning: Hepatitis B and hepatitis C viruses. J Virol. 2005;79(15):9369–9380. doi: 10.1128/JVI.79.15.9369-9380.2005. [DOI] [PMC free article] [PubMed] [Google Scholar]
- 11.Dill MT, et al. Interferon-induced gene expression is a stronger predictor of treatment response than IL28B genotype in patients with hepatitis C. Gastroenterology. 2011;140(3):1021–1031. doi: 10.1053/j.gastro.2010.11.039. [DOI] [PubMed] [Google Scholar]
- 12.Sarasin-Filipowicz M, et al. Interferon signaling and treatment outcome in chronic hepatitis C. Proc Natl Acad Sci USA. 2008;105(19):7034–7039. doi: 10.1073/pnas.0707882105. [DOI] [PMC free article] [PubMed] [Google Scholar]
- 13.Chen L, et al. Cell-type specific gene expression signature in liver underlies response to interferon therapy in chronic hepatitis C infection. Gastroenterology. 2010;138(3):1123–33.e1-3. doi: 10.1053/j.gastro.2009.10.046. [DOI] [PubMed] [Google Scholar]
- 14.Feld JJ, et al. Hepatic gene expression during treatment with peginterferon and ribavirin: Identifying molecular pathways for treatment response. Hepatology. 2007;46(5):1548–1563. doi: 10.1002/hep.21853. [DOI] [PMC free article] [PubMed] [Google Scholar]
- 15.Honda M, et al. Hokuriku Liver Study Group Hepatic ISG expression is associated with genetic variation in interleukin 28B and the outcome of IFN therapy for chronic hepatitis C. Gastroenterology. 2010;139(2):499–509. doi: 10.1053/j.gastro.2010.04.049. [DOI] [PubMed] [Google Scholar]
- 16.Broering R, et al. The interferon stimulated gene 15 functions as a proviral factor for the hepatitis C virus and as a regulator of the IFN response. Gut. 2010;59(8):1111–1119. doi: 10.1136/gut.2009.195545. [DOI] [PubMed] [Google Scholar]
- 17.Francois-Newton V, Livingstone M, Payelle-Brogard B, Uzé G, Pellegrini S. USP18 establishes the transcriptional and anti-proliferative interferon α/β differential. Biochem J. 2012;446(3):509–516. doi: 10.1042/BJ20120541. [DOI] [PubMed] [Google Scholar]
- 18.Darnell JE, Jr, Kerr IM, Stark GR. Jak-STAT pathways and transcriptional activation in response to IFNs and other extracellular signaling proteins. Science. 1994;264(5164):1415–1421. doi: 10.1126/science.8197455. [DOI] [PubMed] [Google Scholar]
- 19.Stark GR, Darnell JE., Jr The JAK-STAT pathway at twenty. Immunity. 2012;36(4):503–514. doi: 10.1016/j.immuni.2012.03.013. [DOI] [PMC free article] [PubMed] [Google Scholar]
- 20.Doyle SE, et al. Interleukin-29 uses a type 1 interferon-like program to promote antiviral responses in human hepatocytes. Hepatology. 2006;44(4):896–906. doi: 10.1002/hep.21312. [DOI] [PubMed] [Google Scholar]
- 21.Bolen CR, Ding S, Robek MD, Kleinstein SH. Dynamic expression profiling of type I and type III interferon-stimulated hepatocytes reveals a stable hierarchy of gene expression. Hepatology. 2014;59(4):1262–1272. doi: 10.1002/hep.26657. [DOI] [PMC free article] [PubMed] [Google Scholar]
- 22.Jilg N, et al. Kinetic differences in the induction of interferon stimulated genes by interferon-α and interleukin 28B are altered by infection with hepatitis C virus. Hepatology. 2014;59(4):1250–1261. doi: 10.1002/hep.26653. [DOI] [PMC free article] [PubMed] [Google Scholar]
- 23.Cheon H, Borden EC, Stark GR. Interferons and their stimulated genes in the tumor microenvironment. Semin Oncol. 2014;41(2):156–173. doi: 10.1053/j.seminoncol.2014.02.002. [DOI] [PMC free article] [PubMed] [Google Scholar]
- 24.Cheon H, et al. IFNβ-dependent increases in STAT1, STAT2, and IRF9 mediate resistance to viruses and DNA damage. EMBO J. 2013;32(20):2751–2763. doi: 10.1038/emboj.2013.203. [DOI] [PMC free article] [PubMed] [Google Scholar]
- 25.Cheon H, Stark GR. Unphosphorylated STAT1 prolongs the expression of interferon-induced immune regulatory genes. Proc Natl Acad Sci USA. 2009;106(23):9373–9378. doi: 10.1073/pnas.0903487106. [DOI] [PMC free article] [PubMed] [Google Scholar]
- 26.Chatterjee-Kishore M, Wright KL, Ting JP, Stark GR. How Stat1 mediates constitutive gene expression: A complex of unphosphorylated Stat1 and IRF1 supports transcription of the LMP2 gene. EMBO J. 2000;19(15):4111–4122. doi: 10.1093/emboj/19.15.4111. [DOI] [PMC free article] [PubMed] [Google Scholar]
- 27.Zhang X, et al. Human intracellular ISG15 prevents interferon-α/β over-amplification and auto-inflammation. Nature. 2015;517(7532):89–93. doi: 10.1038/nature13801. [DOI] [PMC free article] [PubMed] [Google Scholar]
- 28.Dill MT, et al. Pegylated IFN-α regulates hepatic gene expression through transient Jak/STAT activation. J Clin Invest. 2014;124(4):1568–1581. doi: 10.1172/JCI70408. [DOI] [PMC free article] [PubMed] [Google Scholar]
- 29.McKendry R, et al. High-frequency mutagenesis of human cells and characterization of a mutant unresponsive to both alpha and gamma interferons. Proc Natl Acad Sci USA. 1991;88(24):11455–11459. doi: 10.1073/pnas.88.24.11455. [DOI] [PMC free article] [PubMed] [Google Scholar]
- 30.Malakhova OA, et al. Protein ISGylation modulates the JAK-STAT signaling pathway. Genes Dev. 2003;17(4):455–460. doi: 10.1101/gad.1056303. [DOI] [PMC free article] [PubMed] [Google Scholar]
- 31.Randall G, et al. Silencing of USP18 potentiates the antiviral activity of interferon against hepatitis C virus infection. Gastroenterology. 2006;131(5):1584–1591. doi: 10.1053/j.gastro.2006.08.043. [DOI] [PubMed] [Google Scholar]
- 32.Sarasin-Filipowicz M, et al. Alpha interferon induces long-lasting refractoriness of JAK-STAT signaling in the mouse liver through induction of USP18/UBP43. Mol Cell Biol. 2009;29(17):4841–4851. doi: 10.1128/MCB.00224-09. [DOI] [PMC free article] [PubMed] [Google Scholar]
- 33.Makowska Z, Duong FH, Trincucci G, Tough DF, Heim MH. Interferon-β and interferon-λ signaling is not affected by interferon-induced refractoriness to interferon-α in vivo. Hepatology. 2011;53(4):1154–1163. doi: 10.1002/hep.24189. [DOI] [PubMed] [Google Scholar]
- 34.Gripon P, et al. Infection of a human hepatoma cell line by hepatitis B virus. Proc Natl Acad Sci USA. 2002;99(24):15655–15660. doi: 10.1073/pnas.232137699. [DOI] [PMC free article] [PubMed] [Google Scholar]
- 35.Kang W, Shin EC. Colorimetric focus-forming assay with automated focus counting by image analysis for quantification of infectious hepatitis C virions. PLoS One. 2012;7(8):e43960. doi: 10.1371/journal.pone.0043960. [DOI] [PMC free article] [PubMed] [Google Scholar]
- 36.Steenbergen RH, et al. Human serum leads to differentiation of human hepatoma cells, restoration of very-low-density lipoprotein secretion, and a 1000-fold increase in HCV Japanese fulminant hepatitis type 1 titers. Hepatology. 2013;58(6):1907–1917. doi: 10.1002/hep.26566. [DOI] [PubMed] [Google Scholar]
- 37.Sung PS, et al. Hepatitis C virus entry is impaired by claudin-1 downregulation in diacylglycerol acyltransferase-1-deficient cells. J Virol. 2014;88(16):9233–9244. doi: 10.1128/JVI.01428-14. [DOI] [PMC free article] [PubMed] [Google Scholar]