Abstract
Fluorescent and plasmonic labels and sensors have revolutionized molecular biology, helping visualize in vitro cellular and biomolecular processes1–3. Increasingly, such probes are now designed to respond to wavelengths in the near infrared region, where reduced tissue autofluorescence and photon attenuation enable subsurface in vivo sensing4. But even in the near infrared, optical resolution and sensitivity decrease rapidly with increasing depth. Here we present a sensor design that obviates the need for optical addressability by operating in the NMR radio-frequency (RF) spectrum, where signal attenuation and distortion by tissue and biological media are negligible, where background interferences vanish, and where sensors can be spatially located using standard magnetic resonance imaging (MRI) equipment. The RF-addressable sensor assemblies presented here are comprised of pairs of magnetic disks spaced by swellable hydrogel material; they reversibly reconfigure in rapid response to chosen stimuli, to give geometry-dependent, dynamic NMR spectral signatures. Sensors can be made from biocompatible materials, are detectable down to low concentrations, and offer potential responsive NMR spectral shifts approaching a million times those of traditional magnetic resonance spectroscopies. Inherent adaptability should allow such shape-changing systems to measure numerous different environmental and physiological indicators, affording broadly generalizable, MRI-compatible, RF analogues to optically-based probes for use in basic chemical, biological and medical research.
Despite growing interest, MRI-based biosensing remains comparatively limited. Magnetic resonance spectroscopy can detect certain commonly occurring biomolecules but low sensitivity precludes high-resolution imaging of these and of many other potential biomarkers. Responsive MRI contrast agents5 offer alternatives but their reliance on changes in image contrast, or relaxivity, complicates quantification. Signal intensities vary for many reasons, including variation in contrast agent concentrations rather than in the biomarkers themselves. Using multiple agents enables ratiometric correction, but requires identical agent pharmacokinetics to avoid artifacts6. Potentially quantitative hyperpolarized agents7 and (paramagnetic) chemical exchange saturation transfer ((PARA)CEST) agents8 that provide inherently ratiometric signals9 have also been demonstrated, but they typically require continual agent replenishment and high, millimolar concentrations, respectively. By comparison, many potential biomarkers, including many proteins, occur at micro- to femtomolar levels. With rare exception, existing agents also lack multiplexing capabilities that could allow multi-variable measurements to better differentiate environmental conditions or medical pathologies and hasten early disease detection.
A first step towards multiplexable, high-sensitivity RF sensors can be leveraged from recently developed microengineered multispectral MRI contrast agents10–14. Whereas conventional T1 and T2 contrast agents modify NMR relaxivities, microengineered multispectral agents employ specially shaped magnetizable micro- or nanostructures to controllably shift NMR frequencies. Different structure shapes generate different local magnetic fields and associated NMR frequency shifts, enabling differently “coloured” RF tags for multiplexed labeling analogous to that of optical tags. With their NMR frequencies geometrically determined, such multispectral tags can be transformed into RF “colourimetric” sensors by incorporating flexible sensor elements that modify tag geometries in response to the environment. Stimuli-responsive hydrogels are one possibility15. They offer reversible, tunable, swelling that can be specifically sensitized to numerous biomolecules and environmental conditions. Redesigned around such gels, the resulting tags’ dynamically reconfiguring magnetic elements can transduce responsive hydrogel swellings into quantitative, NMR-readable, spectral shifts. This letter introduces these new Geometrically Encoded Magnetic (GEM) sensors by demonstrating: (i) pH measurement, (ii) spatiotemporal mapping of ion concentration gradients, (iii) real-time tracking of cell metabolism, and (iv) co-localized sensing through spectrally separable sensors that would otherwise be unresolvable. While this reflects a limited set of examples, the ability to tailor gel responsiveness to different targets suggests that the same sensor modality can support RF monitoring of many different biomarkers and physiological or environmental processes.
Localized pH sensing, in particular, can help indicate various pathologies including inflammation, ischemia and cancer. Although not yet realized for clinical MRI, the biomedical significance of pH monitoring already motivates considerable research including MRI spectroscopies (1H, 19F, and 31P)16–18 and CEST agents9,19, hyperpolarized substrates20,21, abd pH-dependent relaxation6. All show promise, but can suffer from limited sensitivity, short agent lifetimes, or a need for multi-agent ratiometric concentration normalization, respectively. Shape-changing GEM sensors, on the other hand, are not fundamentally lifetime limited, offer high sensitivities (detailed below) and, unlike many MRI agents, do not rely on signal amplitude variations, providing instead concentration-independent frequency readouts for more precise, unambiguous quantitation.
The sensor design builds on a multispectral MRI agent geometry comprising spaced, magnetizable disk pairs that, due to their magnetic shape anisotropy, automatically align themselves with applied magnetic fields10 (see Figs 1a and 1b). When magnetically saturated in the field of an NMR/MRI, such self-aligning assemblies generate tailorable, homogeneous, offset magnetic fields between the disks. NMR frequencies of water self-diffusing through these homogeneous field regions are then shifted proportionally to the offset field magnitude. Examples of such field-shifted, or spectrally offset, NMR signals are shown in Fig. 1c through histograms of calculated magnetic fields, which closely mimic NMR spectra, in the vicinity of such magnetic structures. The spectral offsets, ωoffset, define the structures’ NMR frequencies, or effective RF colours, and are tunable by changing structure shapes and materials according to10:
| (1) |
Here h, r, and d are disk thickness, radii, and separation, respectively, γ is the proton gyromagnetic ratio, and JS is the saturation magnetic polarization density of the disk material, which may reach 2 tesla (iron), enabling large spectral offsets. These offsets are scale invariant, permitting a broad range of sensor sizes. Offsets do vary, however, if aspect ratios change. For disks separated by a responsive hydrogel spacer, differentiation predicts the additional NMR frequency shift, Δωoffset, as the gel changes size:
| (2) |
That is, the fractional change in NMR frequency shift scales roughly linearly with the fractional length change of the spacer (see also Fig. 1c inset).
Figure 1. Principles of shape-changing RF colourimetric sensors.
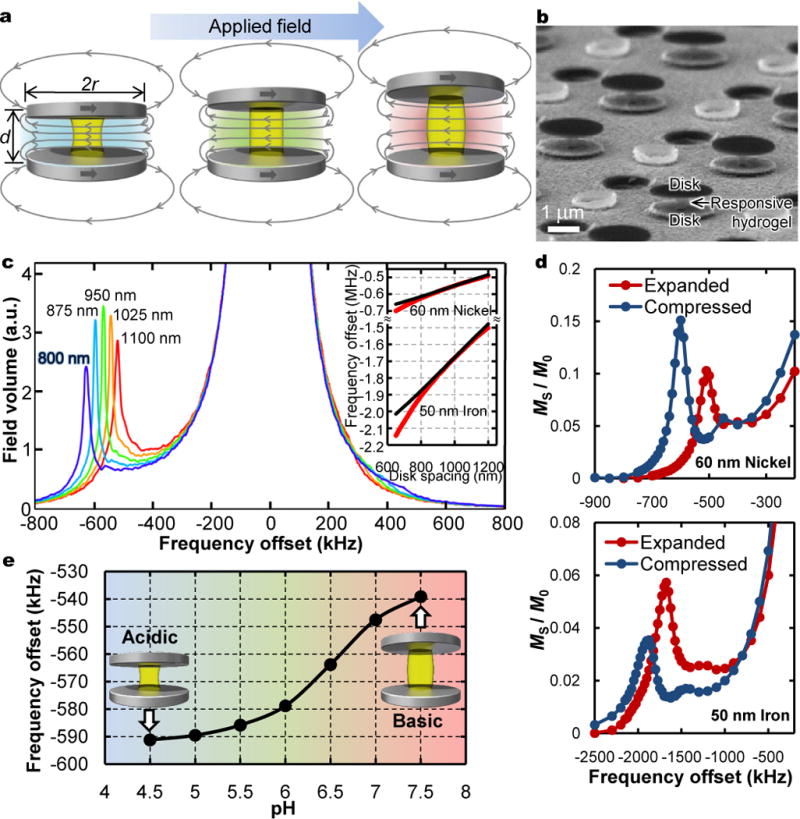
a, Schematic of sensor assemblies comprising two parallel disks magnetized by applied MRI field (blue arrow) and separated by stimuli-responsive hydrogel spacers (yellow). Resulting magnetic fields (gray curves) are uniform between the disks and locally shift NMR frequencies of water passing through proportionally to the field magnitude, which depends on disk spacing, d. Different frequency shifts represent different effective RF “colours”. b, Scanning electron micrograph (SEM) of sensors. (Interspersed features are non-magnetic residual topography from the microfabrication process). c, Theoretical precession frequency (or equivalently, field) histograms, mimicking NMR spectra, for 60-nm thick, 1-μm radii nickel disk pairs with disk spacings indicated. Background water appears at zero offset; shifted peaks result from uniform field regions between the disks. Inset: frequency offset versus disk spacing for nickel and iron disks with thicknesses shown. Dashed black curves are analytic approximations (text eq. 1); red curves result from numerical field simulations. d, Experimental NMR z-spectra for nickel (top) and iron (bottom) sensors with hydrogel spacers in compressed and expanded states. e, Experimental pH-dependent NMR shifts for nickel-based sensors containing pH-sensitive hydrogel spacers designed to shrink (expand) at low (high) pH with peak sensitivity in the physiological pH range.
Sensors described here are microfabricated (see Methods). They comprise 800- to 1000-nm tall, 300- to 400-nm wide posts of biocompatible, antifouling, poly(ethylene glycol)-based hydrogel sandwiched between two 10- to 60-nm thick, 900- to 1000-nm radii disks of nickel, or for biocompatibility, iron. Gel pH sensitivity arises from deprotonation of incorporated methacrylic acid side groups in relatively basic conditions. The resulting charged gel swells, increasing the disk separation, d, and thereby reducing the internal field magnitude and resulting ωoffset. Conversely, in relatively acidic conditions, protonation allows elastic recovery, decreasing d and increasing the magnitude of ωoffset. As examples, resonance shifts of nickel and of iron sensors with compressed and expanded hydrogel spacers are compared in Fig. 1d through NMR z-spectra, which show the frequency-dependent water magnetization saturated out, MS, as a fraction of initial water magnetization M0 (Methods). In Fig. 1e, a pH curve records resonance shifts from sensors submerged in a series of different pH buffers across the physiological pH range. Sensor response times are limited by gel shrinking and swelling times, but with sub-micron to nanoscale hydrogel elements these are easily sub-second (see Methods and Supplementary Video S1), allowing for real-time reporting and spatiotemporally well-localized measurements.
In buffered pH conditions, ionic concentrations can also be measured. Local ion concentrations influence much cellular activity, guiding intracellular function, intercellular communication, and, through chemotactic gradients, extracellular migration. In sensor terms, higher ion concentrations increase electrostatic shielding of the gel, reducing swelling and increasing ωoffset. Spatially arrayed sensors therefore enable MRI visualization of ion gradients. To demonstrate, we record the diffusive mixing between a phosphate buffer and an adjacent water-based agarose gel, which acts as a local water source and ion sink (Fig. 2). Sensor readings spatially and temporally match diffusion simulations of expected ion concentration profiles (see Figs 2b, 2c, Methods, and Supplementary Video S2).
Figure 2. Spatiotemporal mapping of ion concentrations.
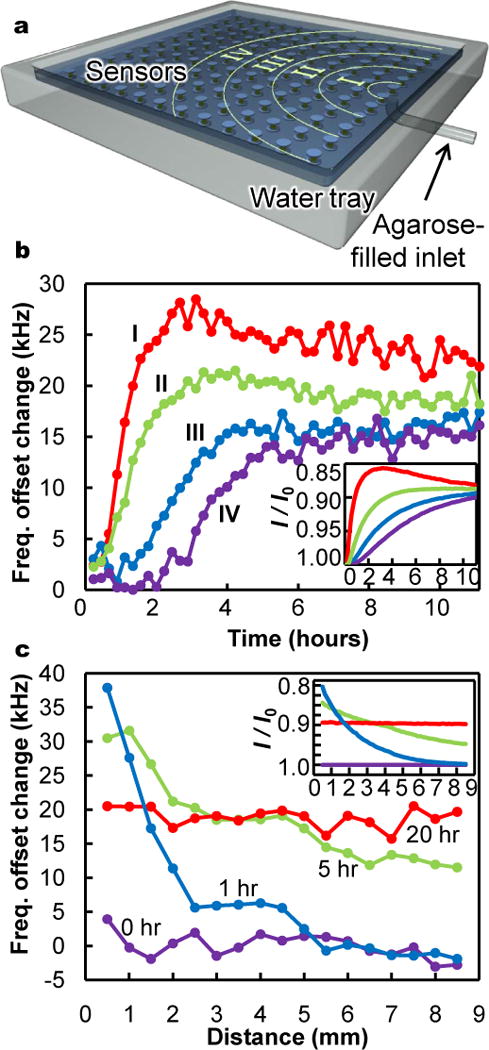
a, Schematic of array of sensors (not to scale) submerged in a water tray filled with a 0.1 M, pH 7.5 buffer that contacts one end of a short tube filled with water-based agarose gel. As ions diffuse from the buffer solution into the agarose, locally depleted ion concentrations within the buffer are detected through induced shifts in sensor resonances. With an agarose volume one tenth that of the buffer, complete mixing corresponds to a 10 millimolar ion reduction, but smaller transient dilutions are also resolvable. b, Time evolution of sensor readings in zones I, II, III, and IV, corresponding to distances from the agar inlet of approximately 1mm to 3mm, 3mm to 5mm, 5mm to 7mm, and 7mm to 9mm, respectively. c, Spatial variation in sensor readings as a function of distance from agarose at various time points. Insets in (b) and (c) show numerical simulations of expected spatiotemporal variations in ionic strength, I, normalized to initial ionic strength, I0.
To verify extended operation in biological fluids, we also tracked metabolic rates of Madin-Darby Canine Kidney (MDCK) cells placed with GEM sensors in an enclosed volume of Dulbecco’s Modified Eagle’s Medium (DMEM) with 10 % fetal bovine serum. With no circulating air, the sensors measure the cell growth medium’s acidification due to metabolic CO2 production and cell necrosis in the increasingly hypoxic surroundings. Experiments were performed at 37°C and at 32°C with half the cell density used at 37°C (Methods). Total oxygen consumption rates should decrease at lower cell numbers and at lower temperatures, which slow cell metabolism. As expected, recorded acidification and time to cell death (inferred by cessation of acidification) were faster at 37°C than at 32°C (Fig. 3). Comparing Figs 3b and 1e, spectral shifts also indicate decreases of roughly 1 and 0.7 (or log 10 and log 5) pH units, confirming that at half the cell density the sensors register half the acidification.
Figure 3. Tracking cell metabolism.
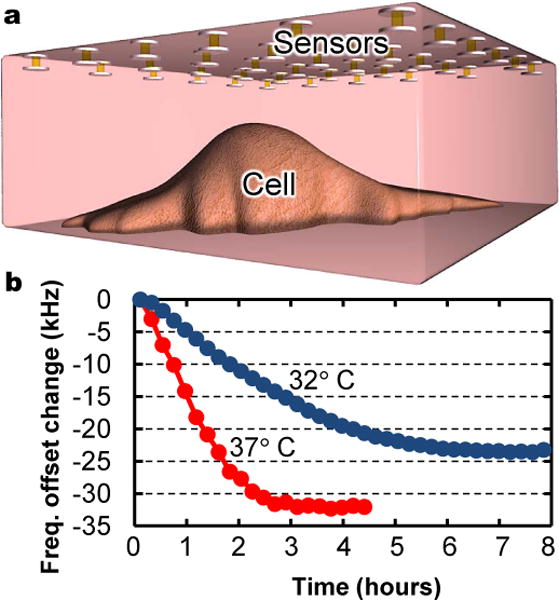
a, Schematic of experiment showing sensors suspended above MDCK cells in sealed volume of cell growth medium. b, Shifts in sensor resonance frequencies over time as cells acidify surrounding medium through metabolic CO2 production and cell necrosis. Different curve slopes and amplitudes confirm different metabolic rates and levels of acidification for experiments run at 37°C and at 32°C, with higher and lower cell densities, respectively.
While spacer gel expansions determine sensor frequency shifts, Δωoffset, initial ωoffset values are independently tunable over large frequency ranges by changing disk shapes and materials (see Eq. 1). Thus different sensors can be spectrally isolated from one another, affording selective addressing and spatially co-localized, multiplexed sensing. As an example, we interleave two hierarchically patterned arrays of sensors of different geometries. Selective detection is demonstrated by decoupling overlaid sensor images (Fig. 4).
Figure 4. Sensor multiplexing.
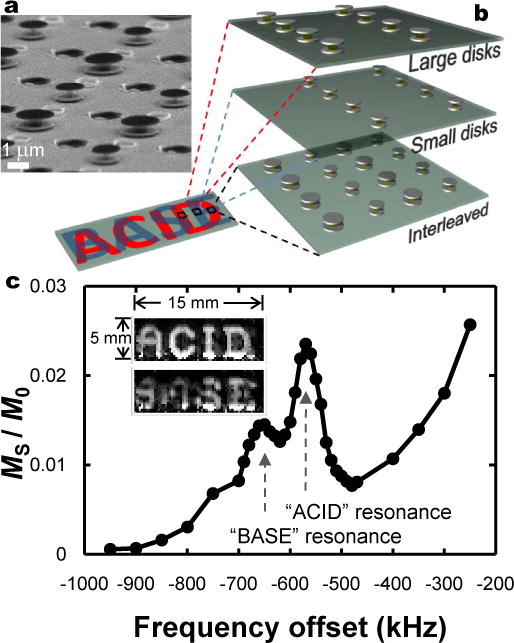
a, SEM showing array of interleaved sensors with alternately larger and smaller disk sizes. (Interspersed features are non-magnetic residual topography from the microfabrication process). b, Schematic of hierarchical, interleaved sensor patterning. The words “ACID” and “BASE” are patterned out of two interleaved arrays of sensors. “ACID” characters are spatially patterned from sensors with larger disks; “BASE” characters from sensors with smaller disks. At locations where characters overlap, both sensor variants are present. c, NMR z-spectrum showing two spectrally separated resonances from sensors comprising larger (“ACID”) and smaller (“BASE”) disks. Inset shows two MRI difference images of the same sample region acquired at different offset frequencies, showing selective addressing of different sensor populations. With alternate sensors interleaved every 6.4 μm, but an image resolution of 250 μm, images also show different sensor signals can be simultaneously resolved even if coincident in the same MRI voxel, allowing co-localized multiplexed sensing. Images are created from signal intensity differences between magnetization transfer images acquired at −1 MHz offset (where water is unaffected by sensors) and at frequencies corresponding to the two different sensor resonances seen in the z-spectrum.
Any biomarker detection is ultimately limited by reporter sensitivity, including absolute probe detectability and relative biomarker-induced changes therein. Several factors combine to amplify GEM reporter sensitivity. Firstly, the sensors’ spatially extended homogeneous field regions allow sensor states to be simultaneously sampled by many water molecules. Secondly, because water continually diffuses in and out of these regions, magnetization transfer imaging can greatly multiply the effective water signal volume (Methods). Thirdly, large ωoffset values shift sensor signals far from any natural background and alleviate slow-exchange limitations8, facilitating more rapid water exchange that further boosts signal. As an example, Extended Data Fig. 5 shows nearly 2.5 % saturation transfer arising from approximately 75,000 GEM sensors submerged in a (15 × 15 × 0.1) mm3 water volume. This extrapolates to 5 % signal change (the standard for reliable detection) at approximately 10 femtomolar sensor concentration, a promising level for targeted molecular imaging and potential monitoring of biomarkers that occur at concentrations undetectable with any other responsive MRI agent.
Converted to metal ion concentrations, the above example, which used iron-based sensors with 10-nm thick, 900-nm radii disks, corresponds to about 50 μM Fe, below clinical Gd3+ and conventional PARACEST lanthanide ion concentrations, and comparable to those of specialized high-sensitivity polymeric and supramolecular PARACEST22,23. However, while GEM agents may consist predominantly of iron, Gd or PARACEST macromolecules are commonly ten-fold more massive than their lanthanide ions alone. That is, despite each sensor being far larger than each lanthanide agent, for equivalent signal contrast the total mass of exogenous material required may be an order of magnitude less for GEM agents. At less than a picogram per sensor, this total mass amounts to a few micrograms per gram, or ml, of water. Notably, the above numbers derive from unoptimized first-generation sensors. Detection limits should improve with more accurate microfabrication24, and with optimized pulse sequence and sensor size and shape design.
Being ferromagnetic, GEM sensor disks are magnetically saturated in most MRI fields. This yields large, field-independent frequency offsets and, per Eq. 2, proportionally large, responsive frequency shifts that further augment sensitivity by magnifying biomarker changes. Large frequency shifts are also particularly advantageous at lower, clinical MRI field strengths, where natural background can overwhelm the smaller shifts of traditional spectroscopic and chemical exchange based approaches. At 1.5 T clinical fields, for example, the sensors’ 32 kHz spectral splitting per pH unit (Fig. 1e) represents approximately 500 parts per million (ppm) separation. However, this results from thin nickel disks and a full-range hydrogel expansion of just 20 % (see Methods). Switching to iron more than triples this splitting. Thicker disks can also increase spectral shifting several-fold, as can smaller disk diameters (see Eq. 1). And hydrogel expansions can be increased substantially. Many responsive gels readily double in size; some hydrogels can even reversibly lengthen twenty-fold25. Over narrow pH ranges, such expansions could improve sensitivity another one to two orders of magnitude. Combined, these modifications suggest potential spectral shifts approaching a million times those of conventional 1H, 19F, or 31P NMR, which yield on the order of 1 ppm per pH unit16–18.
Inherent adaptability of the GEM reporter platform should also allow measurement of many variables besides pH. Different hydrogels, responsive to other environmental parameters, such as temperature, can be substituted. Additionally, through molecular imprinting26, or by incorporating into the hydrogel catalytic enzymes27, enzyme cleavable substrates28, or specific receptor-ligand type bondings29, sensors can be reconfigured to measure (in continuously reversible or irreversible manner) a broad array of analytes including numerous metabolites, antigens, and proteins. Specific protein recognition may in turn also enable sensitive RF mapping of reporter gene expression. Moreover, hydrogel responses can be tuned for optimal sensor range and linearity. For example, for pH sensing, expansions can be tailored through gel composition, crosslink density, and fractional acid content, with active ranges independently selected through acid pKa values.
While GEM sensors are already far smaller than biological cells, currently they still suffer from biological delivery issues associated with nano- to microscale materials. There is, however, growing interest in biomedical applications of materials in these size ranges30. Nor should current sizes limit many in vitro or environmental sensing applications. Still, further sensor miniaturization should be possible, further boosting speed and biological utility. (See Methods for preliminary results in this direction with 250-nm radii disks). Faster water exchange does start broadening linewidths at nanoscale sizes, but hydrogel-based spacers can also help slow water diffusion, pushing ultimate achievable sensor sizes below 50 nm. Ultimate spectral resolutions depend on sensor resonance linewidths, which depend on sensor field inhomogeneities and are presently limited by imperfect microfabrication24. Even with current sensors, however, a nanometer change in disk separation can provide resolvable kilohertz shifts, raising the prospects of sub-nanometer displacement detection and potential NMR-accessible RF analogs to optical plasmonic and fluorescent molecular rulers.
METHODS
Sensor microfabrication
To minimize hydrogel exposure to microfabrication processes31 that might unpredictably impact the gel spacers’ subsequent operation, hydrogels are introduced as late as possible in the fabrication process. This requires fabricating the sensor disks before adding the hydrogel spacer between, which requires a temporary support to suspend the top disks above the base. This more complex fabrication does, however, offer advantages: (i) hydrogels need not be exposed to processing solvents that might contaminate the gel or cause delamination from the processing substrate; (ii) hydrogels need not be exposed to high processing temperatures that may affect expansion behavior32; (iii) having top and bottom disk surfaces exposed before the gel is inserted allows for chemical pretreatment of these surfaces to improve bonding to hydrogels, if desired; (iv) since the gel needs only fill the gap between the disks, fabrication does not depend strongly on differing gel properties, simplifying future sensor fabrication by easing interchange of different gels designed to respond to different targets33.
Fabrication begins by evaporating a layer of magnetic material—typically, nickel or iron—with thickness equal to that of the sensor disks (Extended Data Fig. 1a) onto a glass substrate. (Transparent substrates are used to allow for exposure through the backside for UV crosslinking of hydrogel precursor solutions (detailed below)). Photoresist spun over this magnetic layer is photolithographically patterned to leave disk shaped resist islands after development (Extended Data Fig. 1b). These islands function as protective masks during a subsequent ion milling that removes the exposed magnetic material and leaves, after photoresist removal, disk shaped regions of magnetic material (Extended Data Fig. 1c). A second layer of photoresist (which we call the “spacer layer”) is then spun up to a thickness equal to the desired spacing between top and bottom sensor disks, and patterned with an array of holes interstitial to the base disk array (Extended Data Fig. 1d). Next, a second layer of magnetic material (equal in thickness to the base magnetic layer) is evaporated on top (Extended Data Fig. 1e), and covered with a third layer of resist (Extended Data Fig. 1f) patterned similarly to that in Extended Data Fig. 1b. A second ion milling defines the top array of disks directly above the base disks similarly to that in Extended Data Fig. 1c except that now the remaining photoresist islands are temporarily retained (Extended Data Fig. 1g). Copper is then evaporated on top at a 45 degree angle while the substrate is simultaneously rotated (Extended Data Fig. 1h). The copper therefore coats both the upward-facing surfaces and the sidewalls of the holes in the spacer resist layer. A fourth layer of photoresist spun over the copper is then patterned with small holes offset from both the disk array and the hole array in the spacer layer (Extended Data Fig. 1i) and used as a mask for ion milling replicas of the small holes into the copper layer beneath, leaving the copper structure shown (Extended Data Fig. 1j). These small holes access the underlying resist spacer layer, which is then dissolved away with acetone, exposing the top side of the base disks and the bottom side of the top disks suspended above (Extended Data Fig. 1k). Precursor hydrogel solution poured over then flows through the ion-milled holes in the copper, filling the region between the substrate and the copper support structure. A second substrate placed on top of the hydrogel solution then protects it from atmospheric oxygen, which would otherwise interefere with the cross-linking process34 (Extended Data Fig. 1l), and the gel is crosslinked by UV exposure through the back side of the original transparent substrate. Removing the top substrate then strips off the solidified hydrogel above the copper support structure (Extended Data Fig. 1m) and the re-exposed copper is then ion-milled away, with the top sensor disks being protecting by the photoresist islands that were not removed previously (Extended Data Fig. 1n). To improve copper removal from the photoresist sidewalls and the edges of the top disks, the ion milling is performed at 45 degrees while the substrate rotates about its surface normal. This does lead to cyclical shadowing by the photoresist islands, requiring a longer ion milling duration than normal. On permanently unshadowed surfaces this therefore results in excess milling, which is responsible for the substrate surface depressions seen in the SEM images in Figs. 1 and 4. (Because of residual hydrogel material, some copper does sometimes remain from the surroundings of the access holes in the copper support, which is also evident as residual ring-like structures in the same SEM images). Finally an oxygen plasma is timed such that it etches away the remaining photoresist islands and crosslinked hydrogel to leave narrow central hydrogel spacer posts connecting top and bottom disks (Extended Data Fig. 1o).
Although the schematic shows just four sensors, many millions are fabricated simultaneously on each substrate in square arrays with lattice spacings of 51.2 μm for the detection sensitivity experiments, 12.8 μm for the interleaved multiplexed “acid-base” experiments, and 6.4 μm or 1.6 μm spacings for all other 1000 nm and 250 nm radii sensors, respectively. Note that the above represents just one possible fabrication protocol; other protocols (including, for example, lift-off patterning) should also be feasible. Note also that the disk geometry represents only one possible sensor design; just as multispectral MRI contrast agents can have different geometries, GEM sensors can also be envisioned with different magnetic assemblies.
Hydrogel composition
Hydrogel precursor solutions were mixed as a 1:1 ratio (w/w%) of poly (ethylene glycol)(n) dimethacrylate (PEG block molecular weight of approximately 200, Polysciences, Inc., Warrington Pennsylvania) and methacrylic acid (Sigma-Aldrich, St. Louis, Missouri)35. To this was added 5% (w/w%) of 2,2-Dimethoxy-2-phenylacetophenone (also from Sigma-Aldrich), used as a photoinitiator. Cross-linking was performed using an i-line UV source with 5 J/cm2 flood exposure through half-millimeter thick borosilicate glass substrates. Before sensors were used, they were soaked in water or pH buffer (typically in pH 7 to 7.5) to wash out unreacted initiator and/or monomer, which might otherwise impede water access and hydrogel swelling or shrinking.
Hydrogel expansion
The 20 % expansion quoted in the paper can be derived from the paper Eq. 2, which shows that the frequency shift (about 10 % between compressed and expanded gel spacer) is approximately half that of the gel expansion percentage. As a cross-check, however, we also tested a macroscopic sample of the hydrogel, formulated similarly to that used in the nanoscopic hydrogel spacers. The test sample was polymerized against a substrate with surface relief patterns pre-etched at two different length scales: a series of etched lines (1-micrometer wide with 2-micrometer center-to-center spacing), which formed an optical diffraction grating, together with wider grid lines that divide up the diffraction grating into mm-scale squares. This pattern is transferred into the polymerized hydrogel surface and is visible when the hydrogel is removed from the substrate, simplifying measurement of gel expansion/contraction. Extended Data Fig. 2 show such a hydrogel sample in compressed and expanded state (immediately after being removed and lightly wiped dry after submerging in a pH 8 buffer). Images agree with an isotropic linear expansion of about 20 %. Admittedly, in the sensor configuration, expansion may not be completely isotropic. The cylindrical gel spacers are laterally constrained at their top and bottom end surfaces through contact to the magnetic disks. During expansion this manifests as radial (transverse) compressive strain near the two ends of the spacer that may slightly increase the axial expansion36 (by an amount that depends on Poisson’s ratio of the gel and on the extent of the radial strain towards the cylinder ends). Such additional expansion is likely small, however, because the transverse squeezing exists over only a fraction of the gel cylinder. Total expansion therefore seems in good agreement with sensor NMR field shift measurements.
pH buffers
All buffers were 0.1 M phosphate buffers mixed from monosodium phosphate and its conjugate base, disodium phosphate.
Curve fitting
To avoid any bias in extracting sensor resonant frequencies, each z-spectrum was automatically curve fit to a linear background-subtracted Gaussian curve with the central frequency of the fit Gaussian being taken as the sensor’s resonant spectral offset. (In the case of the agarose-buffer ion mapping experiments, where separate z-spectra were collected for each imaging voxel, signal-to-noise levels were sometimes insufficient to guarantee convergence of the curve-fitting algorithm. Therefore, to ensure consistency, those z-spectra were first averaged over several voxels in space and/or time).
Agarose-buffer inter-diffusion experiment, simulation, and animation
Diffusion mapping was based on a 0.1 M, 7.5 pH phosphate buffer solution filling an approximately (15 × 15 × 0.1) mm3 water tray with one surface covered in a (14 × 14) mm2 array of 1000-nm radii sensors (lattice spacing 6.4 μm). A hole drilled into the tray material from underneath provided access to the water in the tray at a position 1 to 2 mm from one edge of the square water tray. A 1-mm inner diameter tube, filled with a ~ 3-mm length of agarose, was inserted into this hole such that one end of the agarose contacted the water in the tray.
To confirm that shifts in sensor resonant frequencies were due to changes in ionic strength, and not inadvertent changes in pH as the buffer strength was diluted by the water in the agarose gel, a separate experiment was performed with pH 7.5 buffer solution poured directly over a volume of agarose gel twice as large as the buffer volume (to amplify any effect). After sitting for a day, the pH, as measured by conventional pH meter, had shifted by no more than 0.1 pH units, and did not shift any further thereafter. Since the ratio of agarose to pH buffer volume in the actual diffusion experiment was 20 times smaller than this, any pH changes in the actual experiment were assumed negligible.
Because of the finite dimensions of the agarose source/sink and the water tray, diffusion dynamics are not easily analytically approximated. Therefore, a numerical simulation of the ion diffusion between buffer and agarose was performed. Extended Data Fig. 3 shows sample simulation-derived in-plane ion concentration variations at various times. Theory insets to paper figs 2b and 2c were derived from these simulations.
The animation (Supplementary Video S2) derived from the sensor-recorded ion concentration data was generated by automatically curve-fitting all z-spectra collected, in space and time. The animation comprises a sequential time series of spatial maps of the measured sensor resonant frequencies.
Hierarchically patterned “ACID”/“BASE” sample
The “ACID”/“BASE” sample was microfabricated using the protocol described above except patterning steps (b) and (f) were modified. Arrays with interleaved rows of large and small disks were first optically exposed and then, prior to photoresist development, re-exposed over with a pattern that removed disks everywhere except for locations corresponding to the “ACID”/“BASE” patterns. Since both sensor sizes were processed simultaneously, remaining hydrogel posts are wider for larger disk sensors than for smaller ones.
Z-spectra and magnetization transfer imaging
Sensor signals come predominantly from water whose NMR precession frequency has been shifted by the homogeneous field between the sensor’s disks. Because self-diffusion continually replenishes the water within this homogeneous field region, however, the volume of water from which signal is acquired can be orders of magnitude larger than the volume between the disks. We exploit this diffusion-driven signal amplification by using a magnetization transfer imaging37 method. As shown schematically in Extended Data Fig. 4, trains of preparatory RF-pulses (generally π/2 pulses) are applied at an off-resonant frequency to “saturate out” the magnetization of any water that is shifted to that particular frequency as it diffuses through the magnetic fields surrounding the sensor structure. This is followed by an on-resonance pulse and free-induction-decay (FID) acquisition that measures the remaining bulk water magnetization not yet saturated out. Noting the saturation as a function of the offset frequency of the applied RF-pulse train builds up the z-spectra38 used to measure sensor spectral shifts. Since the fields external to the sensor structures are inhomogeneous and decay rapidly in space, relatively little saturation occurs at most offset frequencies; conversely, when the frequency of the off-resonant preparatory pulses matches the frequency shift due to the extended internal homogeneous field regions of the sensors, significant saturation signal can accrue from water as it diffuses in and out between the sensor disks. Exact signal amplification depends on how often water between the sensor disks is replenished before the accumulated magnetization deficit decays appreciably due to longitudinal relaxation. Since the time to diffuse a given distance scales quadratically with that distance, refresh rates are higher for smaller sensor structures allowing higher signal gains. A caveat is that the water exchange should not be so fast that it frequency-broadens the shifted sensor lines to such a degree that they overlap the unshifted background water line. Sensors with larger spectral shifts therefore allow faster water exchange rates and, accordingly, greater signal amplifications.
Sensor detection concentration limit
Detection concentration limit experiments (see Extended Data Fig. 5) were performed using an array of sensors made from 900-nm radii, 10-nm thick Fe disks. The sensor array was approximately (14 × 14) mm2 with square lattice spacing of 51.2 μm, equaling about 75,000 sensors, and was submerged in a (15 × 15 × 0.1) mm3 volume of water. Imperfect microfabrication did unnecessarily broaden sensor linewidths somewhat and lead to some fraction of these sensors being malformed, implying a true count of operable sensors less than 75,000. For calculations, however, we have assumed 75,000; that is, real sensor detection limits are likely better than those quoted here.
Cell metabolism experiments
All cells were incubated in DMEM cell growth medium with 10 % fetal bovine serum at 37°C in a custom designed (15 × 15 × 0.1) mm3 sample holder, with initial cell number and incubation time selected to give, for the high density experiment, a monolayer coverage of cells adherent to the sample holder base. Prior to MRI scanning, the medium was replaced with fresh growth medium and the sample holder sealed with a flat lid containing the array of sensors on its underside. To allow immediate recording, the MRI bore was pre-warmed to 37°C or 32°C (to slow cell metabolism39) by setting the gradient coil chiller to instead heat appropriately. Following experiments it was noted that the Phenol Red pH indicator dye present in the DMEM cell medium had turned from an initially pinkish colour to a yellowish one, indicating that medium pH had fallen at least below 6.8. Also, pipetting the cell medium liquid from a separate control experiment into a pH test paper, revealed a final pH of 6.5 ± 0.3, in agreement with the GEM sensor readings.
250-nm radii double disk structures
Paper results are based on 900- to 1000-nm radii sensors, but we are currently exploring further shrinking the sensors. A sample z-spectrum is shown in Extended Data Fig. 6 from preliminary 250-nm radii, 20-nm thick, double-disk structures. As yet, our microfabrication is not optimized for these smaller structures. Signals are therefore lower than possible but still easily resolvable, suggesting the feasibility of considerably smaller structures.
Sensor response rates
GEM sensor response times are limited by the response rates of their hydrogel spacers. Macroscopic hydrogels often respond slowly because they are limited by the time taken for solute (or solvent) to penetrate through the gel. Being a primarily diffusive process this is slow for large gels but speeds up roughly quadratically as gel sizes shrink. For sensors with nanoscale spacing posts, diffusion times through the gels are predicted to be in the millisecond range or below, enabling sensor responses that are fast on NMR timescales. This aids real-time tracking of local changes in the environment but can complicate measurement of the exact sensor response speed itself, since sensor transient dynamics may be too fast even to be recorded by NMR.
In control experiments, however, we find that it is possible to also optically observe sensor action. We find that light reflecting off an array of sensor structures’ top disks can interfere with light reflecting off the sensor bottom disks/substrate, producing different interference colours that depend on the top-to-bottom disk separation in a manner akin to “thin-film interference” phenomena more commonly seen in soap bubbles, thin oil films, etc. For appropriate viewing angles, as the hydrogels change size the reflected light oscillates between being biased towards the red or blue end of the spectrum. Specifically, for close to normal incidence, the 20 % length change in the hydrogel spacers used in the paper translates into a total optical path length change of 400 to 500 nm (assuming water index of refraction ~ 1.33). This corresponds to almost a full oscillation through reflected colours, implying that as the hydrogel spacers shrink, an initially reddish reflection, say, would be expected to turn green/blue and then partially return to red again (and vice versa). An example of this is shown in Supplementary Video S1, which shows an array of sensors covering a (15 × 15) mm2 substrate submerged in phosphate buffered saline and subjected to a short pulse of a few drops of dilute hydrochloric acid that lowers the local pH as it sweeps through the solution. The video, which is in real-time at 30 frames per second, shows rapid colour change, implying rapid sensor response, following the acid front. (Note that due to surface dirt and resulting microfabrication errors, sensors at different points on the substrate have slightly different initial hydrogel spacer lengths, which impart different initial reflected colours at different points across the substrate).
To better quantify the rate of change, Extended Data Fig. 7 shows the colour change observed as a function of time at different points on the substrate as the acid front moves over. Also shown is a sample sequential series of still frames from the same video. Once the acid front reaches any given point on the substrate, the reflected colour can be seen to change rapidly, with virtually all the colour change occurring within 100 to 200 milliseconds. Unfortunately, we currently cannot discern what fraction of this time period is actually consumed by sensor response versus simply the time it takes for the acid to first locally mix with and acidify the solution surrounding the sensors. The data do, however, establish a ceiling for sensor response time of 0.2 seconds or less.
MRI pulse sequence parameters
All data were acquired on either a 14 T scanner with commercial birdcage transmit/receive coil or on an 11.7 T scanner with homebuilt solenoid transmit/receive coil. Field strength and coil type were chosen based on scanner and coil availability and are not necessarily optimal. Similarly, pulse sequence parameters are not necessarily optimized.
Compressed and expanded Ni and Fe sensor z-spectra (Fig. 1d)
For each frequency point in each of the z-spectra shown, series of 15000 off-resonant π/2 gaussian-shaped pulses of length 0.1 ms with center-to-center spacings of 0.35 ms were first applied. Following these preparatory off-resonance pulses, a single on-resonance π/2 hard pulse was applied followed by FID acquisition of the on-resonance water (see pulse schematic in Extended Data Fig. 4). A 6 s delay was added after the acquisition before the next series of off-resonance pulses were applied. Data presented are based on 2 averages.
pH curve (Fig. 1e)
Each point records the sensors resonance frequency determined from a z-spectrum acquired from sensors submerged in the relevant pH buffer. Each z-spectrum was acquired similarly to those for the compressed and expanded Ni and Fe sensor examples above, except that the preparatory pulse series consisted of 12000 pulses.
Agarose-buffer ion diffusion (Figs 2b and 2c)
The same preparatory off-resonance pulse sequences were used as for the pH-curve z-spectra above. However, each train of off-resonance pulses was followed by a gradient-echo imaging sequence with TR/TE = 20/2.2 ms, matrix size = 32 × 32, 30 degree flip angle, total FOV = 19.2 mm × 19.2 mm, and with center-out phase encoding. (total acquisition time for each image at each offset frequency = 640 ms).
Cell metabolism (Fig. 3b)
The same pulse sequence as for the pH-curve z-spectra was used with the experiment repeated continually until no further frequency change was observed.
Multiplexed “ACID”/“BASE” z-spectra (Fig. 4c)
The same pulse sequence as for the pH-curve z-spectra was used.
Multiplexed “ACID”/“BASE” image (Fig. 4c inset)
The same pulse sequence as for the pH-curve z-spectra was used. However, each train of off-resonance pulses was followed by a gradient-echo imaging sequence with TR/TE = 25/2.3 ms, matrix size = 64 × 32, 30 degree flip angle, total FOV = 15 mm × 7.5 mm, and with center-out phase encoding. (total acquisition time for each image at each offset frequency = 800 ms). This acquisition was repeated 100 times allowing for signal averaging.
Detection concentration limit z-spectrum (Extended Data Fig. 5)
A similar acquisition sequence as to the pH-curve z-spectra was used except this time applying 25000 off-resonance π pulses.
250nm-radii double disk spectrum (Extended Data Fig. 6)
A similar acquisition sequence as to the pH-curve z-spectra was used except this time applying 15000 pulses and an 8 s delay between acquisition of each point in the spectrum.
Extended Data
Extended Data Figure 1. Schematic of microfabrication protocol.
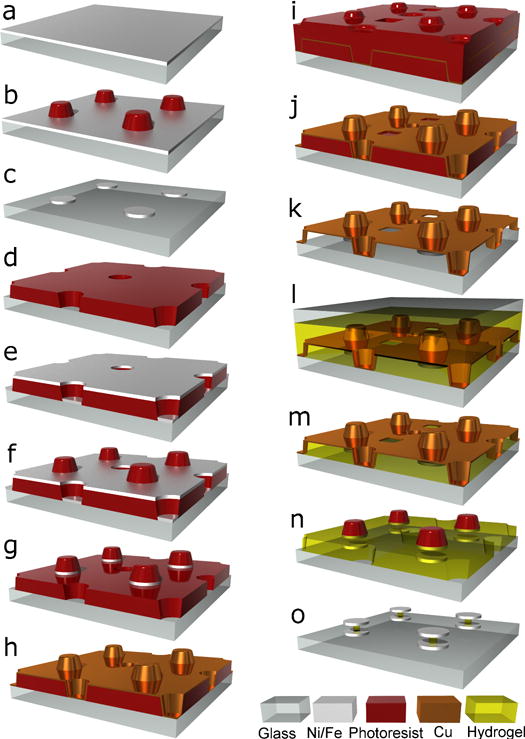
See Methods for explanation.
Extended Data Figure 2. Hydrogel expansion.
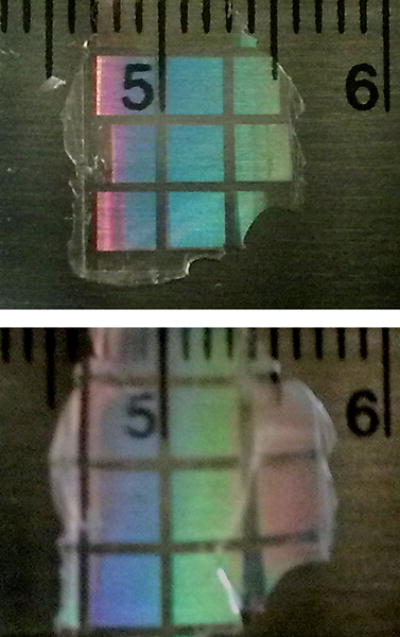
Hydrogel sample in compressed (top) and expanded (bottom) state, showing ~ 20 % linear expansion.
Extended Data Figure 3. Diffusion simulations.

Logarithmically shaded plots of numerically simulated ion-concentrations (normalized to initial concentration of unity) due to diffusion between pH buffer solution and water-based agarose gel.
Extended Data Figure 4. Pulse protocol.
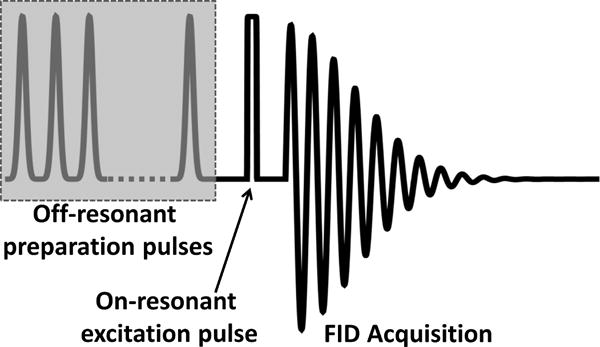
Schematic showing off-resonant preparatory pulse train, followed by on-resonant excitation pulse and FID acquisition. The sequence is repeated, each time with different offset frequency, to acquire each point in the z-spectrum.
Extended Data Figure 5. Sensor sensitivity.
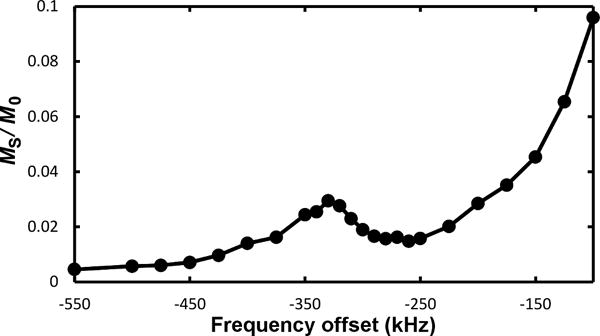
Z-spectrum, showing magnetization saturation MS, normalized to the initial water magnetization M0, from sensors with 900-nm radii, 10-nm thick Fe disks with resonance around – 325 kHz.
Extended Data Figure 6. Sensor miniaturization.
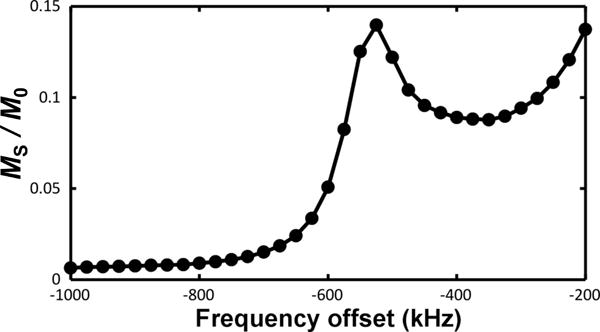
Z-spectrum, showing magnetization saturation MS, normalized to the initial water magnetization M0, for 250-nm radii double-disk structures with resonance around – 525 kHz.
Extended Data Figure 7. Optically probed sensor response rates.
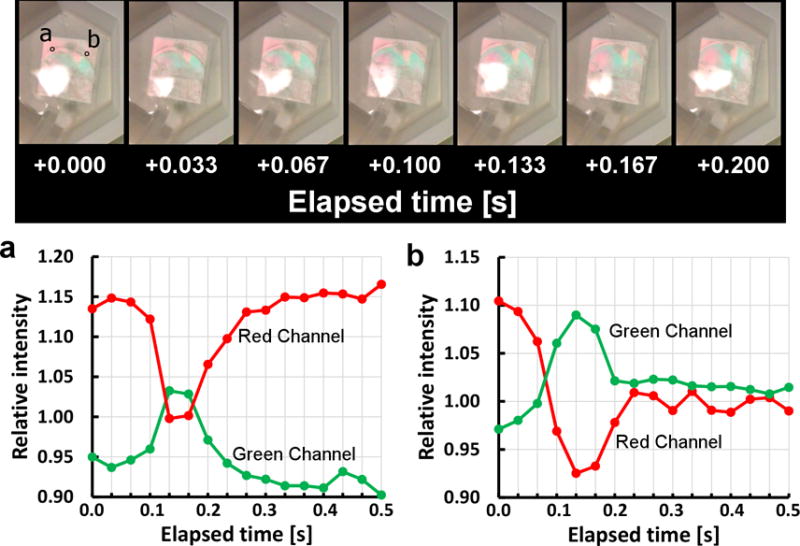
Top panel: Series of consecutive still frames from Supplementary Video S1, showing propagation of acid front over an array of sensors. Resulting changes in reflected colours are due to changes in spacing between sensor top and bottom disks, indicating rapid sensor response to introduced acid. Bottom panel: Reflected light intensity in green and red channels (normalized to average light intensity across all colour channels) recorded frame-by-frame at encircled substrate points (a) and (b) indicated above. Slightly different starting and end points within colour oscillation are due to unintentional sensor microfabrication variation across the substrate.
Supplementary Material
Acknowledgments
This work was supported in part by the NIH NINDS Intramural Research Program. We thank the NIH Mouse Imaging Facility for use of their 14T MRI, Dr. Yun Chen for providing us the MDCK cells used, and Dr. John Moreland for useful discussion and NIST Boulder cleanroom access.
Footnotes
Author Contributions G.Z. conceived of the project, designed the experiments, fabricated the sensors, analyzed the data, and wrote the manuscript. S.J.D. designed all NMR/MRI pulse sequences used, helped acquire all NMR/MRI data, and helped write the manuscript. A.P.K. oversaw the work, provided critical feedback, and helped write the manuscript.
Author Information The authors declare no competing financial interests.
References
- 1.Zhang J, Campbell RE, Ting AY, Tsien RY. Creating new fluorescent probes for cell biology. Nat Rev Mol Cell Bio. 2002;3:906. doi: 10.1038/nrm976. [DOI] [PubMed] [Google Scholar]
- 2.Michalet X, et al. Quantum dots for live cells, in vivo imaging, and diagnostics. Science. 2005;307:538. doi: 10.1126/science.1104274. [DOI] [PMC free article] [PubMed] [Google Scholar]
- 3.Anker JN, et al. Biosensing with plasmonic nanosensors. Nat Mater. 2008;7:442. doi: 10.1038/nmat2162. [DOI] [PubMed] [Google Scholar]
- 4.Hilderbrand SA, Weissleder R. Near-infrared fluorescence: application to in vivo molecular imaging. Curr Opin Chem Bio. 2010;14:71. doi: 10.1016/j.cbpa.2009.09.029. [DOI] [PubMed] [Google Scholar]
- 5.Yoo B, Pagel MD. An overview of responsive MRI contrast agents for molecular imaging. Frontiers in Bioscience. 2008;13:1733. doi: 10.2741/2796. [DOI] [PubMed] [Google Scholar]
- 6.Martinez GV, et al. Imaging the extracellular pH of tumors by MRI after injection of a single cocktail of T1 and T2 contrast agents. NMR Biomed. 2011;24:1380. doi: 10.1002/nbm.1701. [DOI] [PMC free article] [PubMed] [Google Scholar]
- 7.Schröder L, Lowery TJ, Hilty C, Wemmer DE, Pines A. Molecular imaging using a targeted magnetic resonance hyperpolarized biosensor. Science. 2006;314:446. doi: 10.1126/science.1131847. [DOI] [PubMed] [Google Scholar]
- 8.Woods M, Woessner DE, Sherry AD. Paramagnetic lanthanide complexes as PARACEST agents for medical imaging. Chem Soc Rev. 2006;35:500. doi: 10.1039/b509907m. [DOI] [PMC free article] [PubMed] [Google Scholar]
- 9.Ward KM, Balaban RS. Determination of pH using water protons and chemical exchange dependent saturation transfer (CEST) Magn Reson Med. 2000;44:709. doi: 10.1002/1522-2594(200011)44:5<799::aid-mrm18>3.0.co;2-s. [DOI] [PubMed] [Google Scholar]
- 10.Zabow G, Dodd S, Moreland J, Koretsky A. Micro-engineered local field control for high-sensitivity multispectral MRI. Nature. 2008;453:1058. doi: 10.1038/nature07048. [DOI] [PMC free article] [PubMed] [Google Scholar]
- 11.Zabow G, Dodd SJ, Moreland J, Koretsky AP. The fabrication of uniform cylindrical shells and their use as spectrally tunable MRI contrast agents. Nanotechnology. 2009;20:385301. doi: 10.1088/0957-4484/20/38/385301. [DOI] [PMC free article] [PubMed] [Google Scholar]
- 12.Zabow G, Dodd SJ, Koretsky AP. Ellipsoidal microcavities: electromagnetic properties, fabrication, and use as multispectral MRI agents. Small. 2014;10:1902. doi: 10.1002/smll.201303045. [DOI] [PMC free article] [PubMed] [Google Scholar]
- 13.Wang X, Wang C, Anderson S, Zhang X. Microfabricated iron oxide particles for tunable, multispectral magnetic resonance imaging. Mater Lett. 2013;110:122. [Google Scholar]
- 14.Wang C, Wang X, Anderson SW, Zhang X. Biocompatible, micro- and nano-fabricated magnetic cylinders for potential use as contrast agents for magnetic resonance imaging. Sens Actuators B: Chem. 2014;196:670. [Google Scholar]
- 15.Peppas NA, Hilt JZ, Khademhosseini A, Langer R. Hydrogels in biology and medicine: from molecular principles to bionanotechnology. Adv Mater. 2006;18:1345. [Google Scholar]
- 16.Pan JW, Hamm JR, Rothman DL, Shulman RG. Intracellular pH in human skeletal muscle by 1H NMR. Proc Natl Acad Sci USA. 1988;85:7836. doi: 10.1073/pnas.85.21.7836. [DOI] [PMC free article] [PubMed] [Google Scholar]
- 17.Taylor JS, Deutsch C. Fluorinated α-methylamino acids as 19F NMR indicators of intracellular pH. Biophys J. 1983;43:261. doi: 10.1016/S0006-3495(83)84349-5. [DOI] [PMC free article] [PubMed] [Google Scholar]
- 18.Moon RB, Richards JH. Determination of intracellular pH by 31P magnetic resonance. J Biol Chem. 1973;248:7276. [PubMed] [Google Scholar]
- 19.Wu Y, Soesbe TC, Kiefer GE, Zhao P, Sherry AD. A responsive europium(III) chelate that provides a direct readout of pH by MRI. J Am Chem Soc. 2010;132:14002. doi: 10.1021/ja106018n. [DOI] [PMC free article] [PubMed] [Google Scholar]
- 20.Gallagher FA. Magnetic resonance imaging of pH in vivo using hyperpolarized 13C-labelled bicarbonate. et al. Nature. 2008;453:940. doi: 10.1038/nature07017. [DOI] [PubMed] [Google Scholar]
- 21.Jindal AK, et al. Hyperpolarized 89Y complexes as pH sensitive NMR probes. J Am Chem Soc. 2010;132:1784. doi: 10.1021/ja910278e. [DOI] [PMC free article] [PubMed] [Google Scholar]
- 22.Wu Y, et al. Polymeric PARACEST agents for enhancing MRI contrast sensitivity. J Am Chem Soc. 2008;130:13854. doi: 10.1021/ja805775u. [DOI] [PMC free article] [PubMed] [Google Scholar]
- 23.Aime S, Delli Castelli D, Terreno E. Supramolecular adducts between poly-L-arginine and [TmIIIdotp]: a route to sensitivity-enhanced magnetic resonance imaging-chemical exchange saturation transfer agents. Angew Chem Int Ed. 2003;42:4527. doi: 10.1002/anie.200352132. [DOI] [PubMed] [Google Scholar]
- 24.Zabow G, Koretsky AP, Moreland J. Design and fabrication of a micromachined multispectral magnetic resonance imaging agent. J Micromech Microeng. 2009;19:025020. [Google Scholar]
- 25.Sun JY, et al. Highly stretchable and tough hydrogels. Nature. 2012;489:133. doi: 10.1038/nature11409. [DOI] [PMC free article] [PubMed] [Google Scholar]
- 26.Byrne ME, Park K, Peppas NA. Molecular imprinting within hydrogels. Adv Drug Delivery Reviews. 2002;54:149. doi: 10.1016/s0169-409x(01)00246-0. [DOI] [PubMed] [Google Scholar]
- 27.Fischel-Ghodsian F, Brown L, Mathiowitz E, Brandendurg D, Langer R. Enzymatically controlled drug delivery. Proc Natl Acad Sci USA. 1988;85:2403. doi: 10.1073/pnas.85.7.2403. [DOI] [PMC free article] [PubMed] [Google Scholar]
- 28.Plunkett KN, Berkowski KL, Moore JS. Chymotrypsin responsive hydrogel: application of a disulfide exchange protocol for the preparation of methacrylamide containing peptides. Biomacromolecules. 2005;6:632. doi: 10.1021/bm049349v. [DOI] [PubMed] [Google Scholar]
- 29.Miyata T, Asami N, Uragami T. A reversibly antigen-responsive hydrogel. Nature. 1999;399:766. doi: 10.1038/21619. [DOI] [PubMed] [Google Scholar]
- 30.Shapiro EM, Skrtic S, Koretsky AP. Sizing it up: cellular MRI using micron-sized iron oxide particles. Magn Reson Med. 2005;53:329. doi: 10.1002/mrm.20342. [DOI] [PubMed] [Google Scholar]
Methods References
- 31.Madou MJ. Fundamentals of microfabrication: the science of miniaturization. CRC Press; Florida: 2002. [Google Scholar]
- 32.Kabiri K, Mirzadeh H, Zohuriaan-Mehr MJ. Undesirable effects of heating on hydrogels. J Appl Polym Sci. 2008;110:3420. [Google Scholar]
- 33.Ulijn RV, et al. Bioresponsive hydrogels. Mater Today. 2007;10:40. [Google Scholar]
- 34.Dekker C, Jenkins AD. Kinetic approach of O2 inhibition in ultraviolet- and laser-induced polymerizations. Macromolecules. 1985;18:1241. [Google Scholar]
- 35.Chemical supplier names are included solely to specify experimental details; they do not indicate. National Institute of Standards and Technology (NIST) or National Insitutes of Health (NIH) endorsement of any particular company; [Google Scholar]
- 36.Yoon J, Cai S, Suo Z, Hayward RC. Poroelastic swelling kinetics of thin hydrogel layers: comparison of theory and experiment. Soft Matter. 2010;6:6004. [Google Scholar]
- 37.Henkelman RM, Stanisz GJ, Graham SJ. Magnetization transfer in MRI: a review. NMR Biomed. 2001;14:57. doi: 10.1002/nbm.683. [DOI] [PubMed] [Google Scholar]
- 38.Grad J, Bryant RG. Nuclear magnetic cross-relaxation spectroscopy. J Magn Reson. 1990;90:1. doi: 10.1002/mrm.1910170216. [DOI] [PubMed] [Google Scholar]
- 39.Jorjani P, Ozturk SS. Effects of cell density and temperature on oxygen consumption rate for different mammalian cell lines. Biotechnology and Bioengineering. 1999;64:349. doi: 10.1002/(sici)1097-0290(19990805)64:3<349::aid-bit11>3.0.co;2-v. [DOI] [PubMed] [Google Scholar]
Associated Data
This section collects any data citations, data availability statements, or supplementary materials included in this article.


