Abstract
Age 65 represents a transition point where most U.S. residents begin Medicare coverage. We examined whether or not delays in medical care near this age extend to cancer diagnosis. We calculated single-year-of-age cancer incidence rates by site and stage for the most common cancer sites (i.e., prostate, female breast, lung, and colorectal) for the 2000–2010 period using data from the SEER 18 registries, and we used Poisson regression to identify a possible age-65 effect. The analysis was repeated on comparable Canadian data. Cancer rates at age 65 were found to be as much as 15% above expected in the U.S. data, with the age-65 effect strongly associated with site- and stage-specific survival. A smaller association was seen in the Canadian data. We found strong evidence that diagnosis of less severe cancers spikes at age 65. Delay of medical care prior to this age has complex policy implications.
The 65th birthday is a major life milestone for many Americans. It corresponds to the age when nearly all become eligible for health-care coverage through Medicare, when many begin receiving Social Security benefits, and when many choose to retire. This age boundary has been shown to have profound effects on health and health-care utilization. For example, rates of medical screening, diagnosis, and treatment for conditions that are low urgency, asymptomatic, and reimbursable by Medicare are found at much higher levels among those aged 65 years than those aged 64 years.1–3 It has been suggested that this phenomenon is driven by the low-cost “Welcome to Medicare” physical examination instituted in 2005, but too few people have taken advantage of this feature for it to explain much of the difference.4
In contrast, rates of “nondeferrable admissions,” defined as conditions where hospital admission rates through emergency departments do not diminish on weekends, show no change at age 65 years.5 For those who are uninsured or underinsured, there are clear financial incentives to postpone nonurgent medical encounters until Medicare is available. The effect is too large, however, to be explained by the behavior of the uninsured and underinsured alone. Even some people who are fully insured postpone treatment until age 65 years, either because of the perception that Medicare is a more generous health-care plan than other insurance plans or because postponing is more convenient.5 Recovering from a hip replacement while retired, for example, may be more practical than attempting to do so while employed.
None of the existing research on pent-up demand for Medicare has, to our knowledge, specifically considered cancer incidence. We hypothesized that cancer should follow the same pattern as seen for other medical conditions. Specifically, screen-detected, asymptomatic, nonlethal tumors should show an unusually high incidence rate at age 65 years relative to other ages, while advanced-stage, low-survival tumors should show no difference. If correct, this observation should inform the current discussion regarding the extent to which certain cancers are being overdiagnosed and overtreated as a consequence of aggressive screening,6 as the Medicare program may be unwittingly bearing an undue share of the cost of such treatment. Conversely, underdiagnosis and undertreatment of those approaching 65 years of age may also be unduly shortening life spans among this group.
We measured the elevation in cancer rates at age 65 years above what would be expected based on the otherwise smooth trend between ages 55 and 75 years. We considered prostate, female breast, lung, and colorectal cancers—the four most common cancer sites—which accounted for approximately 54% of all incident cases in the United States during the 2000–2010 period. Each of these cancers is detectable through screening, although at the time of writing only colorectal cancer screening for those aged 50–75 years was unequivocally endorsed by the U.S. Preventive Services Task Force (USPSTF).7 Breast cancer screening for women aged 50–74 years is generally recommended, but the guidelines for women older than 40 years of age are currently under review.8,9 Lung cancer screening is recommended only for current or recent heavy smokers aged 55–80 years,10 and prostate cancer screening is not recommended at all.11 We further investigated the relationship between the age-65 effect and the severity of the cancer, as measured by five-year survival. Finally, we compared the results from the United States with equivalent results from Canada, where no change in health-care insurance status occurs at age 65, but where 65 is also a popular retirement age.
METHODS
We generated cancer incidence rates and five-year relative survival values from the November 2012 edition of the Surveillance, Epidemiology, and End Results (SEER) database.12 We used data from 18 population-based cancer registries covering about 28% of the U.S. population for diagnosis years 2000–2010. We first obtained cancer rates by single year of age for those aged 55–75 years for invasive prostate, female breast, lung, and colorectal cancers, classified into local, regional, and distant stage using the SEER Summary Stage 2000 variable. We also considered in situ cases of colorectal and breast cancer, yielding 14 site–stage combinations. The analysis included more than 1.2 million cancer cases in total.
To test the discontinuities in incidence rates at age 65 years, we fit the age-specific rates using Poisson regression, with the rate a function of age, age squared (to allow for nonlinearity in the model fit), and an indicator variable for age 65, where the variable is 1 at age 65 and 0 otherwise. The model can be expressed as:
The value b3 is of greatest interest as it quantifies the rate attributable to being 65 years of age that is above what would be expected based on a smooth increase with age. Lastly, we related b3 to corresponding five-year cause-specific survival via a scatterplot and simple linear regression.
We also obtained Canadian incidence and survival data for the same cancer sites, age range, and time period, covering all provinces excluding Quebec, and fit these data using the same model (Unpublished data. Statistics Canada. Canadian Cancer Registry and population estimates at Statistics Canada. Custom data file received on March 13, 2014).13 As Canadian data were not available by stage, this analysis was limited to four cancer sites.
RESULTS
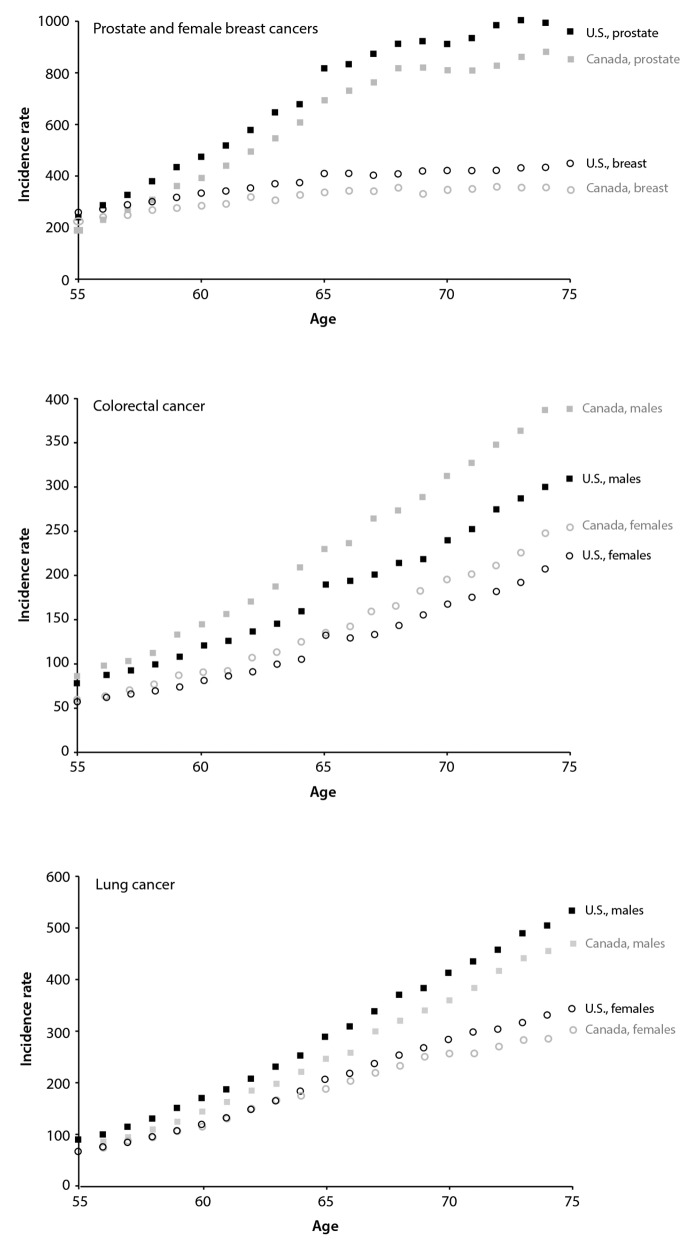
Figure 1 shows cancer rates by single year of age for the United States and Canada for prostate and female breast cancer (Figure 1a), lung cancer (Figure 1b), and colorectal cancer (Figure 1c). For prostate and colorectal cancer, a discontinuity in rates at age 65 years was visibly apparent in the United States; this discontinuity was less true of breast and lung cancer. For the Canadian data, a smaller discontinuity for prostate cancer was evident at age 65 years.
Figure 1.
Cancer incidence rates by single year of age for those aged 55–75 years, United States and Canada, 2000–2010
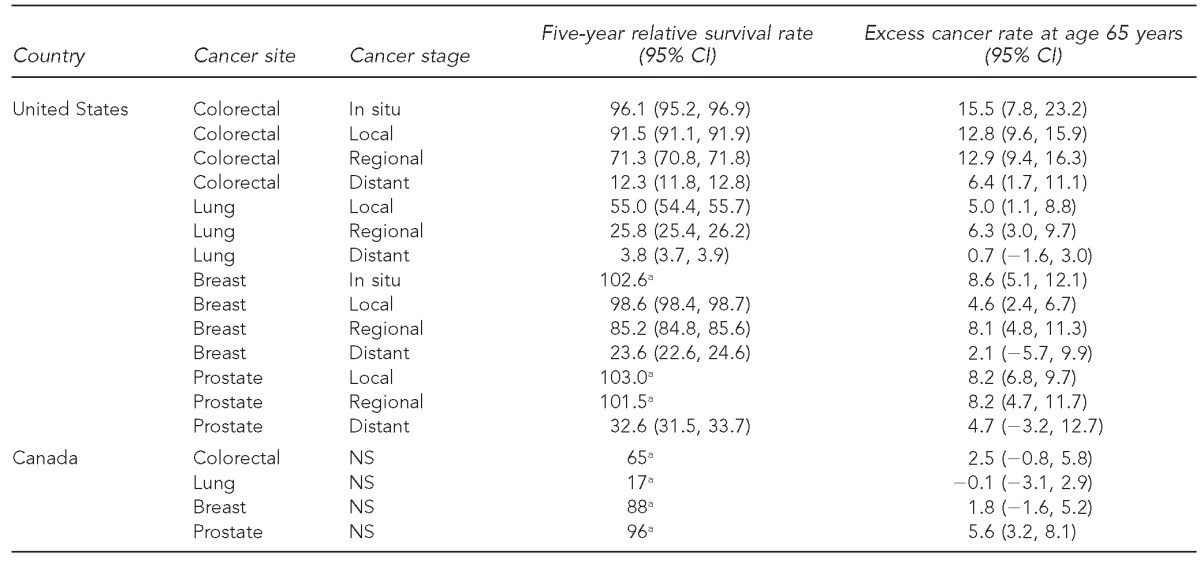
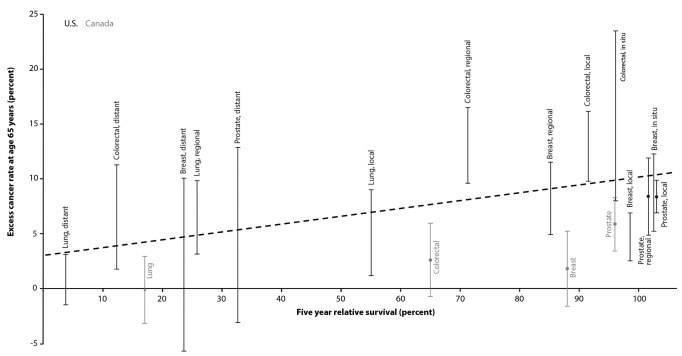
In the Table, the above-expected cancer rates at age 65 years are expressed as a percentage and stratified by site and stage. For the U.S. data, colorectal cancer showed the largest effect, with all stages but distant stage in the 13%–16% range and distant stage also elevated at 6%. Breast, prostate, and lung cancers also showed elevations in roughly the 5%–9% range for the local and regional stages. For the Canadian data, an elevation of 6% was seen for prostate cancer and a smaller elevation (3%) was suggested for colorectal cancer. In Figure 2, these results were related to five-year relative survival, which ranged from 4% (distant-stage lung cancer) to 100% (several site-stage combinations). For the U.S. data, a strong positive correlation was evident between survival and the excess rate at age 65 years (r2=0.41 using simple linear least-squares regression).
Table.
Five-year cause-specific survival and above-expected cancer rates at age 65 years, United States and Canada, 2000–2010

aSEER*Stat software does not define CIs for relative survival exceeding 100%. Additionally, Canadian survival data were published without CIs.
CI = confidence interval
NS = not specified
Figure 2.
Five-year relative survival, by cancer site and stage, relative to the excess cancer rate at age 65 years above what is predicted by a continuous age–rate function: United States and Canada, 2000–2010
DISCUSSION
Our analysis identified a spike in cancer rates at age 65 years relative to other ages from 55–75 years for the four most common cancer sites, with the magnitude of the increase related to the severity of the prognosis. These findings corroborate other research examining a range of medical conditions occurring near the age-65 boundary. Colorectal cancer showed the strongest effect, with similar values for in situ, local, and regional stage at diagnosis. Colorectal cancer is the cancer site for which screening benefits are greatest, but for which utilization rates are far from optimal. The 2010 National Health Interview Survey indicated that just 59% of those for whom screening is recommended met the USPSTF recommendations, 55% in those aged 50–64 years and 68% in those aged 65–75 years.14 Anyone diagnosed at regional or late stage as a consequence of postponing screening until age 65 years would be at significant risk of dying prematurely, and our findings suggest that more aggressive targeting of those aged 60–64 years, in particular, may yield disproportionate benefits. Conversely, the smaller spikes in early-stage prostate and breast cancers at age 65 years may represent an opposing problem—cancers unlikely to have been of concern even if they had been detected later or never detected at all. For lung cancer, which lacks a viable screening modality except among heavy smokers, we assume that diagnosis is largely symptom-driven. That an age-65 effect is seen for early-stage lung cancer suggests that some people may be postponing their diagnosis even in the presence of symptoms. As lung cancer is strongly correlated with low socioeconomic status,15 it makes sense that uninsured and underinsured patients would be overrepresented for this cancer type.
The small age-65 effects seen in the Canadian data for prostate and colorectal cancer suggest that retirement by itself is a contributor to the diagnosis of these cancers, irrespective of any change in medical insurance status. Age 65 is the modal year for retirement in both countries. It is the standard age for receiving benefits from the Canada Pension Plan and Social Security benefits in the United States (for those born during or before 1942; for those born between 1943 and 1945, it is 66 years of age).16,17 Those covered by this analysis also came of age at a time when many employers enforced mandatory retirement at 65 years of age, even though this practice was largely legally abolished by the time these employees reached age 65.18
CONCLUSION
The nature of the data used for this analysis limited our ability to tease out the precise influences that age, socioeconomic status, and insurance status have on making crucial health-care decisions near the age of 65. In future work, we intend to improve upon this precision through the use of an all-payer database under development in New York State that will allow us to compare insurance types prior to age 65 years and the type and number of procedures performed before and after this age. We will also assess the contributory roles of gender and race/ethnicity, along with findings for less common cancer sites. The present results show clearly, and perhaps counterintuitively, that the very fact of cancer is sensitive to culturally imposed age milestones.
Footnotes
The authors thank Amanda Shaw of the Public Health Agency of Canada for providing custom data for this article and Christopher Johnson of the Cancer Data Registry of Idaho for his statistical insights.
This work was supported in part by the Centers for Disease Control and Prevention (CDC) through its cooperative agreement with the New York State Cancer Registry (5U58-DP003879). The findings and conclusions in this article are those of the authors and do not necessarily represent the official position of CDC.
REFERENCES
- 1.David G, Saynisch P, Acevedo-Perez V, Neuman MD. Affording to wait: Medicare initiation and the use of health care. Health Econ. 2012;21:1030–6. doi: 10.1002/hec.1772. [DOI] [PubMed] [Google Scholar]
- 2.Card D, Dobkin C, Maestas N. The impact of nearly universal insurance coverage on health care utilization: evidence from Medicare. Am Econ Rev. 2008;98:2242–58. doi: 10.1257/aer.98.5.2242. [DOI] [PMC free article] [PubMed] [Google Scholar]
- 3.Pol LG, Mueller KJ, Adidam PT. Health insurance in the near elderly population. Popul Res Policy Rev. 2000;19:97–112. [Google Scholar]
- 4.Salloum RG, Jensen GA, Biddle AK. The “Welcome to Medicare” visit: a missed opportunity for cancer screening among women? J Womens Health (Larchmt) 2013;22:19–25. doi: 10.1089/jwh.2012.3777. [DOI] [PMC free article] [PubMed] [Google Scholar]
- 5.Card D, Dobkin C, Maestas N. Does Medicare save lives? Q J Econ. 2009;124:597–636. doi: 10.1162/qjec.2009.124.2.597. [DOI] [PMC free article] [PubMed] [Google Scholar]
- 6.Bretthauer M, Kalager M. Principles, effectiveness and caveats in screening for cancer. Brit J Surg. 2013;100:55–65. doi: 10.1002/bjs.8995. [DOI] [PubMed] [Google Scholar]
- 7.Esserman LJ, Thompson IM, Jr, Reid B. Overdiagnosis and overtreatment in cancer: an opportunity for improvement. JAMA. 2013;310:797–8. doi: 10.1001/jama.2013.108415. [DOI] [PubMed] [Google Scholar]
- 8.Preventive Services Task Force (US) Colorectal cancer: screening [cited 2014 Mar 4] Available from: URL: http://www.uspreventiveservicestaskforce.org/uspstf/uspscolo.htm.
- 9.Preventive Services Task Force (US) Breast cancer: screening [cited 2014 Mar 4] Available from: URL: http://www.uspreventiveservicestaskforce.org/uspstf/uspsbrca.htm.
- 10.Preventive Services Task Force (US) Lung cancer: screening [cited 2014 Mar 4] Available from: URL: http://www.uspreventiveservicestaskforce.org/uspstf/uspslung.htm.
- 11.Preventive Services Task Force (US) Prostate cancer: screening [cited 2015 Feb 12] Available from: URL: http://www.uspreventiveservicestaskforce.org/Page/Topic/recommendation-summary/prostate-cancer-screening.
- 12.National Cancer Institute Surveillance, Epidemiology, and End Results (SEER) program. SEER*Stat database: incidence—SEER 18 regs research data + Hurricane Katrina impacted Louisiana cases, Nov 2012 sub (2000–2010) <Katrina/Rita population adjustment>—linked to county attributes—total U.S., 1969–2011 counties, National Cancer Institute, DCCPS, Surveillance Research Program, Surveillance Systems Branch, released April 2013, based on the November 2012 submission [cited 2015 Feb 12] Available from: URL: http://seer.cancer.gov/data/citation.html.
- 13.Canadian Cancer Society Advisory Committee on Cancer Statistics. Canadian cancer statistics 2013. Toronto: Canadian Cancer Society; 2013. [Google Scholar]
- 14.Klabunde CN, Brown M, Ballard-Barbash R, White MC, Thompson T, Plescia M, et al. Cancer screening—United States, 2010. MMWR Morb Mortal Wkly Rep. 2012;61(3):41–5. [PubMed] [Google Scholar]
- 15.Sidorchuk A, Agardh EE, Aremu O, Hallqvist J, Allebeck P, Moradi T. Socioeconomic differences in lung cancer incidence: a systematic review and meta-analysis. Cancer Causes Control. 2009;20:459–71. doi: 10.1007/s10552-009-9300-8. [DOI] [PubMed] [Google Scholar]
- 16.Social Security Administration (US) Retirement age calculator [cited 2014 Mar 17] Available from: URL: http://www.ssa.gov/pubs/ageincrease.htm.
- 17.Service Canada. How your age will affect your monthly payment [cited 2014 Mar 17] Available from: URL: http://www.servicecanada.gc.ca/eng/services/pensions/cpp/retirement/age.shtml.
- 18.Cooke M. Policy changes and the labour force participation of older workers: evidence from six countries. Can J Aging. 2006;25:387–400. doi: 10.1353/cja.2007.0015. [DOI] [PubMed] [Google Scholar]


