

Abstract
Purpose
Cardiovascular disease (CVD) is a macrovascular complication in patients with type 2 diabetes mellitus (T2DM). To date, glycemic control profiles of antidiabetic drugs in cardiovascular (CV) complications have not been clearly elucidated. Therefore, this study was conducted retrospectively to assess the association of antidiabetic drugs and glycemic control with CV profiles in T2DM patients. The association of concurrent medications and comorbidities with glycemic control was also investigated.
Methods
A total of 220 T2DM patients from the University of Malaya Medical Centre, Malaysia, who had at least one CV complication and who had been taking at least one antidiabetic drug for at least 3 months, were included. The associations of antidiabetics, cardiovascular diseases, laboratory parameters, concurrent medications, comorbidities, demographics, and clinical characteristics with glycemic control were investigated.
Results
Sulfonylureas in combination (P=0.002) and sulfonylurea monotherapy (P<0.001) were found to be associated with good glycemic control, whereas insulin in combination (P=0.051), and combination biguanides and insulin therapy (P=0.012) were found to be associated with poor glycemic control. Stroke (P=0.044) was the only type of CVD that seemed to be significantly associated with good glycemic control. Other factors such as benign prostatic hyperplasia (P=0.026), elderly patients (P=0.018), low-density lipoprotein cholesterol levels (P=0.021), and fasting plasma glucose (P<0.001) were found to be significantly correlated with good glycemic control.
Conclusion
Individualized treatment in T2DM patients with CVDs can be supported through a better understanding of the association between glycemic control and CV profiles in T2DM patients.
Keywords: glycemic control, antidiabetic drugs, type 2 diabetes mellitus, cardiovascular disease
Introduction
Diabetes mellitus (DM) is a chronic disease and a growing epidemic that has become a global public health concern.1 Approximately 366 million people worldwide have DM, and this number is expected to increase to 552 million adults by 2030.2 According to the National Diabetes Information Clearing house and the World Health Organization, up to 90% of diabetics have type 2 diabetes mellitus (T2DM). The epidemiology of T2DM has risen from 20.8% in 2011 to 22.9% in 2013 among adults 30 years and older in Malaysia.3
T2DM is associated with chronic complications that are subdivided into microvascular and macrovascular complications.4 Cardiovascular disease (CVD), which is a common macrovascular complication, is a major cause of mortality and morbidity in T2DM patients, representing approximately 50% of all fatalities.4 According to the World Heart Federation, people with diabetes are 2–4 times more likely to develop CVDs.5
Intensive glycemic control that targets a glycated hemoglobin (A1C) of 7% and below can help to prevent or slow the progression of microvascular complications such as diabetic retinopathy and chronic kidney disease (CKD) in T2DM patients.4 In contrast, there is limited information on the association between glycemic control and macrovascular diseases such as CVDs.6 The glycemic control profiles of antidiabetic drugs in various cardiovascular complications have not been clearly elucidated.
Although the role of antidiabetic drugs in CVD progression in T2DM patients has not been determined, some studies have shown that some antidiabetic agents cause an improvement in CVD progression in these patients. For example, glucagon-like peptide-1 (GLP-1) receptor agonists can reduce A1C by approximately 1%–1.5% via glucose-dependent secretion of insulin.7 Glucose-dependent secretion of insulin can then help to increase glucose use and intensify the metabolic control, which improves myocardial metabolism and myocardial function.8 A study showed that a 72-hour infusion with the GLP-1 receptor agonist in human subjects with acute myocardial infarction improved the left ventricular ejection fraction (LVEF).9 Sokos et al10 demonstrated that a 5-week infusion of GLP-1 receptor agonist in both diabetic and chronic heart failure (HF) patients (New York Heart Association [NYHA] class III and IV) significantly improved LVEF in patients with HF.
Metformin is a first-line oral antidiabetic drug used in type 2 diabetes therapy that decreases hepatic glucose production and increases glucose utilization.11 Shah et al12 found that glycemic control with metformin significantly improved the LVEF in patients with advanced systolic HF (NYHA class III and IV) during a 6-month follow-up. Soraya et al13 showed that metformin (25 mg/kg) lowered left ventricular end-diastolic pressure in rats with isoproterenol-induced myocardial infarction. Thus, antidiabetic drugs can be used to improve the clinical parameters of various cardiovascular (CV) complications in T2DM patients.
This study aims to: 1) assess the association between glycemic control, antidiabetic drugs and ischemic heart disease (IHD), acute coronary syndrome (ACS), HF, atrial fibrillation (AF), and/or stroke in T2DM patients; 2) study the association of glycemic control and comorbidities that presented in T2DM patients with IHD, ACS, HF, AF, and/or stroke; and 3) determine the association between glycemic control and concomitant medications taken by T2DM patients with IHD, ACS, HF, AF, and/or stroke. Data obtained from this study may be used to improve the CV profile in T2DM patients by improving glycemic control and the use of antidiabetic agents. The results could enhance our understanding of the association between glycemic control, antidiabetic agents and the profile of CV complications in T2DM patients. This study promotes and supports the concept of pharmaceutical care and individualized treatment in T2DM patients with CV complications.
Material and methods
Study design and setting
This retrospective study was conducted at the University of Malaya Medical Centre (UMMC), Malaysia, a premier teaching hospital in Malaysia with 1,200 beds. The study was conducted in accordance with the Declaration of Helsinki and was approved by the medical ethics committee of the UMMC (reference number 1031.38). The medical ethics committee of the UMMC waived the need for written informed consent from the participants.
Sample population, size, and time frame
The population of this study consisted of T2DM patients at UMMC, who had CV complications and who had been taking at least one antidiabetic drug for at least 3 months.
The sampling time frame for this study was 5 years, from January 1, 2009 to March 31, 2014. The minimum sample size for this study was calculated using the Epi Info Program Version 7.0 (CDC, Atlanta, GA, USA). The level of significance, α, was set at 0.05, and the desired power of the study, 1–β, was 80%. Assuming that the expected proportion of T2DM patients on antidiabetic medications was 22.9% and the confidence limit was 5%, the minimum sample size was 116 patients.
Study population and procedures
The potential patient population included a total of 1,167 patients whose registration numbers were identified using the Hospital Information System, based on the International Statistical Classification of Diseases Tenth Revision (ICD-10) for T2DM (E 11.0–E 11.8). A total of 220 patients fulfilled the inclusion criteria, as shown in Table 1, and they were included in the study.
Table 1.
Inclusion and exclusion criteria of the study
| Inclusion criteria |
| 1) Patients who were diagnosed with T2DM. |
| 2) Patients who were diagnosed with at least one cardiovascular complication (IHD, ACS, HF, AF, and/or stroke). |
| 3) Patients who were prescribed at least one oral antidiabetic agent and/or insulin. |
| 4) Patients who received antidiabetic therapy for at least 3 months. |
| Exclusion criteria |
| 1) Patients who received nonpharmacological therapy/diet. |
| 2) Patients who were below 18 years old. |
Abbreviations: T2DM, type 2 diabetes mellitus; IHD, ischemic heart disease; ACS, acute coronary syndrome; HF, heart failure; AF, atrial fibrillation.
Data collection forms were used to record patient data. Types of CV complications included in the study were IHD, ACS, HF, AF, and stroke. Patient demographic information such as age, sex, ethnicity, height, weight, and body mass index (BMI) was collected. Other patient data such as comorbidity, duration of diabetes, social history (such as smoking and alcohol consumption), laboratory results, medication regimen, and concurrent medications were also collected and reviewed (Table 2).
Table 2.
Definitions used in the study
| Terms | Definition |
|---|---|
| Cardiovascular complications | One of the macrovascular complications that occurred in T2DM patients that involves heart and blood vessels, such as coronary heart disease, cerebrovascular disease, peripheral arterial disease, rheumatic heart disease, congenital heart disease as well as deep vein thrombosis and pulmonary embolism.4 |
| Comorbidities | Diseases or other pathological processes that occur simultaneously with another and require long-term treatment.42 |
| Good glycemic control | Targeted A1C levels below 8% within 3 months.4 |
| Poor glycemic control | Undesirable A1C levels at 8% and above within 3 months.4 |
Abbreviations: T2DM, type 2 diabetes mellitus; A1C, glycated hemoglobin.
Statistical analysis
All statistical analyses were performed using the statistical software Statistical Package for Social Science (SPSS), version 20 (IBM SPSS Inc., Chicago, IL, USA). Descriptive statistics such as frequencies, percentages, means, ranges and standard deviations (SD) were used to describe the data. Categorical data were expressed as the absolute number and percentage, whereas continuous data were expressed as the mean ± SD if normally distributed or as the median (interquartile range) if skewed. The Kolmogrov–Smirnov test or the Shapiro–Wilk test was used to test the normality of continuous data. The Pearson chi-square test with continuity correction was used to examine the association between categorical variables. When the expected cell count was more than 20% or less than 5, the Fisher exact test was used. Cramer’s V correlation test was used to examine the correlation between two nominal groups, such as antidiabetic regimens and A1C. The Pearson correlation was used to examine the correlation between two continuous data groups, such as low-density lipid and A1C. The significance level was accepted at P<0.05. The summarized findings are presented in Figure 1.
Figure 1.

Overview of methodology.
Abbreviations: UMMC, University of Malaya Medical Centre; T2DM, type 2 diabetes mellitus; ICD-10, International Statistical Classification of Diseases Tenth Revision.
Results
Demographic characteristics
A total of 1,167 T2DM patients fulfilled the requirement of ICD-10 (E 11.0–E 11.8) from January 1, 2009 to March 31, 2014, and 988 patients were selected through convenient sampling. Of the 520 patients whose medical records were successfully retrieved, 220 fulfilled the inclusion criteria. The study population consisted of slightly more (8.2%) male than female patients. The largest ethnic population in this study was Indian, followed by Malay, Chinese, and others.
As shown in Table 3, the patients’ age was normally distributed when tested using the Kolmogrov–Smirnov test, with a mean ± SD age of 64.7±11.4 years (range, 36–91 years). There were more nonelderly patients (54.1%) than elderly patients (49.5%) in the study.
Table 3.
Demographic characteristics of patients (N=220)
| Demographic characteristics (N=220) | Number (percentage, %) |
|---|---|
| Sex | |
| Male | 119 (54.1) |
| Female | 101 (45.9) |
| Age | |
| Nonelderly | 111 (50.5) |
| Elderly | 109 (49.5) |
| Ethnicity | |
| Malay | 81 (36.8) |
| Chinese | 55 (25.0) |
| Indian | 83 (37.7) |
| Other | 1 (0.5) |
| Body mass index (BMI) | |
| Underweight (<18.5) | 2 (0.9) |
| Normal range (18.5–22.9) | 25 (11.4) |
| Preobese (23.0–27.4) | 34 (15.5) |
| Obese (≥27.5) | 42 (19.1) |
| Unknown | 117 (53.2) |
Note: BMI classification is based on Clinical Practice Guidelines on Management of Obesity.43
BMI was available for 94 patients (47.3%). The BMI was normally distributed, with a mean ± SD of 26.5±4.7 kg/m2 (range, 18.20–38.97 kg/m2). Most of the study subjects were obese, followed by preobese, normal range, and underweight.
Clinical characteristics
Most patients with CV complications had had T2DM for more than 20 years (Table 4). A total of 65.9% of patients were nonsmokers. IHD had the highest frequency of CVD types. This was followed by ACS, stroke, HF, and AF. Non-ST-elevation myocardial infarction was the most common type of ACS, followed by unstable angina and ST-elevation myocardial infarction. The NYHA class IV was the most common type of HF, followed by NYHA III, II, and I.
Table 4.
Clinical characteristic of patients (N=220)
| Clinical characteristics (N=220) | Number (percentage, %) |
|---|---|
| Duration of T2DM (years) | |
| <1 | 3 (1.4) |
| 1–5 | 17 (7.7) |
| 6–10 | 36 (16.4) |
| 11–15 | 29 (13.2) |
| 16–20 | 18 (8.2) |
| >20 | 53 (24.1) |
| Unknown | 64 (29.1) |
| Smoking status | |
| Yes | 25 (11.4) |
| No | 145 (65.9) |
| Ex-smoker | 38 (17.3) |
| Unknown | 12 (5.5) |
| Types of CVDsa | |
| IHD | 172 (78.2) |
| ACS | 115 (52.3) |
| NSTEMI | 60 (52.7) |
| STEMI | 18 (15.5) |
| UA | 38 (32.8) |
| HF | 29 (13.2) |
| NYHA I | 5 (16.7) |
| NYHA II | 6 (20.0) |
| NYHA III | 8 (26.7) |
| NYHA IV | 11 (36.7) |
| AF | 12 (5.5) |
| Stroke | 49 (22.3) |
Note:
Each patient may have more than one type of CVD.
Abbreviations: CVDs, cardiovascular diseases; IHD, ischemic heart disease; ACS, acute coronary syndrome; NSTEMI, non-ST-elevation myocardial infarction; STEMI, ST-elevation myocardial infarction; UA, unstable angina; HF, heart failure; NYHA, New York Heart Association; AF, atrial fibrillation; T2DM, type 2 diabetes mellitus.
Laboratory parameters
LVEF data were available for 125 patients (Table 5). The data were normally distributed and the mean LVEF was 49.0%±19.7% (range, 10.0%–85.0%).
Table 5.
Laboratory parameters
| Variables | N | Values |
|---|---|---|
| LVEF (%) | ||
| Increased LVEF (>75%) | 220 | 13 (5.9) |
| Normal LVEF (50%–75%) | 53 (24.1) | |
| Moderately reduced (30%–49%) | 34 (15.5) | |
| Severely reduced (<30%) | 24 (10.9) | |
| Unknown | 96 (43.6) | |
| A1C (%) | ||
| <8.0% | 220 | 25 (56.8) |
| ≥8.0% | 95 (43.2) | |
| FBG (mmol/L) | 195 | 10.2 (5.0) |
| Lipid profile | ||
| Total cholesterol (mmol/L) | 211 | 4.4 (1.3) |
| HDL (mmol/L) | 211 | 1.0 (0.8–1.3) |
| LDL (mmol/L) | 210 | 2.4 (1.8–3.1) |
| Triglyceride (mmol/L) | 210 | 1.6 (1.8–3.1) |
| Blood pressure (BP) | ||
| SBP (mmHg) | 142 | 144 (25.3) |
| DBP (mmHg) | 142 | 74 (66.8–84.0) |
| Cardiac biomarker | ||
| CK (U/L) | 199 | 121.0 (76.0–243.0) |
| CK-MB (U/L) | 196 | 2.0 (1.0–4.0) |
| TnI (ng/L) | 154 | 0.1 (0.0–0.9) |
Notes: Values presented as mean (SD) if normally distributed or median (interquartile range) if skewed for continuous data; n (%) for categorical data.
Abbreviations: LVEF, left ventricular ejection fraction; A1C, glycated hemoglobin; FBG, fasting blood glucose; HDL, high-density lipoprotein; LDL, low-density lipoprotein; SBP, systolic blood pressure; DBP, diastolic blood pressure; CK, creatine kinase; CK-MB, creatine kinase-MB; TnI, Troponin-I.
Overall, the majority (56.8%) of patients had achieved the target glycemic control (A1C <8.0%). A1C was normally distributed, and the mean A1C was 8.1%±2.0%.
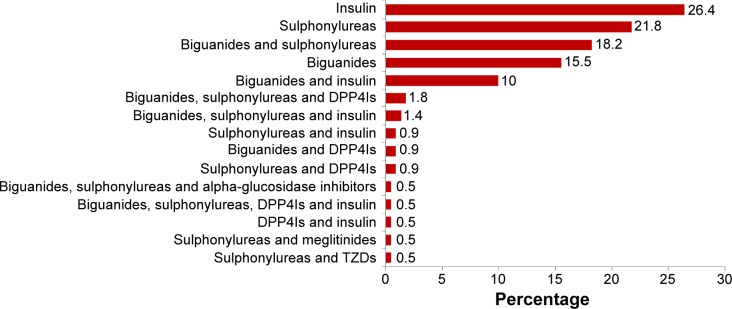
Antidiabetic regimens
Figure 2 shows the patients’ antidiabetic regimens. Insulin monotherapy was the most commonly used antidiabetic regimen in this study, followed by sulfonylurea monotherapy, and biguanide and sulfonylurea combination therapy.
Figure 2.
Antidiabetic regimens.
Abbreviations: DPP4Is, dipeptidyl peptidase-4 inhibitors; TZDs, thiazolidinediones.
Figure 3 shows the patients’ biguanide regimen. Metformin 500 mg twice daily was the most common dosing regimen in the biguanide-treated group. This was followed by metformin 850 mg extended-release twice daily and metformin 850/1,700 mg twice daily.
Figure 3.

Dosing regimen of biguanides.
Abbreviations: MTF, metformin; XR, extended release; OD, once daily; BD, twice daily; ON, every night.
Figure 4 shows the patients’ sulfonylurea regimen. For the sulfonylurea-treated group, gliclazide 60 mg modified-release (MR) once daily was used most frequently. This was followed by gliclazide 30 mg MR once daily and gliclazide 120 mg MR once daily.
Figure 4.

Dosing regimen of sulfonylureas.
Abbreviations: OD, once daily; BD, twice daily; MR, modified release; ON, every night.
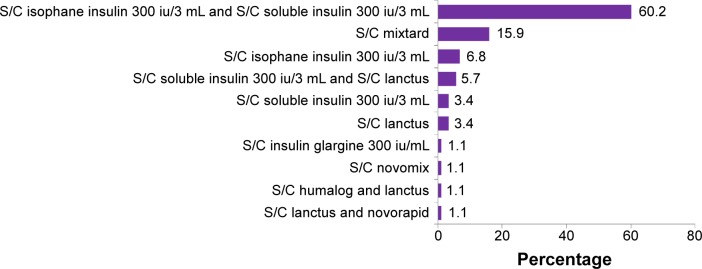
Figure 5 shows the patients’ insulin regimen. For the insulin-treated group, most patients were taking a combination of isophane insulin and soluble insulin subcutaneously. This was followed by a subcutaneous (S/C) mixtard and S/C isophane insulin alone.
Figure 5.
Dosing regimen of insulin.
Abbreviation: S/C, subcutaneous.
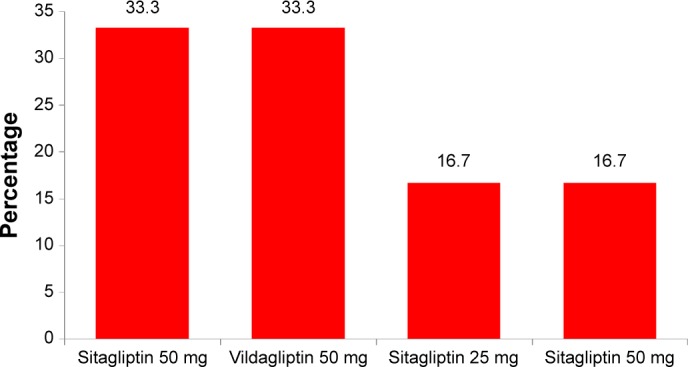
Figure 6 shows the patients’ dipeptidyl peptidase-4 (DPP-4) inhibitor regimen. Sitagliptin 50 mg and Vildagliptin 50 mg were the two most commonly used DPP-4 inhibitors in the DPP-4 inhibitor-treated group.
Figure 6.
Dosing regimen of DPP-4 inhibitors.
Abbreviation: DPP-4 inhibitors, dipeptidyl peptidase-4 inhibitors.
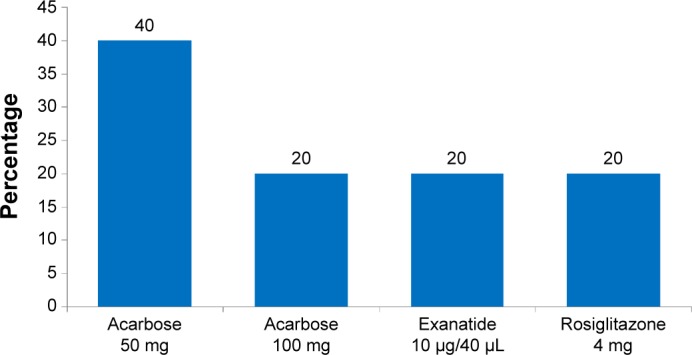
Figure 7 shows the other antidiabetic agents with their dosing regimens. In this study, only two patients received acarbose 50 mg, one patient received acarbose 100 mg (α-glucosidase inhibitor), one patient received exanatide 10 μg/40 μL (glucose-like peptide-1 agonist), and one patient received rosiglitazone 4 mg (thiazolidinedione).
Figure 7.
Dosing regimen of other antidiabetic regimens.
Comorbidities
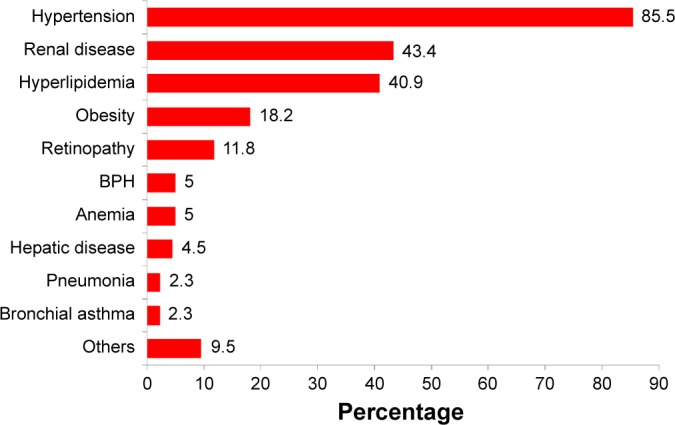
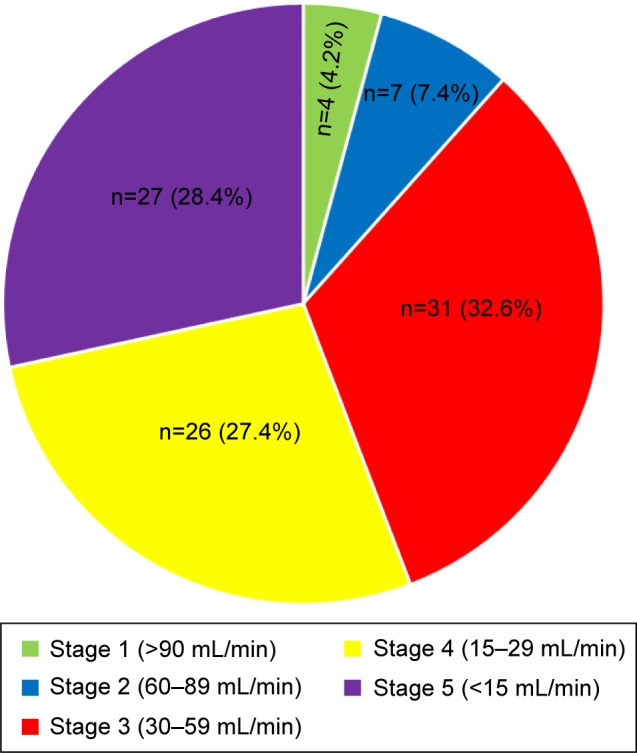
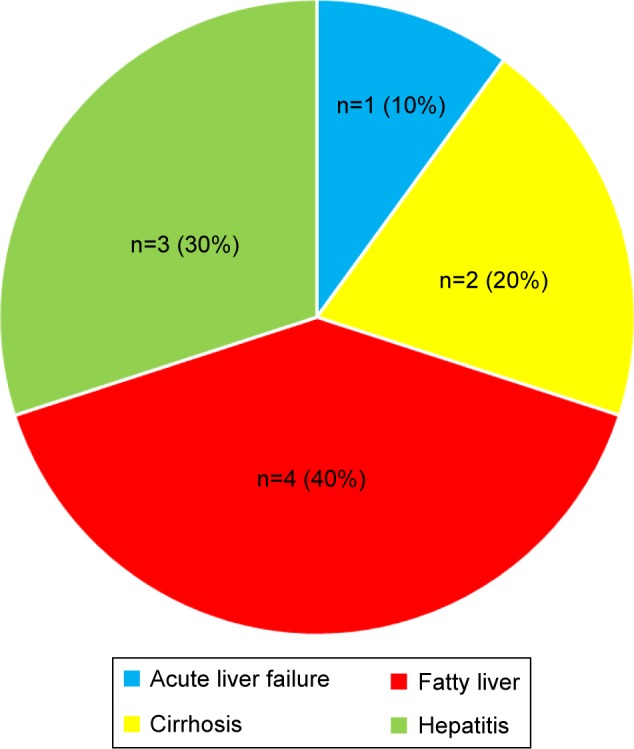
Figure 8 illustrates the common comorbidities in T2DM patients with CV complications. All patients with comorbidities had multiple comorbidities. Hypertension accounted for the highest percentage among all categories of comorbidities. This was followed by renal disease, hyperlipidemia, obesity, and retinopathy. Figure 9 shows that most patients with renal disease had CKD stage 3 (30–59 mL/min), followed by CKD stages 4 and 5. Only five patients (2.3%) had pneumonia, and ten (4.5%) had hepatic disease. Of the five patients with pneumonia, three had hospital-acquired pneumonia, and two had community-acquired pneumonia infections. Fatty liver was the most common hepatic disease, followed by hepatitis and cirrhosis (Figure 10). Other comorbidities included dementia (four cases), hypothyroidism (three), eye cataract (three), urinary tract infection (two), breast cancer (two), chronic obstructive pulmonary disease (one), gastritis (one), cholelithiasis (one), recurrent venous thrombosis (one), peptic ulcer disease (one), pulmonary tuberculosis (one), and osteoporosis (one). Only eleven patients (5%) were without any comorbidity.
Figure 8.
Comorbidities in T2DM patients with CVDs.
Note: Each patient may have more than one comorbidity.
Abbreviations: BPH, benign prostate hyperplasia; CVD, cardiovascular disease; T2DM, type 2 diabetes mellitus.
Figure 9.
Stage of chronic kidney disease.
Figure 10.
Types of liver disease.
Concurrent medications
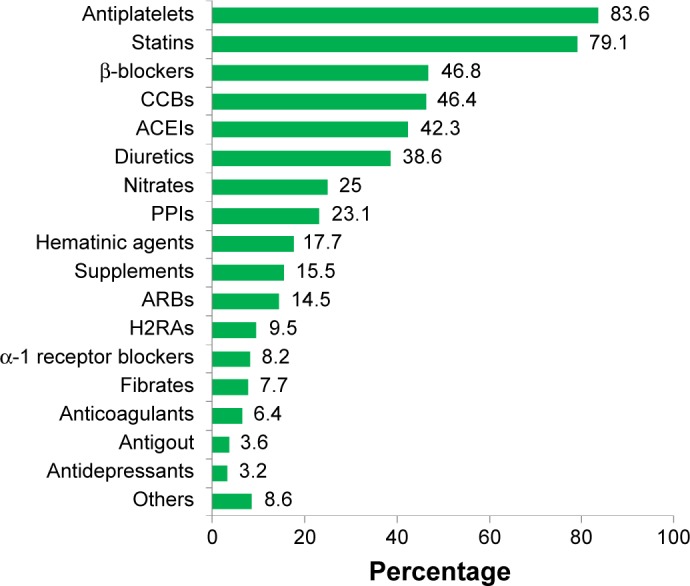
The pattern of concurrent medication use in T2DM patients with CV complications is summarized in Figure 11. Most patients had received antiplatelet therapy and statins as concurrent medications. Other concurrent medications included lactulose (two cases), bisacodyl (two), phenytoin (one), morphine (one), L-thyroxine (one), Renifer (vitamin B9 1.5 mg, zinc sulfate 61.8 mg and carbonyl iron 100 mg) (one), phenytoin (one), etoricoxib (one), Berodual metered-dose inhaler (one), Budesonide metered-dose inhaler (one), methyldopa (one), unasyn (one), piriton (one), cetirizine (one), motilim (one), duodart (dutasteride and tamsulosin HCl) (one), and gabapentin (one). Supplements included multivitamins, calcitriol, calcium bicarbonate, vitamin B complex, and Ketosteril.
Figure 11.
Concurrent medications in T2DM patients with cardiovascular disease.
Note: Each patient may take more than one concurrent medication.
Abbreviations: H2RAs, histamine 2 receptor antagonists; PPIs, proton pump inhibitors; ACEIs, angiotensin converting enzyme inhibitors; ARBs, angiotensin receptor blockers; T2DM, type 2 diabetes mellitus; CCBs, calcium channel blockers.
Association between antidiabetic regimens and glycemic control
There was a strong correlation between antidiabetic regimens and the A1C level (χ2=0.33, P=0.002). There was a significant association between glycemic control and insulin use (χ2=20.4, df=1, P<0.001) as well as combination sulfonylurea therapy (χ2=9.4, df=1, P=0.002; Table 6). In addition, sulfonylurea monotherapy (χ2=14.173, df=1, P<0.001) and the combination of biguanides and insulin were significantly associated with glycemic control (χ2=9.8, df=1, P=0.006). In this study, sulfonylureas were associated with good glycemic control, whereas insulin was associated with poor glycemic control. The combination of biguanides and insulin was also associated with poor glycemic control.
Table 6.
Association between antidiabetic regimens and glycemic control
| Antidiabetic regimens | A1C level (n, %)
|
P-valuea | |
|---|---|---|---|
| <8.0% | ≥8.0% | ||
| Biguanides | |||
| Yes | 52 (49.5) | 53 (50.5) | P=0.051b |
| No | 73 (63.5) | 42 (36.5) | |
| Sulfonylureas (in combination) | |||
| Yes | 72 (60.2) | 34 (32.1) | P=0.002b,* |
| No | 53 (46.5) | 61 (53.5) | |
| Meglitinides | |||
| Yes | 1 (100.0) | 0 (0.0) | P=1.000c |
| No | 124 (56.6) | 95 (43.4) | |
| TZDs | |||
| Yes | 0 (0.0) | 1 (100.0) | P=0.432c |
| No | 125 (57.1) | 94 (42.9) | |
| α-glucosidase inhibitors | |||
| Yes | 0 (0.0) | 3 (100.0) | P=0.079c |
| No | 125 (57.6) | 92 (42.4) | |
| GLP-1 agonists | |||
| Yes | 1 (100.0) | 0 (0.0) | P=1.000c |
| No | 124 (56.6) | 95 (43.4) | |
| DPP-4 inhibitors | |||
| Yes | 7 (58.3) | 5 (41.7) | P=1.000c |
| No | 118 (56.7) | 90 (43.3) | |
| Insulin (in combination) | |||
| Yes | 35 (39.8) | 53 (60.2) | P<0.001b,* |
| No | 90 (68.2) | 42 (31.8) | |
| Biguanides monotherapy | |||
| Yes | 19 (55.9) | 15 (44.1) | P=1.000b |
| No | 106 (57.0) | 80 (43.0) | |
| Sulfonylureas monotherapy | |||
| Yes | 40 (28.4) | 10 (21.6) | P<0.001b,* |
| No | 85 (50.0) | 85 (50.0) | |
| Insulin monotherapy | |||
| Yes | 27 (46.6) | 31 (53.4) | P=0.092b |
| No | 98 (60.5) | 64 (39.5) | |
| Biguanides and sulfonylureas | |||
| Yes | 25 (62.5) | 15 (37.5) | P=0.532b |
| No | 100 (55.6) | 80 (44.4) | |
| Biguanides and insulin | |||
| Yes | 6 (28.6) | 15 (71.4) | P=0.012b,* |
| No | 119 (59.8) | 80 (40.2) | |
| Biguanides, sulfonylureas, and DPP-4 inhibitors | |||
| Yes | 2 (40.0) | 3 (60.0) | P=0.654c |
| No | 123 (57.2) | 92 (42.8) | |
| Sulfonylureas and insulin | |||
| Yes | 1 (50.0) | 1 (50.0) | P=1.000c |
| No | 124 (56.9) | 94 (43.1) | |
| Biguanides, sulfonylureas, and insulin | |||
| Yes | 0 (0.0) | 2 (100.0) | P=0.185c |
| No | 125 (57.3) | 93 (42.7) | |
| Biguanides, sulfonylureas, DPP-4 inhibitors, and insulin | |||
| Yes | 1 (100.0) | 0 (0.0) | P=1.000c |
| No | 124 (56.6) | 95 (43.4) | |
| DPP-4 inhibitors and insulin | |||
| Yes | 1 (100.0) | 0 (0.0) | P=1.000c |
| No | 124 (56.6) | 95 (43.4) | |
| Biguanides and DPP-4 inhibitors | |||
| Yes | 1 (50.0) | 1 (50.0) | P=1.000c |
| No | 124 (56.9) | 94 (43.1) | |
| Biguanides, sulfonylureas, and α-glucosidase inhibitors | |||
| Yes | 0 (0.0) | 2 (100.0) | P=0.185c |
| No | 125 (57.3) | 93 (42.7) | |
| Sulfonylureas and meglitinides | |||
| Yes | 2 (100.0) | 0 (0.0) | P=0.507c |
| No | 123 (56.4) | 95 (43.6) | |
| Sulfonylureas and TZDs | |||
| Yes | 1 (50.0) | 1 (50.0) | P=1.000c |
| No | 124 (56.9) | 94 (43.1) | |
| Sulfonylureas and DPP-4 inhibitors | |||
| Yes | 3 (57.1) | 3 (42.9) | P=1.000c |
| No | 121 (56.8) | 92 (43.2) | |
Notes:
Degree of freedom =1;
Pearson chi-square test with continuity correction;
Fisher exact test;
statistically significant (P<0.05).
Abbreviations: A1C, glycated hemoglobin; GLP-1 agonists, glucose-like peptide-1 agonists; DPP-4 inhibitors, dipeptidyl peptidase-4 inhibitors; TZDs, thiazolidinediones.
Association between cardiovascular diseases and glycemic control
The association between CVDs and glycemic control was explored (Table 7). Stroke was the only type of CVD found to be associated with glycemic control (χ2=4.060, df=1, P=0.044). A higher proportion of patients with stroke had good glycemic control.
Table 7.
Association between CV complications and glycemic con trol (A1C level)
| CVDs | A1C level (n, %)
|
P-valuea | |
|---|---|---|---|
| <8.0% | ≥8.0% | ||
| IHD | |||
| Yes | 93 (97.7) | 79 (45.9) | P=0.164b |
| No | 32 (66.7) | 16 (33.3) | |
| ACS | |||
| Yes | 66 (57.4) | 49 (42.6) | P=0.892b |
| No | 59 (56.2) | 46 (43.8) | |
| HF | |||
| Yes | 17 (58.6) | 12 (41.4) | P=0.449c |
| No | 106 (56.1) | 83 (43.9) | |
| AF | |||
| Yes | 10 (83.3) | 2 (16.7) | P=0.073c |
| No | 115 (55.3) | 93 (44.7) | |
| Stroke | |||
| Yes | 34 (69.4) | 15 (30.6) | P=0.044b,* |
| No | 91 (53.2) | 80 (46.8) | |
Notes:
Degree of freedom =1;
continuity correction;
Fisher exact test;
statistically significant (P<0.05).
Abbreviations: CV, cardiovascular; CVDs, cardiovascular diseases; IHD, ischemic heart disease; ACS, acute coronary syndrome; HF, heart failure; AF, atrial fibrillation; A1C, glycated hemoglobin.
Association between laboratory parameters and glycemic control
Table 8 shows the correlation between laboratory parameters and glycemic control. There was a significant correlation between low-density lipoprotein (LDL) and glycemic control (r2=0.159, P=0.021). The correlation coefficient (r) was +0.159, which indicates a positive, but weak, correlation. Fasting blood glucose was significantly correlated with glycemic control (r2=0.418, P<0.001). The correlation coefficient (r) was +0.418, which showed a positive, but weak, correlation.
Table 8.
Correlation between laboratory parameters and glycemic control
| Laboratory parameters | P-value |
|---|---|
| LVEF | 0.155 |
| CK | 0.248 |
| CKMB | 0.275 |
| Troponin-I | 0.084 |
| TG | 0.188 |
| LDL | 0.021* |
| HDL | 0.835 |
| TC | 0.107 |
| SBP | 0.773 |
| DBP | 0.352 |
| FBG | <0.001* |
Note:
Computed using Pearson Correlation and statistically significant (P<0.05).
Abbreviations: LVEF, left ventricular ejection fraction; CK, creatinine kinase; CKMB, creatinine kinase-MB; TG, triglyceride; LDL, low-density lipoprotein; HDL, high-density lipoprotein; TC, total cholesterol; SBP, systolic blood pressure; DBP, diastolic blood pressure; FBG, fasting blood glucose.
Association between concurrent medications and glycemic control
The association between concurrent medications and glycemic control (A1C) in T2DM patients with CVDs is presented in Table 9. No concurrent class of drugs was significantly associated with glycemic control.
Table 9.
Association between concurrent medications and glycemic control
| Concurrent medications | A1C level (n, %)
|
P-valuea | |
|---|---|---|---|
| <8.0% | ≥8.0% | ||
| ACEI | |||
| Yes | 51 (54.8) | 42 (45.2) | P=0.712b |
| No | 74 (58.3) | 53 (41.7) | |
| ARB | |||
| Yes | 16 (50.0) | 16 (50.0) | P=0.516b |
| No | 109 (58.0) | 79 (42.0) | |
| β-blocker | |||
| Yes | 64 (61.5) | 40 (38.5) | P=0.229b |
| No | 61 (52.6) | 55 (47.4) | |
| CCB | |||
| Yes | 61 (59.2) | 42 (40.8) | P=0.590b |
| No | 64 (54.7) | 53 (45.3) | |
| Diuretics | |||
| Yes | 45 (52.9) | 40 (47.1) | P=0.462b |
| No | 79 (59.0) | 55 (41.0) | |
| Nitrate | |||
| Yes | 31 (55.4) | 25 (44.6) | P=0.921b |
| No | 94 (57.3) | 70 (42.7) | |
| Fibrate | |||
| Yes | 8 (47.1) | 9 (52.9) | P=0.398b |
| No | 117 (58.2) | 85 (42.3) | |
| Statin | |||
| Yes | 100 (57.1) | 75 (42.9) | P=0.982b |
| No | 25 (55.6) | 20 (44.4) | |
| α-receptor blocker | |||
| Yes | 11 (61.1) | 7 (38.9) | P=0.892b |
| No | 114 (56.4) | 88 (43.6) | |
| Anticoagulants | |||
| Yes | 8 (57.1) | 6 (42.9) | P=1.000b |
| No | 117 (56.8) | 89 (44.6) | |
| Antiplatelets | |||
| Yes | 103 (55.4) | 12 (35.3) | P=0.411b |
| No | 22 (64.7) | 12 (35.3) | |
| Hematinic agents | |||
| Yes | 25 (61.4) | 14 (35.9) | P=0.404b |
| No | 100 (55.2) | 81 (44.8) | |
| Supplements | |||
| Yes | 21 (63.6) | 12 (36.4) | P=0.505b |
| No | 104 (55.6) | 83 (44.4) | |
| Gout preparations | |||
| Yes | 7 (87.5) | 1 (12.5) | P=0.142c |
| No | 118 (55.7) | 94 (44.3) | |
| H2RA | |||
| Yes | 15 (71.4) | 6 (28.6) | P=0.242b |
| No | 110 (55.6) | 89 (44.9) | |
| PPI | |||
| Yes | 34 (66.7) | 17 (33.3) | P=0.145b |
| No | 91 (53.8) | 78 (46.2) | |
| Antidepressants | |||
| Yes | 3 (50.0%) | 3 (50.0) | P=1.000c |
| No | 121 (56.8) | 92 (43.2) | |
Notes:
Degree of freedom =1;
Pearson chi-square test with continuity correction;
Fisher exact test.
Abbreviations: ACEI, angiotensin converting enzyme inhibitor; ARB, angiotensin receptor blocker; CCB, calcium channel blocker; H2RA, histamine 2 receptor antagonist; PPI, proton pump inhibitor; A1C, glycated hemoglobin.
Association between comorbidities and glycemic control
Benign prostatic hyperplasia (BPH) (χ2=5.485, df=1, P=0.026) was the only type of comorbidity that appeared to be significantly associated with glycemic control (Table 10). A higher proportion of patients with BPH had good glycemic control in this study compared to patients who did not obtain good glycemic control.
Table 10.
Association between comorbidities and glycemic control
| Comorbidities | A1C level (n, %)
|
P-valuea | |
|---|---|---|---|
| <8.0% | ≥8.0% | ||
| Renal disease | |||
| Yes | 59 (62.1) | 36 (37.9) | P=0.214 |
| No | 66 (52.8) | 59 (47.2) | |
| Hepatic disease | |||
| Yes | 3 (30.0) | 7 (70.0) | P=0.105b |
| No | 22 (58.1) | 88 (41.9) | |
| Retinopathy | |||
| Yes | 13 (50.0) | 13 (50.0) | P=0.592b |
| No | 112 (57.7) | 82 (42.3) | |
| BPH | |||
| Yes | 10 (90.9) | 1 (9.1) | P=0.026b,* |
| No | 115 (55.0) | 94 (45.0) | |
| Hyperlipidemia | |||
| Yes | 52 (57.8) | 38 (42.2) | P=0.920c |
| No | 73 (56.2) | 57 (43.8) | |
| Obesity | |||
| Yes | 22 (55.0) | 18 (45.0) | P=0.861c |
| No | 103 (57.2) | 77 (42.8) | |
| Pneumonia | |||
| Yes | 5 (100.0) | 0 (0.0) | P=0.071b |
| No | 120 (55.8) | 95 (44.2) | |
| Anemia | |||
| Yes | 8 (72.7) | 3 (27.3) | P=0.358b |
| No | 117 (56.0) | 92 (44.0) | |
| Hypertension | |||
| Yes | 98 (59.0) | 68 (41.0) | P=0.314c |
| No | 27 (50.0) | 27 (50.0) | |
Notes:
Degree of freedom =1;
Fisher exact test;
Pearson chi-square test with continuity correction;
statistically significant (P<0.05).
Abbreviations: A1C, glycated hemoglobin; BPH, benign prostatic hyperplasia.
Association of demographic and clinical characteristics with glycemic control
The association between demographic and clinical characteristics and glycemic control is presented in Table 11. Age (χ2=6.249, df=1, P=0.018) was found to be significantly associated with glycemic control. In this study, the elderly group was more likely to have good glycemic control compared with the nonelderly group.
Table 11.
Association between demographic and clinical characteristics and glycemic control
| Clinical and demographic characteristics | A1C level (n, %)
|
P-value | |
|---|---|---|---|
| <8.0% | ≥8.0% | ||
| Sex | |||
| Male | 66 (55.5) | 53 (44.5) | P=0.761a |
| Female | 59 (58.4) | 42 (41.6) | |
| Age | |||
| Nonelderly | 54 (48.6) | 57 (51.4) | P=0.018a,* |
| Elderly | 70 (65.4) | 37 (34.6) | |
| Ethnicity | |||
| Malay | 45 (54.9) | 37 (45.1) | P=0.344b |
| Chinese | 36 (65.5) | 19 (34.5) | |
| Indian | 43 (52.4) | 39 (47.6) | |
| Other | 1 (100.0) | 0 (0.0) | |
| BMI | |||
| Underweight (<18.5) | 1 (50.0) | 1 (50.0) | P=0.958b |
| Normal weight (18.5–22.9) | 15 (60.0) | 10 (40.0) | |
| Preobese (23.0–27.4) | 19 (55.9) | 15 (44.1) | |
| Obese (≥27.5) | 22 (52.4) | 20 (47.6) | |
| Unknown | 68 (58.1) | 49 (41.9) | |
| Smoking status | |||
| Yes | 12 (48.0) | 13 (52.0) | P=0.207b |
| No | 80 (55.2) | 65 (44.8) | |
| Ex-smoker | 23 (60.5) | 15 (39.5) | |
| Unknown | 10 (83.3) | 2 (16.7) | |
| Duration of T2DM (years) | |||
| <1 | 1 (33.3) | 2 (66.7) | P=0.185b |
| 1–5 | 10 (58.8) | 7 (41.2) | |
| 6–10 | 27 (75.0) | 9 (25.0) | |
| 11–15 | 15 (51.7) | 14 (48.3) | |
| 16–20 | 9 (50.0) | 9 (50.0) | |
| .20 | 25 (47.2) | 28 (52.8) | |
| Unknown | 38 (59.4) | 26 (40.6) | |
Notes:
Pearson chi-square test with continuity correction;
Fisher exact test;
statistically significant (P<0.05).
Abbreviation: A1C, glycated hemoglobin; T2DM, type 2 diabetes mellitus; BMI, body mass index.
Discussion
Association between antidiabetic agents and glycemic control
Sulfonylureas
This study found that sulfonylurea use was significantly associated with good glycemic control. Sulfonylureas were the most commonly used antidiabetic agent in this study population; A1C was reduced in these patients by 0.8%–2%, and fasting plasma glucose (FPG) levels were reduced by 60–70 mg/dL.7 Sulfonylureas stimulate the release of insulin from β-cells by binding to a specific sulfonylurea receptor on pancreatic β-cells.11
In this study, gliclazide modified-release (MR) was the most common drug taken in the sulfonylurea-treated group. A study by Vilar et al14 showed that gliclazide MR monotherapy significantly improved glycemic control, with a 0.9%–1.8% reduction in A1C. In addition, gliclazide MR was associated with a significantly lower rate of hypoglycemia compared with glimepiride.15 In the sulfonylurea-treated group in this study, more patients were taking glipizide than glyburide. Overall, sulfonylureas were associated with good glycemic control, which may help to improve CV profiles in T2DM patients.
Insulin
Insulin and a combination of insulin and biguanides (metformin) were associated with glycemic control. Insulin was found to be associated with poor glycemic control in this study. This is consistent with Adham et al16 who showed that patients treated with insulin or a combination of insulin and hypoglycemic agents had poor glycemic control. This may be because patients treated with insulin or a combination of insulin and other oral antidiabetic agents had more severe comorbid illnesses and uncontrolled diabetes, and thus required more aggressive treatment to control their illnesses.16
In addition, hypoglycemic effect, weight gain, and the anabolic effect of insulin also contributed to the poor glycemic control associated with insulin.16 Insulin is associated with an increased risk of hypoglycemic effects. A study by Parsaik et al17 showed that insulin contributed to the highest percentage of hypoglycemia cases requiring ambulance services. Weight gain is another common problem related to the use of insulin because of counteracting hypoglycemic complications and changing adiposity regulators.18 However, a study by Meneghini et al19 revealed that insulin detemir improved glycemic control with less hypoglycemic risk and no weight gain in T2DM patients. In this study, the combination of subcutaneous isophane insulin and soluble insulin was the most common type of insulin regimen received by patients. A study by Choi et al20 revealed that long-term continuous subcutaneous insulin infusion therapy in T2DM patients was associated with optimal glycemic control and an improvement in β-cell function.
Association between cardiovascular complications and glycemic control
In this study, stroke was the only CV complication found to be associated with glycemic control; no significant association was found between glycemic control and IHD, ACS, HF, and AF. Studies by Kauffman et al18 and Penno et al6 showed that glycemic control was not associated with CV complications. This finding was in contrast to the United Kingdom Prospective Diabetes Study (UKPDS) in which intensive glycemic control had a significantly positive effect on patients with CVD after a 10-year follow-up.21 The Heart Outcome Prevention Evaluation (HOPE) study also reported a contradictory finding, in which the glycemic level was significantly associated with incident CV complications.22 This difference could be because of the small sample size (n=220 patients) recruited in this study and the short duration of follow-up compared with the UKPDS trial and HOPE study. Thus, additional research is needed to determine a definitive association between glycemic control and CVDs.
Stroke
Stroke was found to be significantly associated with good glycemic control in this study. This finding was in contrast to the study conducted by Ray et al23 which reported that glycemic control (targeted FPG less than 6 mmol/L) had no significant effect on stroke or all-cause mortality. A systemic review conducted by Bellolio et al24 concluded that glycemic control by intravenous insulin administration in acute ischemic stroke did not significantly affect functional outcome, final neurological deficit, or death. The discrepancy may be due to some potential biases in the review process in the study by Bellolio et al24 which may cause inaccurate interpretation of results. For example, a moderate number of studies (eleven trials) were included in the analysis, and there were a small number of subjects in each study.24 A study by Baird et al25 revealed that infarcts expanded more in diabetic patients than in nondiabetic patients, which indicates that hyperglycemia was associated with a change in infarct volume. However, there was no evidence showing that a reversal in hyperglycemia could improve the prognosis in stroke.26 Because the association between glycemic control and stroke is still not clearly elucidated, further investigation is needed.
Association between laboratory parameters and glycemic control
LDL cholesterol
This study found a significant, positive correlation between A1C and elevated LDL cholesterol. This result is consistent with a study conducted by Adham et al16 which revealed that LDL cholesterol was significantly associated with glycemic control. Dyslipidemia is a common comorbidity in T2DM patients with CV complications, and LDL cholesterol is the therapeutic target for dyslipidemia treatment, which may affect glycemic control.27 However, our results did not clarify whether lipid control and glycemic control were related because the majority of patients were already on lipid-lowering regimens, such as statins and fibrates. Some studies also showed that statins can affect glycemic control in T2DM patients.28,29 For example, a study by Nakata et al28 showed that atorvastatin treatment significantly increased A1C but not FPG in diabetic patients. This was because it impaired glucose metabolism on account of insulin resistance and decreased SLC2A4 expression in white adipose tissue. This showed that atorvastatin could potentially affect glycemic control. Thus, the elevated LDL cholesterol level often adds an additional burden to patient conditions and complicates their therapies.
Association between comorbidities and glycemic control
Benign prostatic hyperplasia
There was a significant association between BPH and glycemic control in this study. There was a higher percentage of males compared with females in this study, which may explain the significant association between BPH and glycemic control. Elderly patients with BPH have a higher prevalence of CVDs than the general population,30 because BPH may be related to higher blood pressure, IHD, or other CV pathologic conditions. However, the underlying mechanisms are unclear, and further studies are needed to identify whether BPH is related to CVD.30 A study by Sarma et al31 demonstrated that there was no significant association between glycemic control and BPH characteristics such as prostate growth and prostate-specific antigen level in T2DM patients with BPH. A study by Shionoiri et al32 showed that doxazosin, which is a BPH medication, improved glucose intolerance by significantly reducing A1C. In addition, a study by Derosa et al33 showed the synergistic effects of doxazosin and acarbose, an α-glucosidase inhibitor that improves glycemic control, in patients with impaired glucose tolerance. Further research is needed to determine the relationship between BPH and glycemic control.
Association between concurrent medications and glycemic control
Statins
In this study, statins were not significantly associated with glycemic control. This was consistent with Zhou et al34 who reported that statin therapy did not significantly affect glycemic control in patients with T2DM. However, the same study showed that atorvastatin had a detrimental effect on A1C in subgroup analysis. A study by Simsek et al35 also reported the same results, ie, that high-dose atorvastatin (atorvastatin 80 mg) reduced glycemic control. In this study, less than 10% of patients received atorvastatin, which could be why the result was not significant. The majority of these patients (65.5%) received simvastatin because it had a better effect on A1C compared with atorvastatin.34 Thus, statin therapy did not affect glycemic control in this study.
Antiplatelet therapy
No significant association was found between antiplatelet therapy and glycemic control. Approximately 45% of patients were taking aspirin, and 23% were taking aspirin together with clopidogrel. A study by Singh et al36 reported that different doses of aspirin had no significant effect on inflammation, oxidative stress, insulin resistance, or endothelial function in T2DM. Thus, aspirin, which has a cardioprotective effect, did not affect glycemic control in T2DM.
Diuretics
Diuretics were not significantly associated with glycemic control. This contrasts with a study by Blackburn and Wilson,37 who showed that thiazide diuretics were associated with adverse effects on glycemic control because they decreased insulin sensitivity, resulting in increased hepatic glucose production. However, this effect was less apparent with a lower dose of thiazide (12.5–25 mg of hydrochlorothiazide) in this study, and, therefore, the result was not significant. In the diuretic-treated group, the majority of patients received furosemide (61.2%), and its effect on glycemic control was not significant. Thus, there was no significant association between diuretics and glycemic control.
Association between demographic and clinical characteristics with glycemic control
Age
In this study, elderly patients were associated with good glycemic control, and nonelderly patients were associated with poor glycemic control. This finding was consistent with several studies, which reported that a younger age was associated with worse glycemic control.16,38 In this study, there was a higher percentage of nonelderly patients than elderly patients. The younger group of patients may be less motivated to manage their diabetic condition, because they may be busy with their job and have less time to comply with a healthy lifestyle, medication, and clinic visits. Effective education and behavior medication programs should be aimed at the younger population because this group of patients may have a longer life expectancy, and it is important to prevent complications associated with diabetes.38
Duration of diabetes
The duration of diabetes in this study was not associated with glycemic control. In contrast to this finding, Ji et al39 reported that glycemic control was related to the duration of T2DM. This finding was consistent with Chan et al40 who showed that glycemic control was positively correlated with diabetes duration. When duration of T2DM increased, the number of oral antidiabetic agents also increased, and insulin therapy intensified.41
Study strength
This study has several strengths. First, in this cross-sectional and retrospective study, all factors such as antidiabetic agents and glycemic control (exposure), CV profile (outcome) and comorbidities and concurrent medications (confounders) were measured. Data were also collected on the whole study population at a single time to examine the association between antidiabetic agents and glycemic control with CV complications. Specific types of CV complications were included such as IHD, ACS, AF, HF, and stroke, which represent most of the Malaysian population. In this study, the duration of antidiabetic agents was at least 3 months, and exposure to these agents was well defined. In addition, A1C values for each patient were collected and recorded, which made the association between glycemic control and CV complications more reliable.
Study limitations
The retrospective nature of the study design caused the whole data collection process to be based solely on information available from patients’ medical records. Dependence on medical records tends to introduce bias and produce inaccurate results, especially in circumstances where there are missing data on patients’ information that is relevant to the study. Important information might also be neglected or deliberately omitted due to illegible handwriting. Patients’ adherence to antidiabetic medications also cannot be assessed unless adherence status is recorded in the case notes.
Conclusion
Sulfonylureas in combination, insulin in combination, sulfonylurea monotherapy, and insulin and metformin combination therapy were associated with glycemic control in this population. Overall, the antidiabetic regimen was strongly correlated with glycemic control. Stroke was the only type of CV complication found to be associated with glycemic control. BPH was the only comorbidity that appeared to be significantly associated with glycemic control. No concurrent medication was found to be significantly associated with glycemic control. Other factors like LDL cholesterol level and age were correlated with glycemic control. The identification of underlying factors associated with glycemic control may help in preventing CV progression in T2DM patients. Thus, additional care is required for patients with multiple risk factors.
Acknowledgments
The authors thank the University of Malaya, Malaysia (RP024B-14HTM), for financial and technical support.
Footnotes
Disclosure
The authors report no conflicts of interest in this work.
References
- 1.Hu FB. Globalization of diabetes: the role of diet, lifestyle, and genes. Diabetes Care. 2011;34(6):1249–1257. doi: 10.2337/dc11-0442. [DOI] [PMC free article] [PubMed] [Google Scholar]
- 2.International Diabetes Federation . Diabetes Atlas. 5th ed. Brussels, Belgium: IDF; 2011. [Google Scholar]
- 3.Wan Nazaimoon WM, Md Isa SH, Wan Mohamad WB, et al. Prevalence of diabetes in Malaysia and usefulness of HbA1C as a diagnostic criterion. Diabet Med. 2013;30(7):825–828. doi: 10.1111/dme.12161. [DOI] [PubMed] [Google Scholar]
- 4.American Diabetes Association Standards of Medical Care in Diabetes. Diabetes Care. 2014;36:S14–S87. doi: 10.2337/dc14-S014. [DOI] [PubMed] [Google Scholar]
- 5.World Heart Federation . Cardiovascular Disease Risk Factors: Diabetes. Geneva, Switzerland: World Heart Federation; 2014. [Accessed March 26, 2014]. Available from: http://www.world-heart-federation.org/cardiovascular-health/cardiovascular-disease-risk-factors/diabetes/ [Google Scholar]
- 6.Penno G, Solini A, Zoppini G, et al. Hemoglobin A1C variability as an independent correlate of cardiovascular disease in patients with type 2 diabetes: a cross-sectional analysis of the renal insufficiency and cardiovascular events (RIACE) Italian multicenter study. Cardiovasc Diabetol. 2013;12:98. doi: 10.1186/1475-2840-12-98. [DOI] [PMC free article] [PubMed] [Google Scholar]
- 7.Dipiro JT, Talbert RL, Yee GC, et al. Pharmacotherapy: A Pathophysiologic Approach. 8th ed. New York, NY: McGraw-Hill Medical; 2011. [Google Scholar]
- 8.Thrainsdottir I, Malmberg K, Olsson A, Gutniak M, Ryden L. Initial experience with GLP-1 treatment on metabolic control and myocardial function in patients with type 2 diabetes mellitus and heart failure. Diab Vasc Dis Res. 2004;1(1):40–43. doi: 10.3132/dvdr.2004.005. [DOI] [PubMed] [Google Scholar]
- 9.Nikolaidis LA, Mankad S, Sokos GG, Miske G, Shah A. Effects of glucagon-like peptide-1 in patients with acute myocardial infarction and left ventricular dysfunction after successful reperfusion. Circulation. 2004;109(8):962–965. doi: 10.1161/01.CIR.0000120505.91348.58. [DOI] [PubMed] [Google Scholar]
- 10.Sokos GG, Nikolaidis LA, Mankad S, Elahi D, Shannon RP. Glucagon-like peptide-1 infusion improves left ventricular ejection fraction and functional status in patients with chronic heart failure. J Cardiac Fail. 2006;12(9):694–699. doi: 10.1016/j.cardfail.2006.08.211. [DOI] [PubMed] [Google Scholar]
- 11.Fowler MJ. Diabetes treatment part 2: oral agents for glycemic management. Clin Diabetes. 2007;25(4):131–134. [Google Scholar]
- 12.Shah DD, Fonarow GC, Horwich TB. Metformin therapy and outcomes in patients with advanced systolic heart failure and diabetes. J Cardiac Fail. 2010;16(3):200–206. doi: 10.1016/j.cardfail.2009.10.022. [DOI] [PMC free article] [PubMed] [Google Scholar]
- 13.Soraya H, Khorrami A, Garjani A, Maleki-Dizaji N, Garjani A. Acute treatment with metformin improves cardiac function following isoproterenol induced infarction in rats. Pharmacol Rep. 2012;64:1476–1484. doi: 10.1016/s1734-1140(12)70945-3. [DOI] [PubMed] [Google Scholar]
- 14.Vilar L, Canadas V, Arruda MJ, et al. Comparison of metformin, gliclazide MR and rosiglitazone in monotherapy and in combination for type 2 diabetes. Arq Bras Endocrinol Metabol. 2010;54(3):311–318. doi: 10.1590/s0004-27302010000300010. [DOI] [PubMed] [Google Scholar]
- 15.Schernthaner G, Grimaldi A, Di Mario U, et al. GUIDE study: double-blind comparison of once-daily gliclazide MR and glimepiride in type 2 diabetic patients. Eur J Clin Invest. 2004;34(8):535–542. doi: 10.1111/j.1365-2362.2004.01381.x. [DOI] [PubMed] [Google Scholar]
- 16.Adham M, Froelicher ES, Batieha A, Ajlouni K. Glycaemic control and its associated factors in type 2 diabetic patients in Amman, Jordan. East Mediterr Health J. 2010;16(7):732–739. [PubMed] [Google Scholar]
- 17.Parsaik AK, Carter RE, Myers LA, Basu A, Kudva YC. Hypoglycemia requiring ambulance services in patients with type 2 diabetes is associated with increased long term mortality. Endocr Pract. 2013;19(1):29–35. doi: 10.4158/EP12197.OR. [DOI] [PubMed] [Google Scholar]
- 18.Kauffman AB, Delate T, Olson KL, et al. Relationship between haemoglobin A1C values and recurrent cardiac events. Clin Drug Investig. 2008;28(8):501–507. doi: 10.2165/00044011-200828080-00005. [DOI] [PubMed] [Google Scholar]
- 19.Meneghini LF, Rosenberg KH, Koenen C, Merilainen MJ, Luddeke HJ. Insulin detemir improves glycaemic control with less hypoglycaemia and no weight gain in patients with type 2 diabetes who were insulin naive or treated with NPH or insulin glargine: clinical practice experience from a German subgroup of the PREDICTIVE study. Diabetes Obes Metab. 2007;9(3):418–427. doi: 10.1111/j.1463-1326.2006.00674.x. [DOI] [PubMed] [Google Scholar]
- 20.Choi SB, Lee JH, Kim S, et al. Improvement of β-cell function after achievement of optimal glycaemic control via long-term continuous subcutaneous insulin infusion therapy in non-newly diagnosed type 2 diabetic patients with suboptimal glycaemic control. Diabetes Metab Res Rev. 2013;29(6):473–482. doi: 10.1002/dmrr.2416. [DOI] [PubMed] [Google Scholar]
- 21.UK Prospective Diabetes Study (UKPDS) Group Effect of intensive blood-glucose control with metformin on complications in overweight patients with type 2 diabetes (UKPDS 34) Lancet. 1998;352(9131):854–865. [PubMed] [Google Scholar]
- 22.Gerstein HC, Pogue J, Mann JF, et al. The relationship between dysglycaemia and cardiovascular and renal risk in diabetic and non-diabetic participants in the HOPE study: a prospective epidemiological analysis. Diabetologia. 2005;48(9):1749–1755. doi: 10.1007/s00125-005-1858-4. [DOI] [PubMed] [Google Scholar]
- 23.Ray KK, Seshasai SR, Wijesuriya S, et al. Effect of intensive control of glucose on cardiovascular outcomes and death in patients with diabetes mellitus: a meta-analysis of randomised controlled trials. Lancet. 2009;373(9677):1765–1772. doi: 10.1016/S0140-6736(09)60697-8. [DOI] [PubMed] [Google Scholar]
- 24.Bellolio MF, Gilmore RM, Stead LG. Insulin for glycaemic control in acute ischaemic stroke. Cochrane Database Syst Rev. 2011;9:CD005346. doi: 10.1002/14651858.CD005346.pub3. [DOI] [PubMed] [Google Scholar]
- 25.Baird TA, Parsons MW, Phanh T, et al. Persistent poststroke hyperglycemia is independently associated with infarct expansion and worse clinical outcome. Stroke. 2003;34:2208–2214. doi: 10.1161/01.STR.0000085087.41330.FF. [DOI] [PubMed] [Google Scholar]
- 26.Lindsberg PJ, Roine RO. Hyperglycemia in acute stroke. Stroke. 2004;35(2):363–364. doi: 10.1161/01.STR.0000115297.92132.84. [DOI] [PubMed] [Google Scholar]
- 27.Reiner Z, Catapano AL, De Backer G, et al. ESC/EAS Guidelines for the management of dyslipidaemias: the task force for the management of dyslipidaemias of the European Society of Cardiology (ESC) and the European Atherosclerosis Society (EAS) Eur Heart J. 2011;32(14):1769–1818. doi: 10.1093/eurheartj/ehr158. [DOI] [PubMed] [Google Scholar]
- 28.Nakata M, Nagasaka S, Kusaka I, et al. Effects of statins on the adipocyte maturation and expression of glucose transporter 4 (SLC2A4): implications in glycaemic control. Diabetologia. 2006;49(8):1881–1892. doi: 10.1007/s00125-006-0269-5. [DOI] [PubMed] [Google Scholar]
- 29.Sukhija R, Prayaga S, Marashdeh M, et al. Effect of statins on fasting plasma glucose in diabetic and nondiabetic patients. J Investig Med. 2009;57(3):495–499. doi: 10.2310/JIM.0b013e318197ec8b. [DOI] [PubMed] [Google Scholar]
- 30.Karatas OF, Bayrak O, Cimentepe E, Unal D. An insidious risk factor for cardiovascular disease: benign prostatic hyperplasia. Int J Cardiol. 2010;144(3):452. doi: 10.1016/j.ijcard.2009.03.099. [DOI] [PubMed] [Google Scholar]
- 31.Sarma AV, St Sauver JL, Hollingsworth JM, et al. Diabetes treatment and progression of benign prostatic hyperplasia in community-dwelling black and white men. Urology. 2012;79(1):102–108. doi: 10.1016/j.urology.2011.08.065. [DOI] [PMC free article] [PubMed] [Google Scholar]
- 32.Shionoiri H, Ashino K, Yamanaka K, et al. Effect of doxazosin therapy on glucose tolerance and lipid metabolism in hypertensive patients with impaired glucose tolerance. Clin Ther. 1997;19(3):527–536. doi: 10.1016/s0149-2918(97)80137-3. [DOI] [PubMed] [Google Scholar]
- 33.Derosa G, Cicero AF, D’Angelo A, et al. Synergistic effect of doxazosin and acarbose in improving metabolic control in patients with impaired glucose tolerance. Clin Drug Investig. 2006;26(9):529–539. doi: 10.2165/00044011-200626090-00006. [DOI] [PubMed] [Google Scholar]
- 34.Zhou Y, Yuan Y, Cai RR, et al. Statin therapy on glycaemic control in type 2 diabetes: a meta-analysis. Expert Opin Pharmacother. 2013;14(12):1575–1584. doi: 10.1517/14656566.2013.810210. [DOI] [PubMed] [Google Scholar]
- 35.Simsek S, Schalkwijk CG, Wolffenbuttel BH. Effects of rosuvastatin and atorvastatin on glycaemic control in type 2 diabetes – the CORALL study. Diabet Med. 2012;29(5):628–631. doi: 10.1111/j.1464-5491.2011.03553.x. [DOI] [PubMed] [Google Scholar]
- 36.Singh K, Raghavan VA. Insulin Resistance and Atherosclerosis in Lipoproteins in Diabetes Mellitus. New York, NY: Springer; 2014. pp. 41–44. [Google Scholar]
- 37.Blackburn DF, Wilson TW. Antihypertensive medications and blood sugar: theories and implications. Can J Cardiol. 2006;22(3):229–233. doi: 10.1016/s0828-282x(06)70902-3. [DOI] [PMC free article] [PubMed] [Google Scholar]
- 38.Quah JH, Liu YP, Luo N, How CH, Tay EG. Younger adult type 2 diabetic patients have poorer glycaemic control: a cross-sectional study in a primary care setting in Singapore. BMC Endocr Disord. 2013;13(1):18. doi: 10.1186/1472-6823-13-18. [DOI] [PMC free article] [PubMed] [Google Scholar]
- 39.Ji LN, Lu JM, Guo XH, et al. Glycemic control among patients in China with type 2 diabetes mellitus receiving oral drugs or injectables. BMC Pub Health. 2013;13(1):602. doi: 10.1186/1471-2458-13-602. [DOI] [PMC free article] [PubMed] [Google Scholar]
- 40.Chan WB, Chan JC, Chow CC, et al. Glycaemic control in type 2 diabetes: the impact of body weight, β-cell function and patient education. Oxford J Med. 2000;93(3):183–190. doi: 10.1093/qjmed/93.3.183. [DOI] [PubMed] [Google Scholar]
- 41.Huri HZ, Selamat S, Vethakkan SR. Factors associated with utilization of dipeptidyl-4 inhibitors in patients with type 2 diabetes mellitus: a cross-sectional retrospective study. [Accessed July 16, 2015];Int J Endocrinol. 2014 2014:367564. doi: 10.1155/2014/367564. Available from: http://dx.doi.org/10.1155/2014/367564. [DOI] [PMC free article] [PubMed] [Google Scholar]
- 42.Barber N, Parsons J, Clifford S, Darracott R, Horne R. Patients’ problems with new medication for chronic conditions. Quality and Safety in Health Care. 2004;13(3):172–175. doi: 10.1136/qshc.2003.005926. [DOI] [PMC free article] [PubMed] [Google Scholar]
- 43.Ministry of Health . Clinical practice guidelines on management of obesity. 2004. [Google Scholar]