Abstract
Under the current allocation system for liver transplantation (LTx), primary and retransplantation (ReTx) are treated identically. The aims of this study were (1) to compare the risk of death between ReTx and primary LTx candidates at a given MELD score and (2) to gauge the impact of the MELD-based allocation system on the waitlist outcome of ReTx candidates. Based on data of all waitlist registrants in the US between 2000 and 2006, unique adult patients with chronic liver disease were identified and followed forward to determine mortality within six months of registration. There were a total of 45,943 patients waitlisted for primary LTx and 2,081 registered for ReTx. In the MELD era (n=30,175), MELD was significantly higher among ReTx candidates than primary LTx candidates (median, 21 versus 15). Within a range of MELD scores where most transplantation took place, mortality was comparable between ReTx and primary candidates after adjusting for MELD. The probability for LTx increased significantly following implementation of the MELD-based allocation in both types of candidates. We conclude that by and large, primary and ReTx candidates fare equitably under the current MELD-based allocation system, which has contributed to a significant increase in the probability of LTx.
Introduction
In spite of the steady improvement in survival of liver transplantation (LTx) recipients over the past two decades, a proportion of those patients experience graft failure and require retransplantation (ReTx)(1). Over the last 10 years, the proportion of waitlist registrants who have had a previous LTx remained relatively stable at about 8%(2).
ReTx remains controversial in LTx. On the one hand, survival of ReTx recipients has been shown to be consistently lower than primary LTx recipients(3–5). Given the continued shortage of donated organs, a good argument may be made that primary LTx is a better use of those scarce resources than ReTx. On the other hand, many LTx physicians and surgeons believe that patients whose graft failed due to no fault of their own deserve a second chance. Regardless of the medico-ethical justification for ReTx, it is likely that the current practice will continue in the foreseeable future.
Currently, ReTx candidates compete for organs under the same allocation system based on the MELD score as primary LTx candidates, except patients who qualify for status 1 designation as a result of primary non-function or early hepatic artery thrombosis. To date, data about whether the waitlist outcome differs between primary and ReTx candidates under current MELD-based allocation system have been sparse.(6) The aims of the work included (1) to compare the risk of death between ReTx and primary LTx candidates at a given MELD score and (2) to assess the impact of the MELD-base organ allocation system on the waitlist outcome of patients registered for ReTx.
Materials and Methods
Waiting List Registrants
Data on all patients who were registered on the LTx waitlist in the United States were obtained from the OPTN liver waiting list. These data were made available via the Standard Transplant Analysis and Research (STAR) file as of May 1, 2007. All registrants for LTx between January 2000 and December 2006 were included. Registrations for patients younger than 18 years, patients with fulminant liver failure (United Network for Organ Sharing status 1), and patients with malignancies were excluded. Patients with records of having ever received prior LTx were considered ReTx registrants. We also excluded patients who experienced acute or subacute graft failure after LTx (i.e., ReTx registrations within 3 months of the primary LTx), as the focus of this work is a comparison among patients with chronic liver disease. Patients were followed for a total of 6 months from the time of registration and their vital status determined.
For the purpose of this analysis, the pre-MELD era included calendar years 2000 and 2001, whereas 2003 through 2006 were grouped to be the post-MELD era. The year 2002 was excluded from the analysis as it was considered a year of transition in implementing the MELD-based allocation system.
Statistical Analysis
Information about the outcome of waiting (i.e., transplantation, death, or withdrawal from the list for other reasons) was extracted from the STAR file, which was used to define the outcome variable in the analysis - namely, death or LTx within 6 months after registration. The main predictor variable was the MELD score at the time of registration on the waitlist. Other covariates considered included age, gender, race and blood group. The MELD score was calculated by the standard formula.(7)
The first aim was addressed by comparing the risk of death between primary and ReTx candidates. For this analysis, patients were censored at transplant, the last follow-up date, or at 6 months after registration, whichever came first. The multivariable proportional hazards analysis was the main tool for this analysis, which evaluated the relationship between ReTx candidates and 6-month mortality after adjusting for the MELD score and other factors. Sensitivity analyses were conducted to evaluate whether considering a different time frame makes a meaningful difference: the same analysis was repeated for outcome at 3 months and 12 months. We also analyze the data for candidates with hepatitis C virus (HCV) infection and for those without, separately.
The second aim was achieved by conducting the competing risk analysis. This method allows simultaneous consideration of two or more outcomes for analysis. Details of this method have been described previously.(8) Briefly, for each event type (death or transplantation) and each time t, the cumulative incidence is obtained by summing the product of the overall survival and the hazard for the respective event type over all time points t and less. In turn, the overall survival is 1 minus the sum of the cumulative incidences for the different event types. If a patient experiences a competing event (e.g., death), the potential contribution for that patient thereafter is zero, because failure from the event of interest (e.g., LTx) is no longer possible. Cumulative incidence estimates are available in S-plus from version 7.0 onward (Insightful Corp., Seattle, WA)
Results
Patient Characteristics
Table 1 summarizes patient characteristics of waiting list registrants. In the pre-MELD era (2000 and 2001), a total of 15,849 patients met the inclusion criteria. Of those, 15,165 were registered for primary liver transplantation (LTx), whereas 684 were ReTx candidates. During the post-MELD era (2003 through 2006), a total of 30,175 registrants met the inclusion criteria. Of those, 28,778 were listed for primary LTx, and 1,397 for ReTx. Among the ReTx candidates, the median time from previous LTx to ReTx registration was 3.7 and 4.6 years for the Pre-MELD and Post-MELD eras, respectively. Compared to the primary LTx candidates, ReTx registrants were younger, whereas the gender distribution was similar in both eras. The proportion of African Americans was higher among RTx candidates in both eras. Distribution of blood types appeared similar, although the large sample size led to a statistically significant p-value in the comparison.
Table 1.
Characteristics of primary and retransplantation registrants in the pre- and post-MELD eras
| Pre-MELD era(2000–2001) | Post-MELD era(2003–2006) | |||||
|---|---|---|---|---|---|---|
| Primary LTx | ReTx | p | Primary LTx | ReTx | p | |
| Number, n (%) | 15,165 (95.7%) | 684 (4.3%) | 28,778 (95.4%) | 1,397 (4.6%) | ||
| Age, years | 51.0 ± 9.5 | 47.4 ± 11.1 | <0.01 | 52.4 ± 9.5 | 48.9 ± 11.0 | <0.01 |
| Male, n (%) | 9,473 (62.5%) | 402 (58.8%) | 0.05 | 18,629 (64.7%) | 898 (64.3%) | 0.73 |
| Race, n (%) | <0.01 | <0.01 | ||||
| African American | 1,065 (7.0%) | 84 (12.3%) | 2,101 (7.3%) | 166 (11.9%) | ||
| Caucasian | 11,408 (75.2%) | 498 (72.8%) | 21,518 (74.8%) | 1,020 (73.0%) | ||
| Hispanic | 2,057 (13.6%) | 80 (11.7%) | 4,030 (14.0%) | 175 (12.5%) | ||
| Other | 635 (4.2%) | 22 (3.2%) | 1,129 (3.9%) | 36(2.6%) | ||
| Blood Group, n (%) | 0.02 | 0.04 | ||||
| A | 5,741 (37.9%) | 281 (41.1%) | 10,949 (38.1%) | 554 (39.6%) | ||
| B | 1,802 (11.9%) | 97 (14.2%) | 3,423 (11.9%) | 162 (11.6%) | ||
| O | 7,042 (46.4%) | 278 (40.6%) | 13,304 (46.2%) | 610 (43.7%) | ||
| AB | 580 (3.8%) | 28 (4.1%) | 1,102 (3.8%) | 71 (5.1%) | ||
| Years since previous LTx | NA | 3.7±3.3 | - | NA | 4.6±4.5 | - |
Data as of the registration date. P values are calculated using the Wilcoxon rank sum test for continuous variables and chi-square test for categorical variables.
Comparison between primary and re-transplant candidates in the post-MELD era
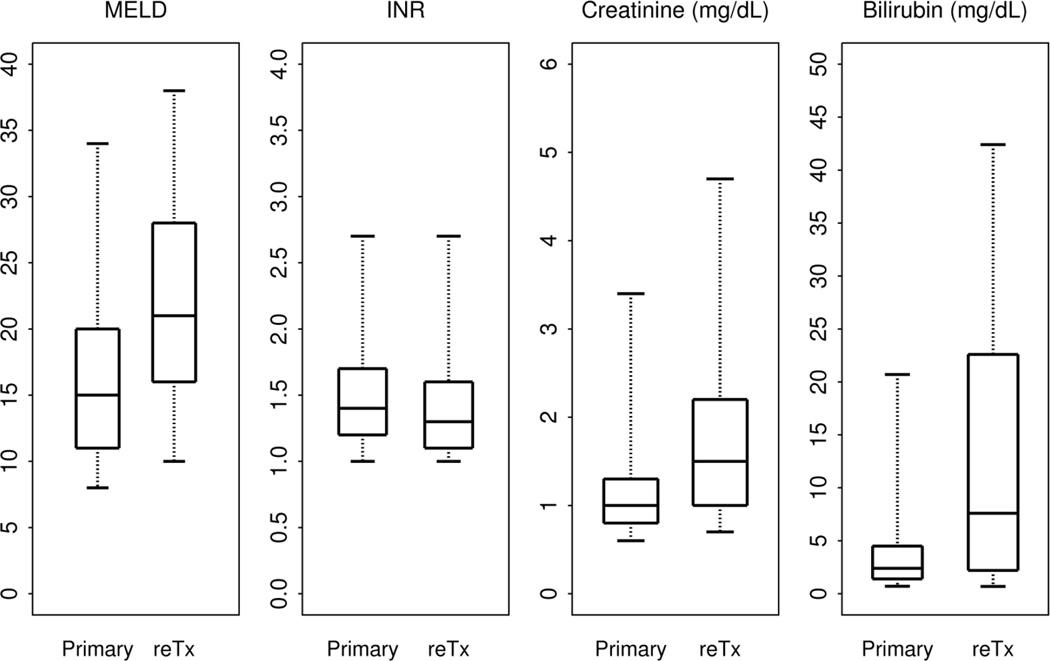
Figure 1 illustrates that at the time of registration, ReTx registrants had a median MELD of 21 (interquartile range [IQR], 16–28) compared to a median MELD of 15 (IQR, 11–20) in the primary LTx candidates. In Figure 1, ReTx registrants had a higher creatinine (median=1.0, IQR=0.8–1.3 versus median=1.5, IQR=1.0–2.2) and a higher bilirubin (median=2.4, IQR=1.4–4.5 versus median=7.7, IQR=2.2–22.6) compared to primary LTx registrants. In contrast, INR values were slightly lower among relisted candidates (median=1.3, IQR=1.1–1.6 versus median=1.4, IQR=1.2–1.7).
Figure 1.
Distribution of the MELD scores at registration.
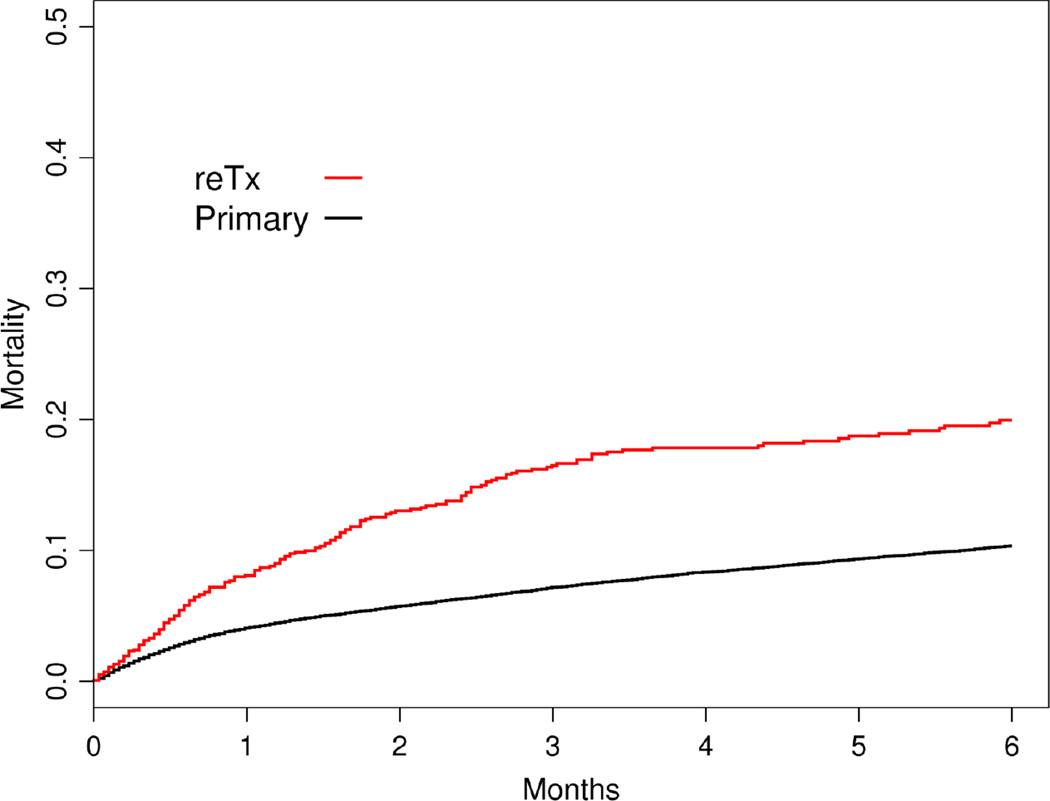
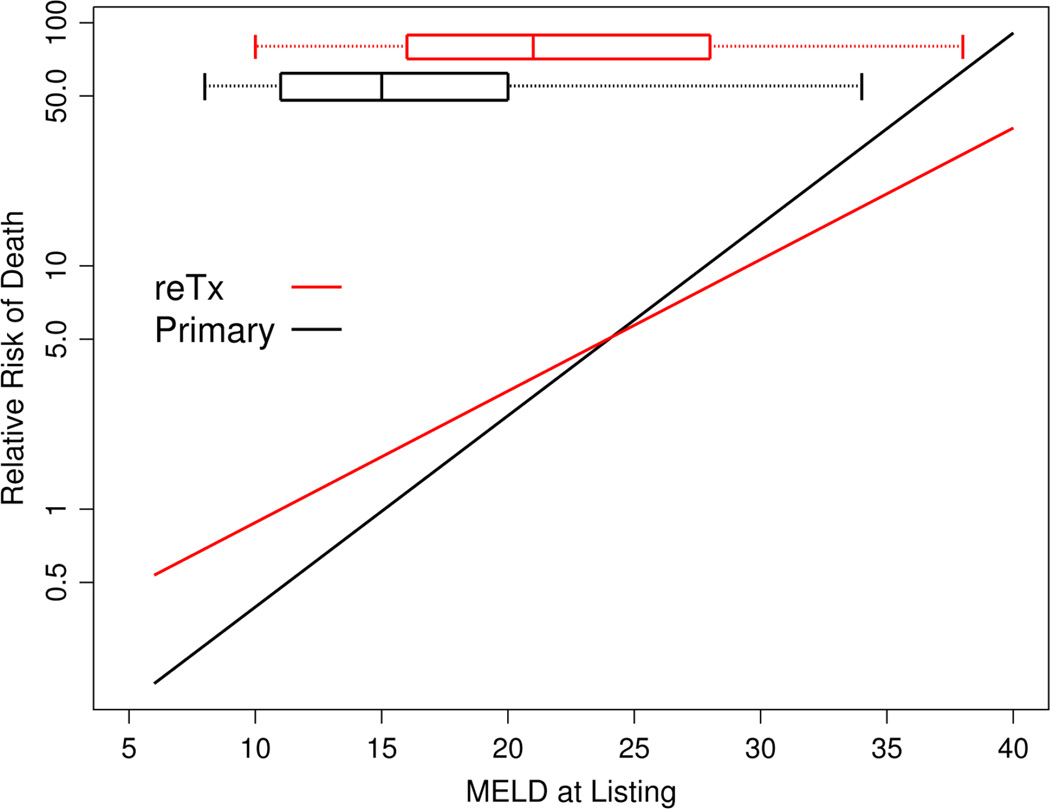
As expected from the higher MELD score at listing, the ReTx group had higher 6 month waiting list mortality than the primary transplantation group when a simple unadjusted Kaplan-Meier survival was considered (Figure 2). Thus, in order to evaluate the relation between the risk of mortality and the MELD score at listing in primary and Re-Tx candidates, a multivariable regression analysis is needed. Figure 3 summarizes the results of the analysis, which shows that in both primary and Re-Tx candidates, the MELD score at listing was associated with increasing risk of death. After adjusting for age, gender, blood group and race, the slope of the curve appears to be slightly steeper for the primary LTx patients than in ReTx registrants. The risk of death in ReTx patients was higher in the low MELD score range and lower in the high MELD score range. For example, the hazard ratio (HR) for ReTx compared to primary LTx at a MELD of 15 was 1.68 (95% confidence interval (95%CI)=1.32–2.14, p<0.01), which decreased to an HR of 1.30 (95%CI=1.08–1.57, p<0.01) at MELD of 20 and became non-significant with an HR of 0.95 (95%CI=0.82–1.11, p=0.54) at MELD of 25. At MELD of 30, the HR was reversed to 0.72 (95%CI=0.61–0.85, p<0.01).
Figure 2.
Mortality in six months following waitlist registration in primary and ReTx candidates
Figure 3.
Relation between the listing MELD score and waiting list mortality
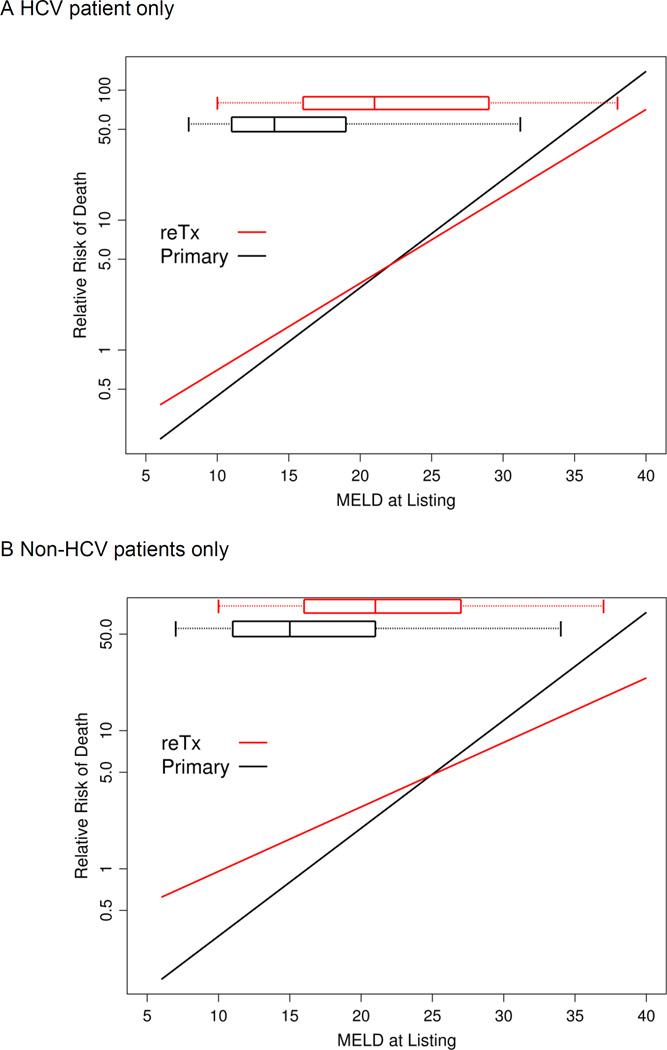
The relevance of the difference of the slopes in the risk of mortality between primary and ReTx is made clear when the box-and-whiskers plot in the top portion of the figure is considered, which indicates that the bulk (middle 80%) of ReTx occurred at MELD scores between 11 and 38. In that range of MELD scores, the separation between the two curves becomes small. In sensitivity analyses, the results summarized in Figure 3 are not changed when mortality was assessed at 3 or 12 months or when HCV and non-HCV patients were considered separately (appendix figure). Additional sensitivity analyses such as including reTx candidates with prior LTx for acute and malignant liver disease and utilizing death information after being withdrawn from the list were performed. None of these changed the results summarized in Figure 3.
Impact of MELD system on waitlist outcome for ReTx registrants
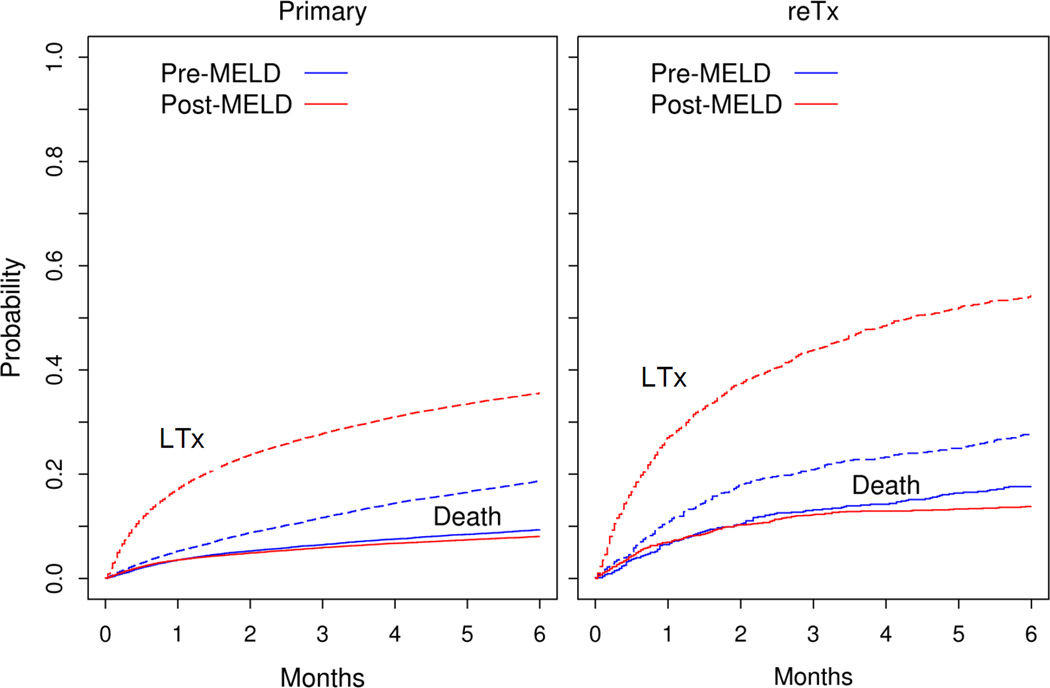
Figure 4 summarizes the competing risk analysis, which calculates the probability of transplantation and death simultaneously. As seen in the figure, the probability for LTx was much higher in the post-MELD era than in the pre-MELD era for both primary and repeat transplant candidates. The probability for a ReTx candidate to receive an organ within 6 months increased from 28% in the preMELD era to 54% in the postMELD era (p<0.01). For primary LTx candidates, the probability of LTx within 6 months increased from 19% to 35% (p<0.01). Similarly, 6 months waitlist mortality decreased for ReTx (from 18% to 14%, p=0.05) and primary candidates alike (from 9.3% to 8.0%, p<0.01), although the magnitude of these changes was much smaller than that for the probability of LTx, especially in the primary LTx candidates.
Figure 4.
Probability of LTx or Death in primary and ReTx candidates in the pre- and post-MELD eras. Solid curves represent death and dotted ones LTx.
DISCUSSION
Since the implementation of the new organ allocation in Feb. 2002, MELD has been widely acknowledged as an accurate predictor of waitlist mortality. The MELD-based system has been credited with decreased waitlist mortality without adversely affecting post-transplant outcome (9–12). However, there is continued interest to improve the MELD score as well as the allocation system in general. For example, it is important to identify certain subsets of candidates that are not well served by the current system. In this study, we considered whether ReTx candidates may be one of those subsets of patients. While the decision when and to whom ReTx should be offered remains a serious question that ethicists and clinicians continue to grapple with, accurate, data-driven evidence will facilitate addressing the challenge.
The main finding of our analysis, as shown in Figure 3, is that in the MELD score ranges where most LTx is performed, there were no large differences in waitlist mortality given a MELD score. However, the figure also demonstrates that the mortality risk does not increase as fast in ReTx candidates compared to primary LTx in high MELD score ranges. In our opinion, the difference was not large enough to warrant an adjustment in the allocation system, such as taking away MELD points for ReTx candidates with high (>35) MELD scores. On the other hand, in the very low MELD score ranges, ReTx patients were somewhat disadvantaged because their mortality was higher than primary LTx candidates with the same score.
To our knowledge, there have been only two studies that compared waitlist mortality between primary and ReTx candidates. The first small (n=63) study was conducted in the pre-MELD era and the results are not applicable in comparison to this study(13). The second analysis included the Organ Procurement and Transplantation Network (OPTN) and demonstrated that MELD scores correlated with pretransplant mortality for both primary and ReTx candidates and that there was a better concordance for waitlist mortality for primary candidates than ReTx registrants(6). In both studies, ReTx candidates tended to be sicker (e.g., higher MELD), as this study concurred. In addition, ReTx candidates are younger in general, suggesting a selection process in offering ReTx among patients experiencing graft failure. The strength of this study, however, is that neither of the previous studies provided a valid comparison in waitlist mortality between primary and ReTx patients.
We found that the higher MELD scores in relisted candidates were attributable to higher serum creatinine and bilirubin concentrations, whereas INR values tended to be higher in primary LTx candidates. The higher serum creatinine in the ReTx group is likely due at least in part to nephrotoxicity of post-LTx drugs, particularly calcineurin inhibitor, whereas the higher serum bilirubin may represent high prevalence of cholangiopathy among ReTx candidates. Thus, ReTx candidates with high MELD scores may be qualitatively different from primary candidates with the same MELD in whom the score truly represents the degree of liver failure. This hypothesis is supported by data of Edwards et al, which showed that the impact of serum bilirubin and creatinine was smaller in ReTx candidates compared to primary candidates, whereas the effect was reversed with INR. On the other end of the MELD spectrum, why ReTx candidates are faced with higher risk of mortality remains to be elucidated. One may hypothesize that ReTx candidates have more comorbidity and diminished ability to withstand less severe liver failure compared to primary LTx candidates.
Our competing risk analysis also revealed interesting insights. First, for both primary and ReTx candidates, post-MELD era patients were more likely to receive LTx and less likely to die on waitlist. These data lend strong support of the benefit of the MELD-based allocation system. Second in the comparison between primary and ReTx candidates, the MELD system seems to have benefitted the ReTx more, in terms of increased probability of LTx. We attribute this to the fact that ReTx candidates had higher MELD scores in general and their risks were recognized more explicitly under the MELD system.
A few limitations of this work need to be pointed out. First, the OPTN data are poorly suited to explore the biological basis for the difference in the relationship between MELD score and mortality in primary LTx versus re-Tx candidates. Ideally, clinical details of the candidates such as the reason for the graft failure, status of biliary anatomy and the nature of renal dysfunction may be informative in understanding such differences. In the currently available OPTN data, the reason for graft failure is difficult to ascertain. Second, our analysis correlated data at the time of registration with outcome at 6 months thereafter. Serial evaluation in the time-dependent fashion might provide more insight into any biological difference between the primary and re-LTx candidates. However, waitlist registration is an arbitrary time point in the evolution of liver/graft failure and our previous work has shown that serial information is not very useful in part because more frequent updating of MELD score is an indicator of worsening condition of the patient and incorporating updated information in a retrospective fashion may inadvertently introduce ascertainment bias. Thus, in order to understand the biologic basis for the difference shown in Figure 3, a prospective study in which detailed patient information is updated on a regular interval regardless of their (up or downward) trend would be needed.
In conclusion, our study indicates that the current MELD-based allocation system is, by and large, addressing primary and ReTx and candidates equitably. Whether the nuance about the qualitative difference in ReTx patients with high MELD scores resulting in a small reduction in mortality risk needs to be taken into account in the allocation system remains a difficult question. Further, questions about ethical justification of systematic bias for ReTx candidates may be raised in the context of the net benefit consideration, as ReTx recipients in general have been shown to have lower graft and patient survival than primary LTx recipients. This analysis contributes to the dialogue by providing a quantitative basis upon which philosophical and ethical considerations may be made. In the mean time, we are mostly comforted by the fact that MELD, shown here again as a strong indicator of waitlist mortality, has contributed to a significant increase in the probability of receiving transplantation under the current allocation system.
Acknowledgments
This study was supported by grants from the National Institutes of Health (RO1-DK34238)
Appendix Figure
Results of sensitivity analysis
Figure A Relation between MELD and risk of death in HCV patients.
Figure B Relation between MELD and risk of death in non-HCV patients.
References
- 1.Rosen HR, Prieto M, Casanovas-Taltavull T, Cuervas-Mons V, Guckelberger O, Muiesan P, et al. Validation and refinement of survival models for liver retransplantation. Hepatology. 2003;38:460–469. doi: 10.1053/jhep.2003.50328. [DOI] [PubMed] [Google Scholar]
- 2.Magee JC, Barr ML, Basadonna GP, Johnson MR, Mahadevan S, McBride MA, et al. Repeat organ transplantation in the United States, 1996–2005. Am J Transplant. 2007;7:1424–1433. doi: 10.1111/j.1600-6143.2007.01786.x. [DOI] [PubMed] [Google Scholar]
- 3.Markmann JF, Markowitz JS, Yersiz H, Morrisey M, Farmer DG, Farmer DA, et al. Long-term survival after retransplantation of the liver. Ann Surg. 1997;226:408–418. doi: 10.1097/00000658-199710000-00002. discussion 418–420. [DOI] [PMC free article] [PubMed] [Google Scholar]
- 4.Duran FG, Cercadillo RA, Santos L, de Diego A, Ferreiroa J, Valdecantos E, et al. Late orthotopic liver retransplantation: indications and survival. Transplant Proc. 1998;30:1876–1877. doi: 10.1016/s0041-1345(98)00467-9. [DOI] [PubMed] [Google Scholar]
- 5.Ghobrial RM. Retransplantation for recurrent hepatitis C. Liver Transpl. 2002;8:S38–S43. doi: 10.1053/jlts.2002.35861. [DOI] [PubMed] [Google Scholar]
- 6.Edwards E, Harper A. Does MELD work for relisted candidates? Liver Transplantation. 2004;10:S10–S16. doi: 10.1002/lt.20271. [DOI] [PubMed] [Google Scholar]
- 7.Wiesner R, Edwards E, Freeman R, Harper A, Kim R, Kamath P, et al. Model for end-stage liver disease (MELD) and allocation of donor livers.[see comment] Gastroenterology. 2003;124:91–96. doi: 10.1053/gast.2003.50016. [DOI] [PubMed] [Google Scholar]
- 8.Kim WR, Therneau TM, Benson JT, Kremers WK, Rosen CB, Gores GJ, et al. Deaths on the liver transplant waiting list: an analysis of competing risks. Hepatology. 2006;43:345–351. doi: 10.1002/hep.21025. [DOI] [PubMed] [Google Scholar]
- 9.Wiesner RH, Kamath PS, Malinchoc M, Kremers WK, Krom RAF, Kim WR. MELD and PELD: Application of survival models to liver allocation. Liver Transplantation. 2001;7:567–580. doi: 10.1053/jlts.2001.25879. [DOI] [PubMed] [Google Scholar]
- 10.Wiesner R, Edwards E, Freeman R, Harper A, Kim R, Kamath P, et al. Model for end-stage liver disease (MELD) and allocation of donor livers. Gastroenterology. 2003;124:91–96. doi: 10.1053/gast.2003.50016. [DOI] [PubMed] [Google Scholar]
- 11.Freeman RB, Wiesner RH, Edwards E, Harper A, Merion R, Wolfe R. Results of the first year of the new liver allocation plan. Liver Transpl. 2004;10:7–15. doi: 10.1002/lt.20024. [DOI] [PubMed] [Google Scholar]
- 12.Brown RS, Jr, Lake JR. The survival impact of liver transplantation in the MELD era, and the future for organ allocation and distribution. Am J Transplant. 2005;5:203–204. doi: 10.1111/j.1600-6143.2005.00769.x. [DOI] [PubMed] [Google Scholar]
- 13.Watt KD, Menke T, Lyden E, McCashland TM. Mortality while awaiting liver retransplantation: predictability of MELD scores. Transplant Proc. 2005;37:2172–2173. doi: 10.1016/j.transproceed.2005.03.004. [DOI] [PubMed] [Google Scholar]


