

Abstract
Electron tomography and immunogold labeling were used to analyze similarities and differences in the morphology and protein composition of postsynaptic densities (PSDs) isolated from adult rat cerebella, hippocampi, and cortices. There were similarities in physical dimensions and gross morphology between cortical, hippocampal and most cerebellar PSDs, although the morphology among cerebellar PSDs could be categorized into three distinct groups. The majority of cerebellar PSDs were composed of dense regions of protein, similar to cortical and hippocampal PSDs, while others were either composed of granular or latticelike protein regions. Significant differences were found in protein composition and organization across PSDs from the different brain regions. The signaling protein, βCaMKII, was found to be a major component of each PSD type and was more abundant than αCaMKII in both hippocampal and cerebellar PSDs. The scaffold molecule PSD-95, a major component of cortical PSDs, was found absent in a fraction of cerebellar PSDs and when present was clustered in its distribution. In contrast, immunogold labeling for the proteasome was significantly more abundant in cerebellar and hippocampal PSDs than cortical PSDs. Together, these results indicate that PSDs exhibit remarkable diversity in their composition and morphology, presumably as a reflection of the unique functional demands placed on different synapses.
Keywords: Postsynaptic Density, Electron Tomography, Electron Cryotomography, Immunogold labeling, Receptors, Scaffold Proteins
1. INTRODUCTION
Composed of signaling, scaffold and cytoskeletal proteins, the postsynaptic density (PSD) is an enormous ~1 GDa macromolecular (Chen et al., 2005) protein complex positioned just beneath the postsynaptic membrane (Gray, 1959, Cotman et al., 1974, Blomberg et al., 1977, Cohen et al., 1977, Sheng and Hoogenraad, 2007). The PSD regulates the efficiency of synaptic transmission by stabilizing neurotransmitter receptors in the postsynaptic membrane and functionally organizing signaling molecules within the postsynaptic compartment. Activity-dependent changes to the molecular composition and organization of the PSD are believed to underlie the synaptic modifications necessary for plasticity, learning and memory (for reviews see (Okabe, 2007, Sheng and Hoogenraad, 2007)). In support of this concept, the composition and structure of the PSD change in an activity-dependent manner (Dosemeci et al., 2001, Ehlers, 2003, Tao-Cheng et al., 2010, Yang et al., 2011) and through development (Harris et al., 1992, Petralia et al., 2005, Swulius et al., 2010, Swulius et al., 2012). Significant work has been done to identify the PSD proteome (Jordan et al., 2004, Li et al., 2004, Peng et al., 2004, Yoshimura et al., 2004, Dosemeci et al., 2006) and these efforts have led to a converging list of approximately 300 proteins. Additional effort has been made in mapping the spatial organization of a subset of individual proteins within the PSD (Dosemeci et al., 2001, Valtschanoff and Weinberg, 2001, Petersen et al., 2003, DeGiorgis et al., 2006, Swulius et al., 2010) in order to better understand how proteins and protein modules are functionally organized. However the degree of complexity, coupled with a dynamic protein composition, makes the PSD a particularly challenging subject for structural analysis, leading to continuing demands for experimental data describing the morphology and spatial organization of individual proteins within the PSD.
Different neuronal subtypes populate anatomically distinct regions of the brain and synaptic connections within these distinct regions are specialized to serve the functional demands unique to each region. These differences would necessarily include unique specialization of both PSD composition and structure. Yet, there has been minimal work directly quantifying differences between PSDs from different brain regions. Gross differences in morphology have been described for forebrain and cerebellar PSDs by examining fixed, thin-sectioned and negative stained preparations by electron microscopy (EM), revealing that forebrain PSDs were disc-like in shape, ranging from ~100-500 nm in diameter and ~60 nm thick, while cerebellar PSDs were approximately the same diameter but thinner (~30 nm) (Carlin et al., 1980). Western blot analysis and quantitative proteomics have also highlighted molecular differences in PSD fractions from forebrain and cerebellum for a variety of glutamate receptors, signaling molecules and PSD scaffolds (Cheng et al., 2006). While these works provide further evidence of the unique regional differences of the PSD complex, there remains a need to build a more refined description of PSD structure and composition to understand synapse specific structure and function.
To advance this goal, we isolated PSDs from cerebella, hippocampi and cerebral cortices, three brain areas amenable to straightforward isolation that contain unique distributions of neuronal cell types. Electron tomography and immunogold labeling were then employed to assess how the structure, protein composition and protein spatial organization differ in individual PSDs from these unique brain regions. We chose to employ electron tomography because of its unique capability to produce 3D structural information of the PSD at the molecular level and because it has been productively employed to visualize PSD structure (Chen et al., 2008, Swulius et al., 2010, Fera et al., 2012, Swulius et al., 2012). 3D structures were produced of cryo-preserved PSD specimens, that avoid artifacts of fixation and staining, providing novel views of the isolated PSD as it exists in a “frozen-hydrated” state. Immunogold labeling was employed for a set of some of the most abundant and well-known PSD-associated proteins to map their 2D spatial distribution within PSDs isolated from each brain region.
2. EXPERIMENTAL PROCEDURES
2.1. PSD Isolation
PSDs were isolated following a previously reported protocol (Swulius et al., 2010, Swulius et al., 2012), which was adapted from a widely used PSD enrichment procedure (Cohen et al., 1977). For a single preparation, brains were removed within 30 seconds of decapitation from adult male Sprague-Dawley rats (176-200 g) and placed in ice-cold isotonic sucrose solution of 0.5 mM HEPES/KOH pH 7.4, 0.32 M sucrose, 1 mM MgCl2, 0.5 mM CaCl2. The cerebella, hippocampi, and cortices were immediately dissected and separately homogenized in a sucrose solution (0.5 mM HEPES/KOH pH 7.4, 0.32 M sucrose, 1 mM MgCl2, 0.5 mM CaCl2, and 1 µg/ml leupeptin) with a motor-driven glass/Teflon homogenizer (0.2 mm clearance). All steps of the following protocol were accomplished at 4°C. For each region, homogenates were spun at 1,400 × g for 10 min, supernatants saved and pellets resuspended and spun again at 1,400 × g for 10 min. The supernatants were combined and pelleted at 13,800 × g for 10 min. The resulting pellets were resuspended and hand homogenized in a second sucrose solution (0.5 mM HEPES/KOH pH 7.4, 0.32 M sucrose and 1 ξg/ml leupeptin), applied to sucrose gradients (13 ml 1.4 M sucrose, 12 ml 1.0 M sucrose) and spun at 112,000 × g for 120 min. The synaptosomal fraction, at the 1.0/1.4 M interface, was diluted in an equal volume of triton extraction buffer (5 mM HEPES/KOH pH 7.4, 0.32 M sucrose, 1% TX-100), homogenized and rotated for 15 min before being applied to a second sucrose gradient (2 ml 2.1 M sucrose, 4 ml 1.5 M sucrose, 2 ml 1.0 M sucrose) and spun for 120 min at 271,000 × g. The synaptic junction fraction, the interface between the 1.5 M and 2.1 M sucrose, was then resuspended in an equal volume of a second triton extraction buffer (5.0 mM HEPES/KOH pH 7.4 and 1% TX-100) and rotated for 30 min. To produce the PSD fraction, the material was then added to the final sucrose gradient (2 ml 2.1 M sucrose, 4 ml 1.5 M sucrose) and spun at 210,000 × g for 20 min. The material at the 1.5/2.1 M interface was then diluted in 5 mM HEPES/KOH pH 7.4, pelleted, resuspended in 20% glycerol in 5 mM HEPES/KOH pH 7.4, and stored as aliquots at −80°C.
The data described in this report were produced from two independent PSD preparations that each contained the three isolated brain regions from nine rats. It is important to acknowledge that the process of isolating the PSD from the brain has the potential to alter its structure and composition. This limitation should be kept in mind when attempting to place the findings in this report in the context of PSD structure and function in vivo.
2.2. SDS Page and Western Blotting
For Western blotting, 10 ξg of total protein from homogenate, synaptosome, synaptic junction, or PSD fractions from cerebella, hippocampi and cortices, were separated by SDS-PAGE with 10% polyacrylamide gels. Separated proteins were transferred to nitrocellulose membranes at 4°C for 2 hours at 80 volts and membranes were then incubated in blocking buffer (5% dry milk in wash buffer (10 mM Tris, pH 8.0, 150 mM NaCl, and 0.05% NP40)). Membranes were then incubated in primary antibodies SV2 (Developmental Studies Hybridoma Bank) or PSD-95 (Thermo Scientific, MA1-046), diluted 1:1000 in blocking buffer, for 1 hr, rinsed twice in wash buffer, and incubated in secondary antibody Alexa 488 goat anti-mouse (Molecular Probes, A-11029) diluted 1:5000 in blocking buffer for 1 hr. Membranes were washed twice prior to imaging on a Typhoon Trio+ scanner (GE Healthcare). For protein staining, 3 ξg of total protein from cerebellar, hippocampal, and cortical PSD fractions were separated by SDS-PAGE with 10% polyacrylamide gels. Gels were incubated for 1 hr in excess fixation solution (30% methanol, 7.5% acetic acid) before staining with Amersham Deep Purple Total Protein Stain (GE Healthcare) diluted 1 part stain to 200 parts 100 mM sodium borate, pH 10.5 for 1 hr. After staining, gels were washed for 30 min in wash solution (30% methanol) and then 30 min in fixation solution. After a 5 min rinse in wash solution, gels were imaged on the Typhoon scanner and ImageQuant was used to estimate the molecular weight and intensity of each band. All incubations were performed at room temperature on an orbital shaker.
2.3. Immunogold Labeling and Spatial Analysis
Five microliters of PSDs, approximately 0.7 ug, were added to freshly glow-discharged formvar/carbon coated copper grids (Ted Pella) for five minutes. After blotting excess liquid, grids were floated upside down on a 35 ξL drop of blocking buffer (5% BSA in Hepes Buffered Saline (HBS) pH 7.4) for 10 minutes. After blotting, grids were then placed on top of 25 ξL drop of primary antibody for 30 minutes. Primary and secondary antibodies were diluted to working concentration in blocking buffer. Primary antibodies included those to: actin (Sigma, A2066, 1:20), α-actinin (Sigma, A5044, 1:20), αCaMKII (produced in house, 1:20), βCaMKII (Invitrogen 13-9800, 1:100), CaM (Upstate 05-173, 1:5), NR1 (Millipore, MAB363, 1:5), NR2b (Millipore, MAB5778, 1:20), PSD-95 (Thermo Scientific, MA1-046, 1:20), Homer (Santa Cruz, sc-17842, 1:50), Shank 1 (Neuromab, 75-064, 1:20), Shank 2 (Neuromab, 75-088, 1:50), Shank 3 (Neuromab, 75-109, 1:10), SAP102 (Neuromab, 75-058, 1:10), or the proteasome (Enzo Life Sciences, PW9265, 1:10). After incubation with the primary antibody, grids were rinsed three times by floating on top of 35 ξL drops of blocking buffer, blotting in between. Grids were then placed on 25 ξL drops of gold conjugated secondary antibody for 30 minutes. Secondary antibodies included 12nm Colloidal Gold-AffiniPure Goat Anti-Mouse (Jackson Immunoresearch, 115-205-068, 1:5) or 12nm Colloidal Gold-AffiniPure Goat Anti-Rabbit (Jackson Immunoresearch, 111-205-144, 1:5). Afterwards grids were placed on a final 35 ξL drop of blocking buffer. Each grid was then negatively stained by rinsing twice with 5 ξL of MilliQ water, once briefly with 5 ξL NanoW (Nanoprobes) and afterwards with 5 ξL of NanoW for 30 seconds. Grids were allowed to dry at room temperature for at least 30 minutes and then imaged on a JEOL 1400 electron microscope operated at 120 kV. Images were collected on an Orius camera (Gatan) at 32-64kx magnifications at the image plane. Labeling density was calculated as the total number of gold particles contained within the surface area of the PSD as measured in ImageJ (http://imagej.nih.gov/ij/). The average labeling density was calculated by averaging 20 individual immunogold labeled PSDs for each region and antibody. Titrations for every primary and secondary antibody were done to insure asymptotic labeling for a given target protein and Western blots were performed for each primary antibody to confirm that they bind to a protein of the appropriate molecular weight as the identified target. Negative controls (no primary antibody) were run in each experiment and the number of background gold/surface area was subtracted from the average labeling density. Statistical significance was defined as a p-value < 0.05, as determined through two-tailed t tests in Microsoft Excel.
For 2D spatial analysis of gold labeling, we employed a Ripley’s K function based analysis to determine whether the gold distribution for a given PSD deviated from spatial randomness, as previously described (Swulius et al., 2010). Briefly, coordinates representing the boundary of the PSD and gold were recorded and a Matlab (MathWorks) model generated. The 2D spatial distribution of the gold was then compared to 1000 simulations of spatial randomness, within the same boundary given the same number of gold particles. This procedure was accomplished for every PSD where spatial analysis was employed.
2.4 . Electron Tomography
Fiducial markers were prepared adding 125 ξL of 5% BSA in HBS to 200 ξL of 10 nm colloidal gold for 5 min at RT. The gold was then spun at 14,000 × g for 18 min and resuspended in 5 mM HEPES, pH 7.4. PSDs were thawed, diluted in 5 mM HEPES, pH 7.4, spun down at 14,000 × g for 18 min, and resuspended in 5 mM HEPES buffer, pH 7.4 containing BSA coated colloidal gold as fiducial markers. For negative stain tomography, 5 ξL of PSDs with gold were applied to freshly glow-discharged formvar/carbon coated copper grids (Ted Pella) for 5 min. Grids were blotted, rinsed twice with 5 ξL MilliQ water and stained twice with 5 ξL NanoW (Nanoprobes). For electron cryotomography (ECT), 5 ξL of PSDs with gold were applied to 200 mesh copper 2/2 Quantifoil grids (EMS). Grids were blotted by hand and plunged into liquid ethane cooled with liquid nitrogen. For all tomography, grids were imaged on a Technai F30 Polara. Negatively stained PSDs were imaged at 1° tilt angles from −60° to 60° at ~10 ξm defocus with a total dose less than 300 e−/Å2. For ECT, PSDs were imaged every 2° from −60° to 60° between 10 and 15 ξm defocus with a total dose less than 180 e−/Å2. The resulting images were aligned to create a 3D reconstruction in Etomo within the IMOD suite of programs (Mastronarde, 1997). Individual PSDs were selected for tilt series collection based on gross morphologic criteria including diameter. A total of 49 cerebellar (29 negative stained and 20 cryo-preserved), 37 hippocampal (12 negative stained and 25 cryo-preserved) and 59 cortical (14 negative stained and 45 cryo-preserved) tilt series were reconstructed for morphological and quantitative analyses.
To accomplish the protein-to-volume analysis, only PSDs that were centered within the holes of the quantifoil grids could be used to allow for the distinction between protein density and surrounding buffer. Because the PSDs had a tendency to attach to the carbon surface, the number of reconstructed images fitting this criterion was limited to twelve per group. Amira (v 5.3.3; Visage Imaging Inc. San Diego, CA) was used to calculate the protein-to-volume ratios of cryo-preserved PSDs from the final tomographic reconstructions using the following steps. For each individual tomogram, the PSD boundary was defined in the XY dimensions every 5th slice through the z-dimension, enclosing the pixels representing both protein and open space within the PSD complex, and then the program interpolated the boundary enclosing the whole PSD volume. A pixel intensity threshold was then determined for each tomogram in order to distinguish between pixels representing protein and pixels representing buffer enclosed in the PSD volume. The threshold was set as the mid-point between the mean buffer and protein pixel intensities, as determined by calculating the statistical mean pixel intensity for 10×10×10 voxel cubes of only buffer and of PSD protein material. Using the threshold value, the voxels representing protein within the PSD boundary were segmented, quantified and the protein-to-volume ratio determined. Values are reported as the total number of voxels above the threshold value divided by the total number of voxels enclosed within the PSD boundary.
PSD thickness was determined by multiplying the number of tomographic slices that contained PSD protein density in the Z-dimension, determined in 3DMOD, by the pixel sizes of the reconstructions. Surface areas were determined by multiplying pixel size by the total number of pixels within the X-Y boundary of each PSD. The boundaries were set manually in ImageJ using the full projections of the tomograms created in 3DMOD. Differences were considered significant if P < 0.05 in a 2-tailed t test.
3. RESULTS
3.1. Gross morphology of PSDs
PSDs were isolated from adult rat cerebella, hippocampi, and cortices as described in the experimental procedures. Enrichment of the PSD through steps of the isolation was monitored by Western blot using antibodies against PSD-95 and SV2 (Fig. 1A). As anticipated, PSD-95 undergoes significant enrichment moving from homogenate (Hom.) to PSDs, with a major enrichment coming at the step of synaptic junction (Syn. J.) isolation (Fig. 1A). In contrast, SV2 becomes undetectable when the synaptosomes (Syn.) are lysed with TX-100 to make the synaptic junction fraction (Fig. 1A). Overall the enrichment and loss pattern of PSD-95 and SV2, respectively, were similar amongst the fractions from cerebella, hippocampi and cortices (Fig. 1A). A representative electron micrograph of a negative stained PSD from cerebella, hippocampi and cortices is shown in Fig. 1B. Qualitative similarities and differences were obvious in their morphological characteristics. Most notable was the less densely packed protein arrangement in some cerebellar PSDs relative to those from either hippocampi or cortices (Fig. 1B). The detailed morphological characteristics are described more fully below, but a quantitative assessment of the relative surface area of PSDs was first accomplished by analyzing 120 randomly chosen PSDs from each preparation. Histograms of the binned surface areas (Fig. 2) provide an assessment of the size distribution amongst PSDs isolated and show the mode to be approximately 0.2 ξm2 for all PSD types. The mean surface of PSDs from cerebella, hippocampi and cortices were determined to be 0.37, 0.34 and 0.35 ξm2 (all ± 0.02 ξm2), respectively and were not significantly different from each other. However, there were distinct morphological differences revealed by electron tomography.
Figure 1.

Isolation of PSDs from Cerebella, Hippocampi and Cortices. (A) Western blots illustrating loss of synaptic vesicle protein SV2 and enrichment of PSD scaffold PSD-95 in synaptic junction (Syn. J) and PSD fractions in comparison to brain homogenate (Hom.) and synaptosome (Syn.) fractions. Eight micrograms of total protein were loaded in each lane. (B) Electron micrographs of negatively stained isolated PSDs from cerebella (Cereb.), hippocampi (Hippo.) and cortices (Cortical). Scale bar = 100 nm.
Figure 2.

Histograms of PSD Surface Area. Histograms depicting surface area distributions of PSDs isolated from cerebella, hippocampi and cortices. The peak for all PSD types was approximately 0.2 ξm2. N = 120.
3.2. Electron Tomography Reveals Differences in PSD Morphology
Due to its potential to produce relatively high-resolution 3D structural information, electron tomography is currently the best imaging option to reveal morphological details of individual macromolecular complexes like the PSD (Murphy and Jensen, 2007). Using this technique, a detailed comparative anatomical analysis of PSDs isolated from cerebella, hippocampi and cortices was accomplished using both negative stain tomography and cryotomography. Negative stain tomography provides increased contrast making visualization easier, however the application of stain and dehydration of the sample may distort the structure (addressed in more detail below). These distortions are avoided with cryotomography and we utilized the unique strengths of both of these techniques to consolidate the morphological descriptions by evaluating a total of 49 cerebellar PSDs, 37 hippocampal PSDs and 59 cortical PSDs. Similarities between PSDs from each region were evident in the tomographic reconstructions. PSDs were disc shaped, exhibiting irregular yet well-defined boundaries, and were composed of densely packed protein, with areas of low or absent protein density, easily visible in the high contrast 10 nm cross sections from negative stain tomographic reconstructions shown in Fig. 3-7. In addition, another prominent ultrastructural component was the presence of detergent resistant lipids, intimately attached to the protein density in PSDs from each group (Fig. 3-7). These lipid-like structures were obvious in the reconstructions and the number of each PSD type exhibiting this feature was quantified. In cortical PSDs, 78% (46 of 59) were found to have associated lipids, while hippocampal PSDs had lipid present in 62% (21 of 37) and cerebellar PSDs in 63% (31 of 49).
Figure 3.

Negative Stain Tomographic Reconstructions of PSDs Isolated from Cortices and Hippocampi. All images are 10 nm cross-sections through final tomographic reconstruction. PSDs isolated from cortices and hippocampi were composed of large dense protein regions (black horizontal arrows) with small areas lacking protein (black vertical arrows). Asterisks highlight detergent resistant membranes attached to the PSDs. Gold was used as a fiducial marker to align image series during reconstruction. Scale bar = 100 nm.
Figure 7.

Cryotomographic Reconstructions of PSDs Isolated from Cerebella. All images are 10 nm cross-sections through final tomographic reconstructions. The majority of PSDs isolated from cerebella where composed of large dense protein regions with small areas lacking protein (Dense Cereb.), although some PSDs were more globular in texture (Granular Cereb.), and others were latticelike in appearance (Lacy Cereb.). Black horizontal arrows indicate areas of dense protein, vertical arrows indicate areas without protein density and asterisks highlight detergent resistant membranes attached to the PSDs. Gold used as a fiducial marker to align images is occasionally visible. Scale bar = 100 nm.
Cortical and hippocampal PSDs exhibited similar morphology, composed mainly of densely packed protein with sparse areas absent of protein density (Fig. 3). In contrast to the relatively consistent architecture of cortical and hippocampal PSDs, three distinct morphological classes of PSDs isolated from cerebella were identified (Fig. 4). The top row of Fig. 4 shows cerebellar PSDs that exhibit mostly densely packed protein with small areas absent of protein that closely resembles the morphology of cortical and hippocampal PSDs (Fig. 3). This type of PSD represented 20 of 49 (41%) of the cerebellar PSDs analyzed. In contrast, other cerebellar PSDs could be identified that exhibited a more granular protein substructure (12 of 49 total (24%); Fig. 4 middle row) or a latticelike substructure (17 of 49 total (35%); Fig. 4 bottom row), both which appeared to have smaller areas of dense protein packing. The granular-like cerebellar PSDs lacked larger regions of dense protein and instead had smaller regions of protein clusters about 40 nm in diameter with areas of low protein density between clusters (Fig. 4 middle row). The lacier cerebellar PSDs (Fig. 4 bottom row) had a latticelike structure, with distinct filamentous protein connecting regions of more densely packed proteins. In contrast to these larger scale differences, close examination of the fine structural details of PSDs isolated from cerebella, hippocampi and cortices indicated that they were all composed of a collection of small filamentous and globular proteins (Fig. 5 right column). The larger scale differences appeared to arise from the ratio and packing density of these substructures. Interestingly, some of the globular structures were ring-like measuring approximately 15-20 nm in diameter and resembled calcium-calmodulin dependent kinase II (CaMKII). For comparative purposes, representative images are included from cryotomographic reconstructions of cortical (Fig. 6), hippocampal (Fig. 6) and cerebellar (Fig. 7) PSDs.
Figure 4.

Negative Stain Tomographic Reconstructions of PSDs Isolated from Cerebella. All images are 10 nm cross-sections through final tomographic reconstruction. The majority of PSDs isolated from cerebella were: composed of large dense protein regions with small areas lacking protein (Dense Cereb.); more globular in texture (Granular Cereb.); or latticelike in appearance (Lacy Cereb.). Black horizontal arrows indicate areas of dense protein, vertical arrows indicate areas without protein density and asterisks highlight detergent resistant membranes attached to the PSDs. Gold used as a fiducial marker to align images during reconstruction can be seen in some of the images. Scale bar = 100 nm.
Figure 5.

Negative Stain Tomographic Reconstructions of PSDs Isolated from Cortices, Hippocampi, and Cerebella. All images are 10 nm cross-sections through final tomographic reconstructions. The left panels show examples of cortical (A), hippocampal (B), and cerebellar PSDs (C-D). Black horizontal arrows indicate areas of dense protein, vertical arrows indicate areas without protein density and asterisks highlight detergent resistant membranes attached to the PSDs. Enlarged regions of each image on the left are shown in the right panels that illustrate the finer structural features of PSDs from cortices (A), hippocampi (B), and cerebella (C-E). An example of a dense cerebellar PSD (C), granular cerebellar PSD (D) and a lacy cerebellar PSD (E) are shown. All PSDs were composed of filamentous and globular proteins, indicated with white horizontal and vertical arrows, respectively, in the right panels. Gold used as a fiducial marker to align images is occasionally visible. Scale bar = 100 nm.
Figure 6.

Cryotomographic Reconstructions of PSDs Isolated from Cortices and Hippocampi. All images are 10 nm cross-sections through final tomographic reconstructions. PSDs isolated from cortices and hippocampi were composed of large dense protein regions with small areas lacking protein. Black horizontal arrows indicate areas of dense protein, vertical arrows indicate areas without protein density and asterisks highlight detergent resistant membranes attached to the PSDs. Gold used as a fiducial marker to align images is occasionally visible. Scale bar = 100 nm.
3.3. Electron Tomography Reveals Differences in PSD Thickness
From the visual assessment described above, differences were evident in the packing density of structures within the different PSD types. We therefore chose to analyze a subset of the cryo-preserved PSDs from each group for comparison of thickness and protein-to-volume ratio in the absence of stain/dehydration artifacts. Twelve cryotomograms of PSDs from each region were selected and representative examples are shown in Fig. 6 and Fig. 7. The protein-to-volume ratios were calculated as described in the experimental procedures and the results are shown in a whisker plot in Fig. 8. The protein-to-volume ratios for cortical and cerebellar PSDs were the most variable with ranges from 0.19 to 0.53 and 0.15 to 0.52, respectively, while the ratios for hippocampal PSDs were more consistent, ranging from 0.21 to 0.36. Uniquely, for the cerebellar PSDs, half (6 of 12) of the PSDs evaluated clustered near a protein-to-volume ratio of 0.18 while the other half ranged from 0.26 to 0.52, suggesting that a distinct groups of cerebellar PSDs exist with respect to protein volume. The cerebellar PSDs with lower protein-to-volume ratios were morphologically classified as lacy PSDs (shown in Fig. 7 bottom row). Overall, the mean protein-to-volume ratios for cerebellar, hippocampal, and cortical PSDs were 0.29 ± 0.04, 0.31 ± 0.01, and 0.35 ± 0.03, respectively but were not statistically different (Table 1).
Figure 8.

Protein Occupancy of PSDs Isolated from Cerebella, Hippocampi and Cortices. Whisker plot showing individual and mean protein-to-volume ratios, defined as the total number of voxels containing protein divided by the total number of voxels contained within the PSD. Values from each of twelve cryo-preserved PSDs from each brain region are shown as black diamonds. Within the whisker plots, the black squares represent the mean, the line represents the median, the pyramids represent the interquartile range and the error bars show the 95% to 5% range of the data.
Table 1.
Mean (± SEM) Surface Area, Thickness and Protein-to-Volume Ratio of Cryo-preserved PSDs from Tomographic Reconstructions. Differences were considered significant if P < 0.05 in a 2-tailed t test and are indicated with boldface. N = 12.
| Cerebellar PSDs | Hippocampal PSDs | Cortical PSDs | |
|---|---|---|---|
| Surface Area (μm2) | 0.24 ± 0.04 | 0.28 ± 0.04 | 0.27 ± 0.06 |
| Thickness (nm) | 210 ± 13 | 112 ± 9 | 169 ± 22 |
| Protein : Volume | 0.29 ± 0.04 | 0.31 ± 0.01 | 0.35 ± 0.03 |
The mean thickness of cryo-preserved hippocampal PSDs was calculated to be 112 ± 9 nm (n=12) and was statistically different than both cryo-preserved cortical and cerebellar PSDs, which had mean thicknesses of 169 ± 22 nm (n=12) and 210 ± 13 nm (n=12), respectively (Table 1). This difference cannot be ascribed to differences in the isolation procedure as the samples from all three regions were processed simultaneously and were imaged under identical conditions. These thicknesses were larger than historically reported for PSDs (Cohen et al., 1977, Carlin et al., 1980, Harris et al., 1992), and we were interested in determining if this could be the result of negative stain and dehydration employed in the earlier studies. For a direct comparison, we measured the thickness and surface area of twelve negatively stained PSDs from each region using the identical procedure to that described for the cryo-preserved PSDs. The thickness as well as the surface area from negative stain tomograms is summarized in Table 2. The mean surface areas calculated for the PSDs imaged by negative stain tomography were statistically the same as the average surface areas for cryo-preserved PSDs (Table 1). In contrast, the mean thicknesses for negatively stained cerebellar and cortical PSDs (115 ± 11 nm and 93 ± 5 nm, respectively (n=12)) were significantly thinner, approximately 2-fold, than for cryo-preserved PSDs from the same brain regions (210 ± 13 nm and 169 ± 22 nm, respectively). Negatively stained hippocampal PSDs had a mean thickness of 94 ± 7 nm (n=12), which was not statistically different than cryo-preserved hippocampal PSDs (112 ± 9 nm) (Table 1 and Table 2). These results provide evidence that the application of stain and dehydration causes collapse of the cortical and cerebellar PSDs along their Z dimension. The impact on hippocampal PSDs was not as significant, perhaps because the molecular organization of hippocampal PSDs supports the structure from collapsing under negative stain conditions. The significant differences in PSD morphology found among cerebellar PSDs, the variability in the protein-to-volume ratios between PSD types, and their differential thickness support the concept that there are differences in the molecular composition of the PSDs from different brain regions.
Table 2.
Mean (± SEM) Surface Area and Thickness of Negatively Stained PSDs from Tomographic Reconstructions. Differences were considered significant if P < 0.05 in a 2-tailed t test and are indicated with boldface. N = 12.
| Cerebellar PSDs | Hippocampal PSDs | Cortical PSDs | |
|---|---|---|---|
| Surface Area (μm2) | 0.32 ± 0.09 | 0.21 ± 0.03 | 0.37 ± 0.06 |
| Thickness (nm) | 115 ± 11 | 94 ± 7 | 93 ± 5 |
3.4. Immunogold labeling by Protein Categories
To directly assess whether the composition and organization of specific proteins within individual PSDs was different from each region, immunogold labeling and EM localization using antibodies to different functional classes of PSD-associated proteins was employed. First, we analyzed the global protein profiles of the PSDs isolated from adult rat cortices, hippocampi, and cerebella using Amersham Deep Purple Stain (GE Healthcare) following SDS-PAGE (Figure 9). While the PSD protein profiles exhibit similar overall patterns, there were specific differences identified between the PSD types. The protein bands whose intensities were at least twice the average band intensity within each sample are identified with asterisks (Fig. 9). These results confirm previous studies that there are compositional differences in PSDs from different brain regions identifiable by SDS-PAGE (Carlin et al., 1980) and are consistent with more recent proteomic approaches (Cheng et al., 2006). To refine our understanding of the amount and spatial distribution of individual proteins within PSDs from the different regions, primary antibodies and gold-conjugated secondary antibodies were used to label selected proteins. Three distinct protein classes were investigated: scaffolds, signaling proteins, and neurotransmitter receptors (Table 3) and are described in the following sections. A representative example of the type of primary data generated from the immunogold labeling protocol is shown in Fig. 10A. In this example, a cerebellar PSD was immunogold labeled for the scaffold molecule PSD-95, negative stained with methylamine tungstate and imaged, as described in the experimental procedures.
Figure 9.
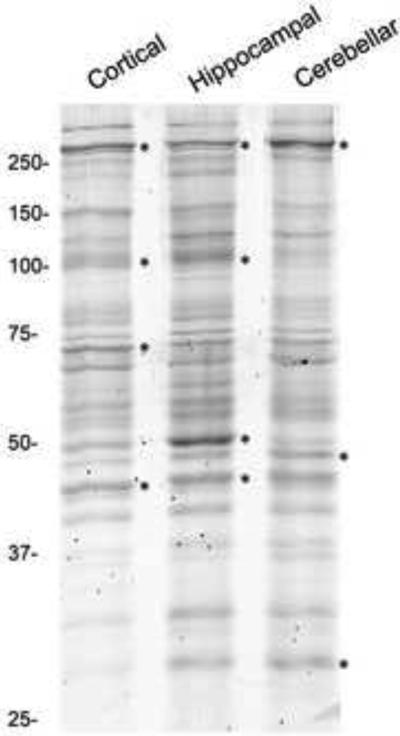
Comparison of Protein Profiles of Isolated PSDs. Deep purple stained SDS-gel of separated proteins from PSDs isolated from cortices, hippocampi, and cerebella. The major bands in each lane are indicated with asterisks and the position of molecular weight standards (in kDa) are indicated to the left of the gel. Three micrograms of total protein were loaded in each lane.
Table 3.
Summary of Immunogold Labeling Results. N = 20 PSDs per condition.
| Gold/μm2 ± SEM |
Gold/PSD ± SEM |
|||||
|---|---|---|---|---|---|---|
| Cereb. | Hippo. | Cortical | Cereb. | Hippo. | Cortical | |
| α-actinin | 27 ± 4 | 45 ± 7 | 52 ± 8 | 10 ± 2 | 18 ± 4 | 21 ± 4 |
| Actin | 24 ± 3 | 30 ± 3 | 66 ± 11 | 18 ± 2 | 18 ± 3 | 31 ± 7 |
| PSD-95 | 12 ± 4 | 27 ± 5 | 87 ± 11 | 4 ± 1 | 9 ± 3 | 32 ± 4 |
| Homer | 9 ± 3 | 24 ± 5 | 49 ± 7 | 2 ± 1 | 5 ± 1 | 14 ± 3 |
| SAP102 | 8 ± 2 | 17 ± 3 | 10 ± 2 | 3 ± 1 | 6 ± 2 | 4 ± 1 |
| Shank 1 | 25 ± 5 | 30 ± 5 | 33 ± 6 | 10 ± 2 | 9 ± 2 | 11 ± 2 |
| Shank 2 | 5 ± 2 | 13 ± 3 | 16 ± 4 | 1 ± 1 | 3 ± 1 | 3 ± 1 |
| Shank 3 | 25 ± 4 | 26 ± 5 | 59 ± 11 | 9 ± 2 | 8 ± 2 | 17 ± 4 |
|
| ||||||
| cCaMKII | 18 ± 7 | 153 ± 17 | 199 ± 21 | 5 ± 2 | 41 ± 10 | 52 ± 9 |
| βCaMKII | 80 ± 17 | 232 ± 21 | 127 ± 12 | 18 ± 3 | 59 ± 8 | 39 ± 6 |
| CaM | 12 ± 3 | 17 ± 3 | 9 ± 3 | 3 ± 1 | 8 ± 3 | 3 ± 2 |
|
| ||||||
| NR1 | 39 ± 8 | 56 ± 5 | 45 ± 8 | 11 ± 2 | 23 ± 4 | 14 ± 3 |
| NR2b | 32 ± 4 | 40 ± 4 | 26 ± 3 | 9 ± 2 | 13 ± 2 | 11 ± 2 |
|
| ||||||
| Proteasome | 46 ± 9 | 54 ± 9 | 13 ± 7 | 15 ± 3 | 20 ± 5 | 4 ± 2 |
Figure 10.

Ripley’s K Function Analysis of a Cerebellar PSD Immunogold Labeled for PSD-95. (A) Negative stain electron micrograph of a PSD from cerebella immunogold labeled for PSD-95. (B) Coordinate model for the PSD in A. Connected red points define the boundary, while the gold is represented as black points. (C) H-function for the example PSD shown in A and B. Simulated complete spatial randomness (black solid line) was normalized to zero and the Ripley’s K function of the experimental data is shown as a red line. Non-random distribution was determined by whether the red line crossed either the maximum and minimum envelopes (dashed lines) as defined by 1000 simulations of complete spatial randomness.
3.4.1. Level of Scaffold Proteins within and across each PSD Type
PSD scaffolds form the core structure of the PSD and serve to anchor neurotransmitter receptors and organize signaling proteins (Okabe, 2007). Antibodies against eight major PSD scaffolds were employed, including PSD-95, Homer, SAP102, Shank1, Shank2, Shank3, actin, and α-actinin, to test whether the composition and organization of the PSD scaffold network differs across brain regions. In PSDs isolated from adult rat cortices, the most abundant scaffold was PSD-95 which demonstrated a significantly greater average labeling density than all other scaffold proteins analyzed (Table 3). In cerebellar PSDs, labeling densities for α-actinin, Shank 1, Shank 3, and actin were approximately equally abundant and they were significantly greater than the average labeling for PSD-95, Homer, SAP102, and Shank 2 (Table 3). Labeling for α-actinin was the most abundant of all the scaffolds tested in hippocampal PSDs, while actin, Shank 1, PSD-95, Shank 3 and Homer were moderately abundant (Table 3). Labeling for Shank 2 and SAP102 was found to be the least abundant of the scaffolds in each PSD group (Table 3). For simpler comparison, the labeling densities for each scaffold were also compared across the different PSD groups (Table 4). Of the scaffold proteins evaluated, Shank 1 was the only scaffold that did not change significantly in labeling density between PSDs isolated from cerebella, hippocampi and cortices. In contrast, PSD-95 and Homer were found to differ significantly between all groups (Table 4). Labeling for PSD-95 and Homer was most abundant in cortical PSDs and least abundant in cerebellar PSDs (Table 4), of which 30% showed no labeling for PSD-95 over background. Cortical PSDs also had significantly increased labeling for actin and Shank 3 as compared to hippocampal and cerebellar PSDs (Table 4). Labeling densities for Shank 2 and α-actinin in hippocampal and cortical PSDs were significantly increased in comparison to cerebellar PSDs (Table 4).
Table 4.
Comparisons of Immunogold Labeling across PSD Types.
| CX vs. CB Labeling Density (CX ÷ CB) |
CX vs. Hippo Labeling Density (CX ÷ H) |
Hippo vs. CB Labeling Density (H ÷ CB) |
|
|---|---|---|---|
| α-actinin | 1.9 ↑* | 1.1 | 1.7 ↑* |
| Actin | 2.7 ↑** | 2.2 ↑* | 1.2 |
| PSD-95 | 7.3 ↑** | 3.2 ↑** | 2.3 ↑** |
| Homer | 5.6 ↑** | 2.1 ↑* | 2.7 ↑* |
| SAP102 | 1.2 | 0.6 | 2.3 ↑* |
| Shank 1 | 1.3 | 1.1 | 1.2 |
| Shank 2 | 3.5 ↑* | 1.3 | 2.8 ↑* |
| Shank 3 | 2.3 ↑* | 2.3 ↑* | 1 |
|
| |||
| αCaMKII | 11 ↑** | 1.3 | 8.4 ↑** |
| βCaMKII | 1.6 ↑* | 0.6 ↓** | 2.9 ↑** |
| CaM | 0.7 | 0.5 | 1.4 |
|
| |||
| NR1 | 1.2 | 0.8 | 1.4 |
| NR2b | 0.8 | 0.7 ↓* | 1.2 |
|
| |||
| Proteasome | 0.3 ↓* | 0.2 ↓* | 1.2 |
Ratios were considered significant if P < 0.05 in a 2-tailed t test, indicated with a single asterisk
boldface and double asterisks indicated a P ≤ 0.001.
Arrows indicated whether the ratios represented increased immunogold labeling
Arrows indicated whether the ratios represented decreased immunogold labeling.
N = 20 PSDs per condition.
3.4.2. Level of Signaling Molecules within and across each PSD Type
Antibodies against the α and β isoforms of CaMKII, the most abundant proteins in PSDs, and calmodulin (CaM), the calcium signal transducing activator, were used to determine labeling densities in region specific PSDs. CaMKII found in neurons is a 12-subunit holoenzyme composed of varying ratios of α and β subunits, which exhibit differential protein binding partners (Colbran, 2004) and affinities for Ca2+/CaM (Gaertner et al., 2004). In PSDs isolated from cortices, the average labeling density for αCaMKII was significantly greater than labeling for βCaMKII, while in PSDs isolated from cerebella and hippocampi the average labeling density was reversed (Table 3). When combined, labeling for α and βCaMKII was 2-4 times greater than for all other proteins evaluated, consistent with a major role for CaMKII in establishing the structure of PSDs from the three regions evaluated. In all PSDs, labeling for CaM was present, although significantly lower than αCaMKII and βCaMKII (Table 3) and was not statistically different between the groups (Table 4). Cortical and hippocampal PSDs had significantly increased labeling for αCaMKII as compared to cerebellar PSDs (Table 4). Interestingly, 60% of cerebellar PSDs showed no labeling for αCaMKII over background, further supporting the heterogeneity of PSDs isolated from the cerebellum. Cerebellar PSDs had the lowest density of both αCaMKII and βCaMKII, while hippocampal PSDs had the greatest labeling for βCaMKII (Table 3).
3.4.3. Level of Neurotransmitter Receptors within and across each PSD Type
Antibodies for several postsynaptic neurotransmitter receptors, including glutamate receptors: NR1, NR2a, NR2b, GluR1, GluR2, GluR1/5, and GluRδ2, and a GABA receptor antibody, were used in attempt to determine labeling densities for these proteins in PSDs isolated from each brain region. We did not detect labeling above background for NR2a, GluR1, GluR2, GluR1/5, GluRδ2, or GABA; only the antibodies against NR1 and NR2b positively labeled PSDs. These results may lead one to conclude that these receptors are not present in the isolated PSDs; however, it is also plausible that the epitopes to which the antibodies were raised are masked when these proteins are incorporated into the native PSD structure, preventing labeling under our experimental conditions. NR1 average labeling density was statistically greater than the labeling for NR2b in cortical and hippocampal PSDs, while labeling for NR1 and NR2b were not different in PSDs isolated from cerebella (Table 3). Comparing the average labeling densities across PSD types, there were no significant differences in NR1 or NR2b labeling, with the exception that hippocampal PSDs had more labeling for NR2b when compared to cortical PSDs (Table 4). Because NR1 is the necessary subunit to form ion conducting NMDA receptors (Kumar and Mayer, 2013) these results imply that NR subunits other than NR2b are likely present in cortical and hippocampal PSDs to form the obligate heteromeric complexes. In contrast, the majority of NMDA receptors in the cerebellum associated with PSDs may be largely composed of NR1/NR2b subunits. However, we did not attempt labeling cerebellar PSDs with antibodies to the NR2C subunit which is known to be highly enriched in cerebellar granules cells of adult rats (Monyer et al., 1994). Future experiments will be required to further refine our understanding of the NMDA receptor subunit composition associated with PSDs.
3.4.4. Level of the Proteasome within and across each PSD Type
Given recent evidence suggesting that the ubiquitin proteasome system, UPS, plays a crucial role in activity-dependent plasticity (Ehlers, 2003, Bingol and Schuman, 2006, Djakovic et al., 2009), we performed immunogold labeling experiments on each PSD group with an antibody against the proteasome. Labeling for the proteasome was present in all PSD types (Table 3), but the labeling density was significantly greater in hippocampal and cerebellar PSDs compared to cortical PSDs (Table 4). Interestingly, only 65% of cortical PSDs labeled for the proteasome. These results imply that proteasomes are present within PSDs across the brain although synapses from the different regions may differentially engage the UPS for structural modifications.
3.5 Spatial Analysis of Gold Labeling PSD-95 within Cerebellar PSDs
While measuring PSD-95 labeling densities for each group, we observed that labeling appeared clustered on cerebellar PSDs, a pattern not observed with cortical or hippocampal PSDs (Fig. 10A). To test whether the spatial distribution of PSD-95 in cerebellar PSDs was statistically non-random, we employed a Ripley’s K function based spatial analysis. A description of the analysis can be found in experimental procedures and is pictorially illustrated in Fig. 10, which shows a cerebellar PSD immunogold labeled for PSD-95 (Fig. 10A), the 2D model of the same PSD (Fig. 10B) and the results from the Ripley’s K function analysis (Fig. 10C). In Fig. 10C, the horizontal black line through 0 on the y-axis represents complete spatial randomness, the black traces represent the minimum and maximum envelopes for random distribution based on the simulated data, and the red traces represent the distribution of the gold from the data. If the red trace falls outside of the minimum or maximum envelope, the distribution is non-random. In Fig. 10C, the distribution of PSD-95 labeling is clearly non-random at both short (~ 200 nm) and long (~ 800 nm) distances, consistent with statistically significant clustering. Spatial analysis for PSD-95 labeling was assessed for 21 cerebellar PSDs, of which, 20 PSDs were determined to have non-random distribution for gold labeling PSD-95. Fourteen of the PSDs with non-random distribution deviated from random at larger distances suggesting clustering, as opposed to non-random dispersed points, indicating that PSD-95 is typically organized in clusters within cerebellar PSDs, when present.
4. DISCUSSION
The composition and structure of PSDs has been the topic of numerous studies due to their essential role in establishing and modulating synaptic transmission at excitatory synapses (Okabe, 2007, Sheng and Hoogenraad, 2007). Despite these efforts, there remain significant gaps in our understanding of the detailed anatomical structure of the PSD and the spatial distribution of the proteins from which it is composed. In this report, we employed stain- and cryo-electron tomography to directly compare PSDs isolated from cerebella, hippocampi and cortices and coupled that analysis with immunogold labeling to advance our understanding of the fine morphology and protein composition of the PSD. The PSD is a robust macromolecular structure amenable to isolation and characterization. However, interpretation of the results must be made acknowledging that the protocol for isolation likely leads to alterations in its structure and composition. In the discussion below, we focus on interpreting similarities and differences in PSDs isolated from the three different brain regions that were processed identically, permitting direct comparisons between them.
Morphological comparisons of PSDs across these three brain regions revealed both similarities and differences. Overall, they were similar in surface area but there were clear distinctions in the organization of protein modules within PSDs from the different regions. Cortical and hippocampal PSDs were disc shaped and generally displayed densely packed areas of protein with occasional areas of low or absent protein density. Ring-like structures, approximately 15-20 nm in diameter resembling CaMKII, were evident. These morphological features are consistent with previous descriptions of PSDs isolated from hippocampi (Wu and Siekevitz, 1988) and cerebral cortices (Cohen et al., 1977, Carlin et al., 1980) where the authors noted the cup/disc shaped morphology and also described PSD substructure as being composed of both particles (13-28 nm) and filaments. Areas of less protein density in the PSD center (Cohen et al., 1977, Cohen and Siekevitz, 1978, Carlin et al., 1980) or openings in the PSD mesh (Petersen et al., 2003) were also described previously, consistent with the findings reported here. We also found that a high proportion, 62% and 78% respectively, of hippocampal and cortical PSDs had tightly associated lipids. The presence of lipids associated with PSDs was previously noted (Cohen et al., 1977, Petersen et al., 2003, Swulius et al., 2010, Swulius et al., 2012). These tightly associated lipids are thought to be composed of lipid raft material (Suzuki, 2002, Petersen et al., 2003, Swulius et al., 2012) and may well play important roles in organizing the lipid composition of the overlying synaptic plasma membrane.
Most striking was comparison of PSDs from the cerebellum. Three distinct types of morphology were apparent that could be categorized by the packing and organization of protein substructures. One type was similar to the morphological features of PSDs from cortices and hippocampi that showed a relatively high protein packing density obscuring some of the fine detail. The two other types composed ~60% of the cerebellar PSDs and exhibited less dense packing of the protein substructure. Less dense (latticelike) protein packing was noted previously in cerebellar PSD preparations and these PSDs were postulated to be from inhibitory synapses (Carlin et al., 1980). However, our immunogold labeling suggests the vast majority of PSDs isolated using our protocol was from glutamatergic synapses (>95% stained positively for NMDA receptor subunits) and that the three different morphologies we classified are all from excitatory synapses. Future work will be required to relate these morphologically distinct PSDs to both their neuronal type of origin and the functional significance of their structural differences.
Additional insights into the morphology of regional PSDs was provided by quantifying the thickness and protein-to-volume ratios of PSDs imaged through ECT. We previously reported a disparity in thickness between traditionally prepared and cryo-preserved forebrain PSDs (Swulius et al., 2012) and a similar increase in thickness was found in PSDs across the three brain regions analyzed here. Cerebellar, hippocampal and cortical PSDs were six, two and three times thicker than those reported previously in serial sections of fixed and plastic embedded isolated PSDs (Carlin et al., 1980, Wu and Siekevitz, 1988) or from thin sections of fixed, plastic embedded neuropil isolated from the same brain regions (Harris et al., 1992). Interestingly, the thickness of PSDs from these earlier studies (~60-80 nm) was quite similar even though two studies (Carlin et al., 1980, Wu and Siekevitz, 1988) used isolated PSDs prepared using a nearly identical protocol to that employed in the present study, while the other (Harris et al., 1992) analyzed PSD thickness in serial sections of fixed neuropil. Therefore, isolating the PSDs from the brain does not appear to cause significant distortions in their overall morphology. We favor the explanation that the discrepancy in thickness is due to differences in methods employed to preserve and image the PSDs. The use of ECT to assess the dimensions and morphology of PSDs does not require dehydration, fixation or heavy metal staining and has advantages in retaining a more accurate representation of the structure of macromolecular assemblies (Murphy and Jensen, 2007, Koning and Koster, 2009). Consistent with this idea, we found that negatively stained PSDs isolated from cerebella and cerebral cortices, were approximately half as thick as when cryo-preserved and closer to the values historically reported for thickness of fixed or negative stained PSDs. However, we note that ultrastructural analyses on unfixed freeze substituted cultured hippocampal synapses (Chen et al., 2008) as well as cryo-preserved cultured neurons (Lucic et al., 2007) and organotypic slices (Fernandez-Busnadiego et al., 2011) also suggest that the thickness of the PSD core is less than 100 nm. Perhaps in addition to possible fixation or staining-induced anomalies, disparities reported in PSD thickness may be the result of different subjective definitions for where the boundary of the PSD ends as it extends into the spine cytoplasm. In support of this idea, another group has described a PSD “core” within 40 nm of the synaptic membrane with a PSD contiguous network extending an additional 80 nm into the spine cytoplasm, which immunogold labels for at least two PSD-associated proteins (Tao-Cheng et al., 2010, Yang et al., 2011). In total, we conclude that PSDs may be thicker and extend farther into the spine compartment than previously recognized, potentially facilitating interactions with the cytoskeleton and/or spine apparatus that reside more deeply in the spine head. The difference in hippocampal PSD thickness, compared to cortical and cerebellar PSDs, is also intriguing and suggests that differences exist in the interactions between integral PSD components that maintain their 3D architecture.
To compliment the morphological analyses, we also determined the spatial organization of a set of the major PSD-associated proteins by employing immunogold labeling. Such an approach has been strategically used in past studies to analyze the presence and distribution of PSD-associated proteins (Dosemeci et al., 2001, Valtschanoff and Weinberg, 2001, Petersen et al., 2003, DeGiorgis et al., 2006, Swulius et al., 2010). In interpreting the previous work and the studies presented here, we acknowledge that antibodies to individual proteins each bind with a different affinity and that epitopes could be inaccessible within the PSD structure. Nevertheless, the amount and patterns of distribution of labeling in PSDs across the different regions provided unique comparative insights into the roles played by each protein.
We found that PSD-95 was the most abundant scaffold in cortical PSDs, consistent with earlier studies (Cheng 2006, Dosemeci 2007), but, interestingly, it was not the most abundant scaffold in hippocampal or cerebellar PSDs. In fact, 30% of cerebellar PSDs showed no significant labeling for PSD-95 and when present, spatial analysis showed PSD-95 was clustered. PSD-95 clustering was not prominent in either hippocampal or cortical PSDs. This suggests that PSD-95 plays a unique role in forming structural/functional subdomains in cerebellar PSDs. Perhaps the PSD-95 rich domains function to cluster AMPA receptors as it has been shown by super resolution fluorescence microscopy that PSD-95 rich domains were associated with increased AMPA receptor presence, rather than NMDA receptors (MacGillavry et al., 2013). Additionally, the antibody used against PSD-95 is known to cross-react with PSD-93 (Sans et al., 2000), thus it is plausible that PSD-93 represents a portion of the labeling seen with the PSD-95 antibody. Unfortunately, labeling experiments with a PSD-93 specific antibody did not yield labeling above background, which was somewhat surprising since PSD-93 is believed to be the only MAGUK in cerebellar Purkinje cells (McGee et al., 2001). The differential labeling for PSD-95 across each PSD group indicates that PSD-95 may play distinct roles in the synapses represented from each of these regions, perhaps by differentially organizing receptors in the synaptic membrane.
Shank1 was the only scaffold for which immunogold labeling did not differ significantly across all PSD groups in either amount or spatial distribution, suggesting that it might play a functionally similar role fundamental to all PSDs. Shank1 is a multidomain protein that interacts with the actin cytoskeleton and the bridging proteins GKAP and Homer that interact with ionotropic and metabotropic glutamate receptors (Naisbitt et al., 1999, Tu et al., 1999, Grabrucker et al., 2011). Furthermore, Shank1 is also known to bind to neuroligin, an adhesion molecule involved in aligning the presynaptic and postsynaptic membranes (Meyer et al., 2004). Our results are consistent with a role for Shank1 as a scaffold to create local domains of glutamate receptors as well as bridging the PSD scaffold to the cytoskeletal network.
CaMKII is the most abundant protein in the PSD (Kennedy et al., 1983, Cheng et al., 2006, Dosemeci et al., 2007) and is an important molecule regulating synaptic plasticity (Lisman et al., 2002, Colbran and Brown, 2004). As such, understanding its composition and distribution within different PSD subtypes is of significant interest. From our immunogold labeling experiments, we calculated the ratio of the α and β isoforms to be 3:2 in cortical PSDs. Previous findings analyzing forebrain PSDs reported an α/β CaMKII ratio ranging from 3:1-6:1 (McGuinness et al., 1985, Miller and Kennedy, 1985, Cheng et al., 2006). The smaller α/β CaMKII ratio calculated in our study is likely due to the fact that we determined the amounts of CaMKII in morphologically identified PSDs and not the entire PSD fraction. Additionally, we took great care to ensure rapid isolation and cooling of the brains in order to minimize αCaMKII aggregation (Hudmon et al., 2005) and recruitment to the PSD (Aronowski et al., 1992, Suzuki et al., 1994, Kolb et al., 1995). This is a known consequence of ischemia unavoidable during brain isolation and αCaMKII enriched aggregates could contribute to the increased ratio of α to βCaMKII in fractions analyzed previously by Western blots (McGuinness et al., 1985, Miller and Kennedy, 1985) and proteomics (Cheng et al., 2006). Interestingly, we showed an even greater amount of β vs. αCaMKII in hippocampal PSDs (2:3 α/β ratio), so discrepancies with past reports and those presented here cannot be explained by the fact that we did separate analyses on hippocampal and cortical PSDs. Our ratio for cerebellar PSDs also favored βCaMKII (1:4) and was consistent with previous work (Miller and Kennedy, 1985). Interestingly αCaMKII is the dominant isoform present in Purkinje cells of the cerebellum, with βCaMKII being present throughout the cerebellum (Walaas et al., 1988). As we determined that approximately 60% of our isolated cerebellar PSDs labeled for αCaMKII while 40% did not, it is possible that the subset of isolated cerebellar PSDs that labeled for αCaMKII were PSDs from Purkinje cells while the PSDs that did not label for αCaMKII were from other cells types, such as granule cells (Voogd and Glickstein, 1998, Rollenhagen and Lubke, 2006). Overall, our α/β-CaMKII ratios suggest that βCaMKII plays a more integral role in the PSD and is present at higher concentration in cortical and hippocampal PSDs than previously appreciated. One possibility for the increased amount of βCaMKII over αCaMKII in hippocampal and cerebellar PSDs is to provide additional interactions with the spine actin network. βCaMKII can bind actin and actin filaments in a Ca2+/CaM reversible manner (Shen et al., 1998, Colbran and Brown, 2004, Sanabria et al., 2009) and has proposed structural roles as a scaffold to integrate Ca2+ signals with modifications of actin associated with PSDs and the actin cytoskeleton in spines. Additionally, α and βCaMKII have different affinities for Ca2+/CaM (Miller and Kennedy, 1985, Gaertner et al., 2004) and different frequency-dependent activation curves (De Koninck and Schulman, 1998). Our results showing that PSDs from different regions vary in their amount of α and βCaMKII suggest that differential recruitment of the enzyme could help distinctively tune the ability of a synapse to respond to the varying frequencies of Ca2+ signals.
AMPA, NMDA and metabotropic glutamate receptor subunits have been identified in proteomic studies of forebrain (Jordan et al., 2004, Li et al., 2004, Peng et al., 2004, Yoshimura et al., 2004, Cheng et al., 2006) and cerebellar PSD fractions (Cheng et al., 2006), and we expected to detect these receptors through our immunogold analysis. Additionally we expected to detect GluRδ2, which is thought to be present at cerebellar parallel fiber-Purkinje cell synapses (Takumi et al., 1999) and has been detected in isolated cerebellar PSDs (Cheng et al., 2006). In our analyses of morphologically identified PSDs, we detected significant immunolabeling for only the NMDA receptor (NR1 and NR2b subunits) whose levels were consistent between cerebellar, hippocampal and cortical PSDs. Remarkably, despite the double Triton X-100 extraction during PSD isolation, the NMDA receptor remains tightly anchored, presumably through interactions with scaffold and signaling proteins. Along with PSD-95, NR2b also binds CaMKII and both NR1 and NR2b can bind α-actinin, creating a multi-protein complex that likely stabilizes the NMDA receptor in the PSD and prevents its extraction (Strack and Colbran, 1998, Robison et al., 2005, Sheng and Hoogenraad, 2007). As a consequence, our results would indicate that the mobility of the NMDA receptor would be highly restricted. This is consistent with work that has demonstrated that a portion (~50%) of NMDA receptors are immobile at synapses (Groc et al., 2004, Triller and Choquet, 2005).
Finally, we determined that the proteasome is a component of isolated PSDs and while all cerebellar and hippocampal PSDs were positively labeled, only 65% of cortical PSDs were labeled. Since the proteasome plays a role in activity-dependent changes to PSD composition (Ehlers, 2003), it is an interesting prospect that some PSDs might integrate them into the structure while others exclude them. In response to synaptic activity, the proteasome was found to be recruited into dendritic spines (Bingol and Schuman, 2006) where it can bind to and be phosphorylated by αCaMKII, thereby increasing proteasomal activity, (Djakovic et al., 2009, Bingol et al., 2010, Djakovic et al., 2012). Once activated, several PSD proteins are targeted for degradation, including PSD-95 (Colledge et al., 2003), Shank, and GKAP (Ehlers, 2003). From our results, one can speculate that the increased labeling of hippocampal and cerebellar PSDs for the proteasome indicates that a higher percentage of synapses in these brain areas are undergoing active proteasomal remodeling than in cortex. This finding raises the additional possibility that a subpopulation of cortical PSDs (those that do not stain positive for the proteasome) are not susceptible to proteasome-mediated plasticity.
5. CONCLUSIONS
Overall, our results indicate that there are unique structural and compositional differences between PSDs isolated from different brain regions. Despite sharing similar morphology, PSDs were diverse in molecular composition, implying functional distinctions. The differential labeling for PSD scaffolds and clustering of PSD-95, suggests that the underlying PSD scaffold varies across the brain, even within brain regions, a question we are actively investigating. It is quite remarkable that PSDs of similar morphology can have such variable protein compositions and that within the cerebellum similar protein composition is observed across PSDs with such varying morphologies. We speculate that the overall structure of the PSD depends more heavily on protein organization than on protein composition, meaning that the PSD structure is largely determined by assembling similar small modules of proteins in unique ways. These issues will need to be addressed by identifying the structure of individual modules within the PSD along with higher resolution structural information about their organization. Lastly, we propose that the differential ratios of CaMKII isoforms and varying presence of the proteasome suggest that the regulation of synaptic plasticity might vary significantly at different synapses across the brain, increasing the complexity of the rules for how specific synapse types respond to synaptic activity.
Electron tomography provides novel ultrastructural information of PSDs.
PSDs from cortex, hippocampus and cerebellum show distinct subsets of proteins.
PSDs from cerebellum were composed of three distinct morphological classes.
CaMKII is the most abundant protein in PSDs from each region.
Proteasomes were more abundant in PSDs from hippocampus and cerebellum than cortex.
Acknowledgements
This work was supported by a grant from the NIH/NINDS R01NS026086. M.N.W. also acknowledges an endowment from the William Wheless III Professorship. M.M.F. acknowledges support from the NIH Training Grant 5T32GM008280, during earlier portions of this work, as well as current support from a Ruth Kirschstein NRSA award from the NIH/NINDS; F31NS084671. The Polara electron microscope was supported, in part, through the Structural Biology Imaging Center at UTHSC – Houston.
ABBREVIATIONS
- AMPA
α-Amino-3-hydroxy-5-methyl-4-isoxazolepropionic acid
- BSA
Bovine serum albumin
- CaMKII
Ca2+/calmodulin-dependent protein kinase
- CaM
Calmodulin
- EM
Electron microscopy
- ECT
Electron cryotomography
- GABA
Gamma-aminobutyric acid
- GKAP
Guanylate kinase-associated protein
- GluR
Glutamate Receptor
- HBS
HEPES buffered saline
- NMDA
N-Methyl-D-aspartate
- NP40
Tergitol-type NP-40
- PSD-95
Postsynaptic density protein 95
- PSD
Postsynaptic density
- SDS-PAGE
Sodium dodecyl sulfate polyacrylamide gel electrophoresis
- SV2
Synaptic vesicle glycoprotein 2A
Footnotes
Publisher's Disclaimer: This is a PDF file of an unedited manuscript that has been accepted for publication. As a service to our customers we are providing this early version of the manuscript. The manuscript will undergo copyediting, typesetting, and review of the resulting proof before it is published in its final citable form. Please note that during the production process errors may be discovered which could affect the content, and all legal disclaimers that apply to the journal pertain.
References
- Aronowski J, Grotta JC, Waxham MN. Ischemia-induced translocation of Ca2+/calmodulin-dependent protein kinase II: potential role in neuronal damage. J Neurochem. 1992;58:1743–1753. doi: 10.1111/j.1471-4159.1992.tb10049.x. [DOI] [PubMed] [Google Scholar]
- Bingol B, Schuman EM. Activity-dependent dynamics and sequestration of proteasomes in dendritic spines. Nature. 2006;441:1144–1148. doi: 10.1038/nature04769. [DOI] [PubMed] [Google Scholar]
- Bingol B, Wang CF, Arnott D, Cheng D, Peng J, Sheng M. Autophosphorylated CaMKIIalpha acts as a scaffold to recruit proteasomes to dendritic spines. Cell. 2010;140:567–578. doi: 10.1016/j.cell.2010.01.024. [DOI] [PubMed] [Google Scholar]
- Blomberg F, Cohen RS, Siekevitz P. The structure of postsynaptic densities isolated from dog cerebral cortex. II. Characterization and arrangement of some of the major proteins within the structure. J Cell Biol. 1977;74:204–225. doi: 10.1083/jcb.74.1.204. [DOI] [PMC free article] [PubMed] [Google Scholar]
- Carlin RK, Grab DJ, Cohen RS, Siekevitz P. Isolation and characterization of postsynaptic densities from various brain regions: enrichment of different types of postsynaptic densities. J Cell Biol. 1980;86:831–845. doi: 10.1083/jcb.86.3.831. [DOI] [PMC free article] [PubMed] [Google Scholar]
- Chen X, Vinade L, Leapman RD, Petersen JD, Nakagawa T, Phillips TM, Sheng MM, Reese TS. Mass of the postsynaptic density and enumeration of three key molecules. Proc Natl Acad Sci U S A. 2005;102:11551–11556. doi: 10.1073/pnas.0505359102. [DOI] [PMC free article] [PubMed] [Google Scholar]
- Chen X, Winters C, Azzam R, Li X, Galbraith JA, Leapman RD, Reese TS. Organization of the core structure of the postsynaptic density. Proc Natl Acad Sci U S A. 2008;105:4453–4458. doi: 10.1073/pnas.0800897105. [DOI] [PMC free article] [PubMed] [Google Scholar]
- Cheng D, Hoogenraad CC, Rush J, Ramm E, Schlager MA, Duong DM, Xu P, Wijayawardana SR, Hanfelt J, Nakagawa T, Sheng M, Peng J. Relative and absolute quantification of postsynaptic density proteome isolated from rat forebrain and cerebellum. Mol Cell Proteomics. 2006;5:1158–1170. doi: 10.1074/mcp.D500009-MCP200. [DOI] [PubMed] [Google Scholar]
- Cohen RS, Blomberg F, Berzins K, Siekevitz P. The structure of postsynaptic densities isolated from dog cerebral cortex. I. Overall morphology and protein composition. J Cell Biol. 1977;74:181–203. doi: 10.1083/jcb.74.1.181. [DOI] [PMC free article] [PubMed] [Google Scholar]
- Cohen RS, Siekevitz P. Form of the postsynaptic density. A serial section study. J Cell Biol. 1978;78:36–46. doi: 10.1083/jcb.78.1.36. [DOI] [PMC free article] [PubMed] [Google Scholar]
- Colbran RJ. Targeting of calcium/calmodulin-dependent protein kinase II. Biochem J. 2004;378:1–16. doi: 10.1042/BJ20031547. [DOI] [PMC free article] [PubMed] [Google Scholar]
- Colbran RJ, Brown AM. Calcium/calmodulin-dependent protein kinase II and synaptic plasticity. Curr Opin Neurobiol. 2004;14:318–327. doi: 10.1016/j.conb.2004.05.008. [DOI] [PubMed] [Google Scholar]
- Colledge M, Snyder EM, Crozier RA, Soderling JA, Jin Y, Langeberg LK, Lu H, Bear MF, Scott JD. Ubiquitination regulates PSD-95 degradation and AMPA receptor surface expression. Neuron. 2003;40:595–607. doi: 10.1016/s0896-6273(03)00687-1. [DOI] [PMC free article] [PubMed] [Google Scholar]
- Cotman CW, Banker G, Churchill L, Taylor D. Isolation of postsynaptic densities from rat brain. J Cell Biol. 1974;63:441–455. doi: 10.1083/jcb.63.2.441. [DOI] [PMC free article] [PubMed] [Google Scholar]
- De Koninck P, Schulman H. Sensitivity of CaM kinase II to the frequency of Ca2+ oscillations. Science. 1998;279:227–230. doi: 10.1126/science.279.5348.227. [DOI] [PubMed] [Google Scholar]
- DeGiorgis JA, Galbraith JA, Dosemeci A, Chen X, Reese TS. Distribution of the scaffolding proteins PSD-95, PSD-93, and SAP97 in isolated PSDs. Brain Cell Biol. 2006;35:239–250. doi: 10.1007/s11068-007-9017-0. [DOI] [PubMed] [Google Scholar]
- Djakovic SN, Marquez-Lona EM, Jakawich SK, Wright R, Chu C, Sutton MA, Patrick GN. Phosphorylation of Rpt6 regulates synaptic strength in hippocampal neurons. J Neurosci. 2012;32:5126–5131. doi: 10.1523/JNEUROSCI.4427-11.2012. [DOI] [PMC free article] [PubMed] [Google Scholar]
- Djakovic SN, Schwarz LA, Barylko B, DeMartino GN, Patrick GN. Regulation of the proteasome by neuronal activity and calcium/calmodulin-dependent protein kinase II. J Biol Chem. 2009;284:26655–26665. doi: 10.1074/jbc.M109.021956. [DOI] [PMC free article] [PubMed] [Google Scholar]
- Dosemeci A, Makusky AJ, Jankowska-Stephens E, Yang X, Slotta DJ, Markey SP. Composition of the synaptic PSD-95 complex. Mol Cell Proteomics. 2007;6:1749–1760. doi: 10.1074/mcp.M700040-MCP200. [DOI] [PMC free article] [PubMed] [Google Scholar]
- Dosemeci A, Tao-Cheng JH, Vinade L, Jaffe H. Preparation of postsynaptic density fraction from hippocampal slices and proteomic analysis. Biochem Biophys Res Commun. 2006;339:687–694. doi: 10.1016/j.bbrc.2005.11.069. [DOI] [PubMed] [Google Scholar]
- Dosemeci A, Tao-Cheng JH, Vinade L, Winters CA, Pozzo-Miller L, Reese TS. Glutamate-induced transient modification of the postsynaptic density. Proc Natl Acad Sci U S A. 2001;98:10428–10432. doi: 10.1073/pnas.181336998. [DOI] [PMC free article] [PubMed] [Google Scholar]
- Ehlers MD. Activity level controls postsynaptic composition and signaling via the ubiquitin-proteasome system. Nat Neurosci. 2003;6:231–242. doi: 10.1038/nn1013. [DOI] [PubMed] [Google Scholar]
- Fera A, Dosemeci A, Sousa AA, Yang C, Leapman RD, Reese TS. Direct visualization of CaMKII at postsynaptic densities by electron microscopy tomography. The Journal of comparative neurology. 2012;520:4218–4225. doi: 10.1002/cne.23151. [DOI] [PubMed] [Google Scholar]
- Fernandez-Busnadiego R, Schrod N, Kochovski Z, Asano S, Vanhecke D, Baumeister W, Lucic V. Insights into the molecular organization of the neuron by cryo-electron tomography. Journal of electron microscopy. 2011;60(Suppl 1):S137–148. doi: 10.1093/jmicro/dfr018. [DOI] [PubMed] [Google Scholar]
- Gaertner TR, Kolodziej SJ, Wang D, Kobayashi R, Koomen JM, Stoops JK, Waxham MN. Comparative analyses of the three-dimensional structures and enzymatic properties of alpha, beta, gamma and delta isoforms of Ca2+-calmodulin-dependent protein kinase II. J Biol Chem. 2004;279:12484–12494. doi: 10.1074/jbc.M313597200. [DOI] [PubMed] [Google Scholar]
- Grabrucker AM, Schmeisser MJ, Schoen M, Boeckers TM. Postsynaptic ProSAP/Shank scaffolds in the cross-hair of synaptopathies. Trends in cell biology. 2011;21:594–603. doi: 10.1016/j.tcb.2011.07.003. [DOI] [PubMed] [Google Scholar]
- Gray EG. Electron microscopy of synaptic contacts on dendrite spines of the cerebral cortex. Nature. 1959;183:1592–1593. doi: 10.1038/1831592a0. [DOI] [PubMed] [Google Scholar]
- Groc L, Heine M, Cognet L, Brickley K, Stephenson FA, Lounis B, Choquet D. Differential activity-dependent regulation of the lateral mobilities of AMPA and NMDA receptors. Nat Neurosci. 2004;7:695–696. doi: 10.1038/nn1270. [DOI] [PubMed] [Google Scholar]
- Harris KM, Jensen FE, Tsao B. Three-dimensional structure of dendritic spines and synapses in rat hippocampus (CA1) at postnatal day 15 and adult ages: implications for the maturation of synaptic physiology and long-term potentiation. J Neurosci. 1992;12:2685–2705. doi: 10.1523/JNEUROSCI.12-07-02685.1992. [DOI] [PMC free article] [PubMed] [Google Scholar]
- Hudmon A, Lebel E, Roy H, Sik A, Schulman H, Waxham MN, De Koninck P. A mechanism for Ca2+/calmodulin-dependent protein kinase II clustering at synaptic and nonsynaptic sites based on self-association. J Neurosci. 2005;25:6971–6983. doi: 10.1523/JNEUROSCI.4698-04.2005. [DOI] [PMC free article] [PubMed] [Google Scholar]
- Jordan BA, Fernholz BD, Boussac M, Xu C, Grigorean G, Ziff EB, Neubert TA. Identification and verification of novel rodent postsynaptic density proteins. Mol Cell Proteomics. 2004;3:857–871. doi: 10.1074/mcp.M400045-MCP200. [DOI] [PubMed] [Google Scholar]
- Kennedy MB, Bennett MK, Erondu NE. Biochemical and immunochemical evidence that the "major postsynaptic density protein" is a subunit of a calmodulin-dependent protein kinase. Proc Natl Acad Sci U S A. 1983;80:7357–7361. doi: 10.1073/pnas.80.23.7357. [DOI] [PMC free article] [PubMed] [Google Scholar]
- Kolb SJ, Hudmon A, Waxham MN. Ca2+/calmodulin kinase II translocates in a hippocampal slice model of ischemia. J Neurochem. 1995;64:2147–2156. doi: 10.1046/j.1471-4159.1995.64052147.x. [DOI] [PubMed] [Google Scholar]
- Koning RI, Koster AJ. Cryo-electron tomography in biology and medicine. Annals of anatomy = Anatomischer Anzeiger : official organ of the Anatomische Gesellschaft. 2009;191:427–445. doi: 10.1016/j.aanat.2009.04.003. [DOI] [PubMed] [Google Scholar]
- Kumar J, Mayer ML. Functional insights from glutamate receptor ion channel structures. Annual review of physiology. 2013;75:313–337. doi: 10.1146/annurev-physiol-030212-183711. [DOI] [PMC free article] [PubMed] [Google Scholar]
- Li KW, Hornshaw MP, Van Der Schors RC, Watson R, Tate S, Casetta B, Jimenez CR, Gouwenberg Y, Gundelfinger ED, Smalla KH, Smit AB. Proteomics analysis of rat brain postsynaptic density. Implications of the diverse protein functional groups for the integration of synaptic physiology. J Biol Chem. 2004;279:987–1002. doi: 10.1074/jbc.M303116200. [DOI] [PubMed] [Google Scholar]
- Lisman J, Schulman H, Cline H. The molecular basis of CaMKII function in synaptic and behavioural memory. Nature reviews Neuroscience. 2002;3:175–190. doi: 10.1038/nrn753. [DOI] [PubMed] [Google Scholar]
- Lucic V, Kossel AH, Yang T, Bonhoeffer T, Baumeister W, Sartori A. Multiscale imaging of neurons grown in culture: from light microscopy to cryo-electron tomography. Journal of structural biology. 2007;160:146–156. doi: 10.1016/j.jsb.2007.08.014. [DOI] [PubMed] [Google Scholar]
- MacGillavry HD, Song Y, Raghavachari S, Blanpied TA. Nanoscale scaffolding domains within the postsynaptic density concentrate synaptic AMPA receptors. Neuron. 2013;78:615–622. doi: 10.1016/j.neuron.2013.03.009. [DOI] [PMC free article] [PubMed] [Google Scholar]
- Mastronarde DN. Dual-axis tomography: an approach with alignment methods that preserve resolution. Journal of structural biology. 1997;120:343–352. doi: 10.1006/jsbi.1997.3919. [DOI] [PubMed] [Google Scholar]
- McGee AW, Topinka JR, Hashimoto K, Petralia RS, Kakizawa S, Kauer FW, Aguilera-Moreno A, Wenthold RJ, Kano M, Bredt DS. PSD-93 knock-out mice reveal that neuronal MAGUKs are not required for development or function of parallel fiber synapses in cerebellum. J Neurosci. 2001;21:3085–3091. doi: 10.1523/JNEUROSCI.21-09-03085.2001. [DOI] [PMC free article] [PubMed] [Google Scholar]
- McGuinness TL, Lai Y, Greengard P. Ca2+/calmodulin-dependent protein kinase II. Isozymic forms from rat forebrain and cerebellum. J Biol Chem. 1985;260:1696–1704. [PubMed] [Google Scholar]
- Meyer G, Varoqueaux F, Neeb A, Oschlies M, Brose N. The complexity of PDZ domain-mediated interactions at glutamatergic synapses: a case study on neuroligin. Neuropharmacology. 2004;47:724–733. doi: 10.1016/j.neuropharm.2004.06.023. [DOI] [PubMed] [Google Scholar]
- Miller SG, Kennedy MB. Distinct forebrain and cerebellar isozymes of type II Ca2+/calmodulin-dependent protein kinase associate differently with the postsynaptic density fraction. J Biol Chem. 1985;260:9039–9046. [PubMed] [Google Scholar]
- Monyer H, Burnashev N, Laurie DJ, Sakmann B, Seeburg PH. Developmental and regional expression in the rat brain and functional properties of four NMDA receptors. Neuron. 1994;12:529–540. doi: 10.1016/0896-6273(94)90210-0. [DOI] [PubMed] [Google Scholar]
- Murphy GE, Jensen GJ. Electron cryotomography. BioTechniques. 2007;43:413–415. doi: 10.2144/000112568. 417 passim. [DOI] [PubMed] [Google Scholar]
- Naisbitt S, Kim E, Tu JC, Xiao B, Sala C, Valtschanoff J, Weinberg RJ, Worley PF, Sheng M. Shank, a novel family of postsynaptic density proteins that binds to the NMDA receptor/PSD-95/GKAP complex and cortactin. Neuron. 1999;23:569–582. doi: 10.1016/s0896-6273(00)80809-0. [DOI] [PubMed] [Google Scholar]
- Okabe S. Molecular anatomy of the postsynaptic density. Molecular and cellular neurosciences. 2007;34:503–518. doi: 10.1016/j.mcn.2007.01.006. [DOI] [PubMed] [Google Scholar]
- Peng J, Kim MJ, Cheng D, Duong DM, Gygi SP, Sheng M. Semiquantitative proteomic analysis of rat forebrain postsynaptic density fractions by mass spectrometry. J Biol Chem. 2004;279:21003–21011. doi: 10.1074/jbc.M400103200. [DOI] [PubMed] [Google Scholar]
- Petersen JD, Chen X, Vinade L, Dosemeci A, Lisman JE, Reese TS. Distribution of postsynaptic density (PSD)-95 and Ca2+/calmodulin-dependent protein kinase II at the PSD. J Neurosci. 2003;23:11270–11278. doi: 10.1523/JNEUROSCI.23-35-11270.2003. [DOI] [PMC free article] [PubMed] [Google Scholar]
- Petralia RS, Sans N, Wang YX, Wenthold RJ. Ontogeny of postsynaptic density proteins at glutamatergic synapses. Molecular and cellular neurosciences. 2005;29:436–452. doi: 10.1016/j.mcn.2005.03.013. [DOI] [PMC free article] [PubMed] [Google Scholar]
- Robison AJ, Bass MA, Jiao Y, MacMillan LB, Carmody LC, Bartlett RK, Colbran RJ. Multivalent interactions of calcium/calmodulin-dependent protein kinase II with the postsynaptic density proteins NR2B, densin-180, and alpha-actinin-2. J Biol Chem. 2005;280:35329–35336. doi: 10.1074/jbc.M502191200. [DOI] [PubMed] [Google Scholar]
- Rollenhagen A, Lubke JH. The morphology of excitatory central synapses: from structure to function. Cell and tissue research. 2006;326:221–237. doi: 10.1007/s00441-006-0288-z. [DOI] [PubMed] [Google Scholar]
- Sanabria H, Swulius MT, Kolodziej SJ, Liu J, Waxham MN. {beta}CaMKII regulates actin assembly and structure. J Biol Chem. 2009;284:9770–9780. doi: 10.1074/jbc.M809518200. [DOI] [PMC free article] [PubMed] [Google Scholar]
- Sans N, Petralia RS, Wang YX, Blahos J, 2nd, Hell JW, Wenthold RJ. A developmental change in NMDA receptor-associated proteins at hippocampal synapses. J Neurosci. 2000;20:1260–1271. doi: 10.1523/JNEUROSCI.20-03-01260.2000. [DOI] [PMC free article] [PubMed] [Google Scholar]
- Shen K, Teruel MN, Subramanian K, Meyer T. CaMKIIbeta functions as an F-actin targeting module that localizes CaMKIIalpha/beta heterooligomers to dendritic spines. Neuron. 1998;21:593–606. doi: 10.1016/s0896-6273(00)80569-3. [DOI] [PubMed] [Google Scholar]
- Sheng M, Hoogenraad CC. The postsynaptic architecture of excitatory synapses: a more quantitative view. Annu Rev Biochem. 2007;76:823–847. doi: 10.1146/annurev.biochem.76.060805.160029. [DOI] [PubMed] [Google Scholar]
- Strack S, Colbran RJ. Autophosphorylation-dependent targeting of calcium/calmodulin-dependent protein kinase II by the NR2B subunit of the N-methyl-D-aspartate receptor. J Biol Chem. 1998;273:20689–20692. doi: 10.1074/jbc.273.33.20689. [DOI] [PubMed] [Google Scholar]
- Suzuki T. Lipid rafts at postsynaptic sites: distribution, function and linkage to postsynaptic density. Neuroscience research. 2002;44:1–9. doi: 10.1016/s0168-0102(02)00080-9. [DOI] [PubMed] [Google Scholar]
- Suzuki T, Okumura-Noji K, Tanaka R, Tada T. Rapid translocation of cytosolic Ca2+/calmodulin-dependent protein kinase II into postsynaptic density after decapitation. J Neurochem. 1994;63:1529–1537. doi: 10.1046/j.1471-4159.1994.63041529.x. [DOI] [PubMed] [Google Scholar]
- Swulius MT, Farley MM, Bryant MA, Waxham MN. Electron cryotomography of postsynaptic densities during development reveals a mechanism of assembly. Neuroscience. 2012;212:19–29. doi: 10.1016/j.neuroscience.2012.03.042. [DOI] [PMC free article] [PubMed] [Google Scholar]
- Swulius MT, Kubota Y, Forest A, Waxham MN. Structure and composition of the postsynaptic density during development. The Journal of comparative neurology. 2010;518:4243–4260. doi: 10.1002/cne.22451. [DOI] [PMC free article] [PubMed] [Google Scholar]
- Takumi Y, Matsubara A, Rinvik E, Ottersen OP. The arrangement of glutamate receptors in excitatory synapses. Annals of the New York Academy of Sciences. 1999;868:474–482. doi: 10.1111/j.1749-6632.1999.tb11316.x. [DOI] [PubMed] [Google Scholar]
- Tao-Cheng JH, Dosemeci A, Gallant PE, Smith C, Reese T. Activity induced changes in the distribution of Shanks at hippocampal synapses. Neuroscience. 2010;168:11–17. doi: 10.1016/j.neuroscience.2010.03.041. [DOI] [PMC free article] [PubMed] [Google Scholar]
- Triller A, Choquet D. Surface trafficking of receptors between synaptic and extrasynaptic membranes: and yet they do move! Trends in neurosciences. 2005;28:133–139. doi: 10.1016/j.tins.2005.01.001. [DOI] [PubMed] [Google Scholar]
- Tu JC, Xiao B, Naisbitt S, Yuan JP, Petralia RS, Brakeman P, Doan A, Aakalu VK, Lanahan AA, Sheng M, Worley PF. Coupling of mGluR/Homer and PSD-95 complexes by the Shank family of postsynaptic density proteins. Neuron. 1999;23:583–592. doi: 10.1016/s0896-6273(00)80810-7. [DOI] [PubMed] [Google Scholar]
- Valtschanoff JG, Weinberg RJ. Laminar organization of the NMDA receptor complex within the postsynaptic density. J Neurosci. 2001;21:1211–1217. doi: 10.1523/JNEUROSCI.21-04-01211.2001. [DOI] [PMC free article] [PubMed] [Google Scholar]
- Voogd J, Glickstein M. The anatomy of the cerebellum. Trends in cognitive sciences. 1998;2:307–313. doi: 10.1016/s1364-6613(98)01210-8. [DOI] [PubMed] [Google Scholar]
- Walaas SI, Lai Y, Gorelick FS, DeCamilli P, Moretti M, Greengard P. Cell-specific localization of the alpha-subunit of calcium/calmodulin-dependent protein kinase II in Purkinje cells in rodent cerebellum. Brain research. 1988;464:233–242. doi: 10.1016/0169-328x(88)90029-0. [DOI] [PubMed] [Google Scholar]
- Wu K, Siekevitz P. Neurochemical characteristics of a postsynaptic density fraction isolated from adult canine hippocampus. Brain research. 1988;457:98–112. doi: 10.1016/0006-8993(88)90061-3. [DOI] [PubMed] [Google Scholar]
- Yang Y, Tao-Cheng JH, Reese TS, Dosemeci A. SynGAP moves out of the core of the postsynaptic density upon depolarization. Neuroscience. 2011;192:132–139. doi: 10.1016/j.neuroscience.2011.06.061. [DOI] [PMC free article] [PubMed] [Google Scholar]
- Yoshimura Y, Yamauchi Y, Shinkawa T, Taoka M, Donai H, Takahashi N, Isobe T, Yamauchi T. Molecular constituents of the postsynaptic density fraction revealed by proteomic analysis using multidimensional liquid chromatography-tandem mass spectrometry. J Neurochem. 2004;88:759–768. doi: 10.1046/j.1471-4159.2003.02136.x. [DOI] [PubMed] [Google Scholar]