

Abstract
Background: poor cognitive and motor performance predicts neurological dysfunction. Variable performance may be a subclinical indicator of emerging neurological problems.
Objective: examine the cross-sectional association between a clinically accessible measure of variable walking and executive function.
Methods: older adults aged 60 or older from the Baltimore Longitudinal Study of Aging (n = 811) with data on the 400-m walk test and cognition. Based on ten 40-m laps, we calculated mean lap time (MLT) and variation in time across ten 40-m laps (lap time variation, LTV). Executive function tests assessed attention and short-term memory (digit span forward and backward), psychomotor speed [Trail Making Test (TMT) part A] and multicomponent tasks requiring cognitive flexibility [TMT part B, part B-A (Delta TMT) and digit symbol substitution test (DSST)]. Multivariate linear regression analysis examined the cross-sectional association between LTV and executive function, adjusted for MLT, age, sex and education, as well as the LTV × MLT interaction.
Results: the LTV was univariately associated with all executive function tests except digit span (P < 0.001); after adjustment, the association with TMT part A remained (standardised β = 0.142, P = 0.002). There was an interaction between MLT and LTV; among fast walkers, greater LTV was associated with a greater Delta TMT (β for LTV × MLT = −1.121, P = 0.016) after adjustment.
Conclusion: at any walking speed, greater LTV is associated with psychomotor slowing. Among persons with faster walking speed, variation is associated with worse performance on a complex measure of cognitive flexibility. A simple measure of variability in walking time is independently associated with psychomotor slowing.
Keywords: lap time variation, psychomotor speed, cognitive flexibility, older people
Introduction
Although poor performance on a wide range of cognitive and motor tasks predicts adverse outcomes in older adults, variable performance (defined as the fluctuation over a short period of time) provides additional insights [1–3]. Neuroimaging studies suggest that disrupted white matter structure [4] and lesions in frontal grey matter areas [5] may lead to fluctuating performance, and ultimately reduce overall speed. In older adults, poor sensorimotor performance, and walking speed in particular, is related to cognitive function, especially executive function [6–8]. Executive function, a broad term that encompasses cognitive skills, such as attention, psychomotor speed and multicomponent abilities requiring cognitive flexibility, may present as abnormally slow or variable walking performance [7, 9–11]. Most tests of walking variability require an instrumented gait laboratory to capture step-to-step variations in the timing and spacing of walking [11]. A simpler and more accessible approach to detect variability in walking is to assess temporal variation across segments or ‘laps’ of a 400-m walk [12]. Lap time variation (LTV) has been shown to predict mortality, but it is not known whether something as simple as LTV is associated with executive function. Since healthcare providers and community planners wish to screen older adults to identify and ameliorate risk, easily accessible indicators like variability across laps while walking, may play a useful role.
Many prior studies examining the associations between gait variability and executive function have tended to create a single summary variable from a set of executive function tests. Since executive function has numerous distinct aspects that reflect less or more complexity, it may be advantageous to more closely examine the patterns of association between individual tests and walking variability.
The goal of this study is to assess in community-dwelling older adults without dementia, whether LTV during a 400-m walk is associated with a range of executive function measures, and whether the association depends on mean lap time (MLT).
Methods
Participants
Participants were drawn from the Baltimore Longitudinal Study of Aging (BLSA) and included 811 men and women aged 60–96 years who were healthy enough to complete the 400-m walk test at least once between 2007 and 2013. Since 1968, older adults (>60 years of age) in the BLSA completed an expanded neuropsychological test battery to better characterise age-related cognitive changes. All 811 participants in this study underwent neuropsychological assessment and 400-m walk during the same visit. Based on a clinical adjudication process, 16 of these participants were eventually diagnosed with mild cognitive impairment and 9 with Alzheimer's disease. The study protocol was approved by the institutional review board of record at the time of data collection. All participants provided written informed consent.
Lap time variation
LTV was obtained from the 400-m Long Distance Corridor Walk (LDCW). As administered in the BLSA, the LDCW consists of a 2.5-min walk done at a normal pace followed immediately by a 400-m walk done as quickly as possible. The course is 20 m long in an uncarpeted corridor marked by orange traffic cones at either end. Participants are instructed to walk to the far cone and back for 10 laps of 40 m. Participants receive encouragement and feedback on laps remaining after completion of each lap.
For each participant, MLT (in seconds) was computed as the arithmetic mean of time to complete each of the ten 40-m laps. The LTV was measured as standard deviation (SD) of residuals around each individual trajectory. First, the individual trajectory was computed from a participant-specific regression of lap time on lap number using linear random-effects models with random intercepts and slopes. Then, the residual was computed as the difference between the lap time from each lap and the predicted lap time based on participant-specific regression of lap time on lap number. Finally, the SD of residuals from 10 laps was obtained and used in the analysis. This detrended SD is considered a more accurate measure of variability than the SD of MLT as it controls for the effect of fatigue-related slowing on variability.
Neuropsychological assessments
Cognitive function was measured by trained examiners at the same BLSA visit as the 400-m walk performance, to assess the following domains: mental status, executive function, memory, language, attention and visuospatial ability. Our main interest, based on prior evidence, was measures of executive function, but we also examined mental status and other domains to evaluate the specificity of our findings.
Executive function: multiple measures were used to assess executive function, including the Wechsler Adult Intelligence Scale—Revised (WAIS-R) digit span forward (n = 803) and digit span backward (n = 803), Trail Making Test (TMT) A (n = 662) and B (n = 645), and digit symbol substitution test (DSST) (n = 741). The digit span subtests of WAIS-R target attention and working memory [13]. The TMT is a well-established clinical assessment of psychomotor speed (Part A) and cognitive flexibility (Part B) [14]. In addition, we computed a difference score (Delta TMT) (n = 645) by subtracting time to perform TMT part A from time to perform TMT part B. Delta TMT is considered a more accurate measure of executive control function than Part B alone since it removes psychomotor speed [15]. The DSST is used as a measure of information processing speed [13].
Mental status: the Mini-Mental State Examination (n = 712) [16] and the Blessed Information-Memory-Concentration test (n = 807) [17] were used to assess global mental status.
Memory: California Verbal Learning Test [including total correct scores from List A (n = 707), short delay free recall (n = 705) and long free recall (n = 701)] [18] and Benton Visual Retention Test (n = 800) were used to measure memory [19].
Language: Letter fluency (n = 662; letters F, A and S) [20], category fluency (n = 662; fruits, animals and vegetables) [21] and the Boston Naming Test (n = 654) [22] were used to assess language.
Visuospatial ability: Card Rotations Test was used to assess spatial rotational ability [23] (n = 753).
Usual gait speed
Usual gait speed was measured on a 6-m course in an uncarpeted corridor. Participants were asked to walk at their usual and comfortable pace. Time to complete the 6-m course was measured. Two trials were completed and the faster gait speed was used for analysis in meter/second.
Statistical analysis
Pearson correlation coefficients or independent t-tests were used to assess univariate correlations of LTV and MLT with sample characteristics and executive function measures. For correlations between LTV and executive function measures that were significant at P < 0.05, we developed multivariate linear regression models, adjusted for MLT and additionally adjusted for age, sex and education. To determine the specificity of our findings, the cross-sectional associations between LTV and other cognitive function measures were also examined using linear regression models.
We further assessed whether the association between LTV and executive function depended on MLT by adding a LTV-by-MLT interaction term. The LTV and MLT were first centred at their respective means, and an interaction term was created based on centred values. Models were adjusted for age, sex and education. In this exploratory analysis, statistical significance is reported as P < 0.05. We performed an additional sensitivity analyses in the 786 participants who did not develop mild cognitive impairment or Alzheimer's disease. Results were unchanged, so were not reported further.
Results
The participants had a mean age of 72.3 years and 50.2% were female (Table 1). Greater LTV was associated with older age, higher body mass index, slower usual gait speed, lower levels of physical activity level and longer MLT (Table 1). Longer MLT was associated with older age, female gender, black race, lower education, higher body mass index and slower usual gait speed. Older age was associated with a longer time to perform TMT part B, longer Delta TMT and lower DSST scores.
Table 1.
Sample characteristics and their correlations with mobility measures (n = 811)
| Mean ± SD or n (%) | Range | Correlations with LTV: r (P) or mean difference ± SE (P) | Correlations with MLT: r (P) or mean difference ± SE (P) | |
|---|---|---|---|---|
| Demographics | ||||
| Age, years | 72.3 ± 8.3 | 60.0–90.0 | 0.218 (<0.001) | 0.442 (<0.001) |
| Female sex | 407 (50.2) | – | 0.043 ± 0.034 (0.209) | 1.93 ± 0.40 (<0.001) |
| Post-college education | 448 (55.3) | – | −0.01 ± 0.03 (0.670) | −1.43 ± 0.41 (<0.001) |
| Black race | 187 (23.1) | – | −0.015 ± 0.041 (0.718) | 1.23 ± 0.48 (0.011) |
| Health-related characteristics | ||||
| Body mass index | 27.1 ± 4.6 | 16.8–45.7 | 0.152 (<0.001) | 0.202 (<0.001) |
| Moderate to vigorous activity >150 min/week | 311 (38.6) | – | 0.09 ± 0.03 (0.003) | −3.08 ± 0.41 (<0.001) |
| Usual gait speed (m/s) | 1.14 ± 0.23 | 0.44–2.03 | −0.262 (<0.001) | −0.621 (<0.001) |
| Current smoker or quit <10 years | 28 (3.5) | – | −0.002 ± 0.095 (0.982) | −0.51 ± 1.12 (0.649) |
| Mobility measures | ||||
| MLT (s) | 28.1 ± 5.8 | 18.0–64.2 | – | – |
| LTV | 0.84 ± 0.49 | 0.15–8.55 | – | – |
| Use of walking aids during the 400-m walk test | 4 (0.5) | – | – | – |
| Executive function measures | ||||
| WAIS-R digit span forward (n = 803) | 7.7 ± 2.8 | 0–14.0 | −0.011 (0.753) | −0.101 (0.004) |
| WAIS-R digit span backward (n = 803) | 6.6 ± 2.6 | 0–14.0 | −0.043 (0.223) | −0.129 (<0.001) |
| Trials A (n = 662) | 32.8 ± 11.8 | 12.0–104 | 0.206 (<0.001) | 0.289 (<0.001) |
| Trials B (n = 645) | 83.5 ± 41.6 | 27–300 | 0.144 (<0.001) | 0.272 (<0.001) |
| Delta TMT (n = 645) | 51.2 ± 36.2 | −7.0–246.0 | 0.107 (0.006) | 0.227 (<0.001) |
| DSST (n = 741) | 45.0 ± 11.2 | 12–73 | −0.164 (<0.001) | −0.318 (<0.001) |
LTV, lap time variation; MLT, mean lap time; TMT, Trail Making Test; DSST, digit symbol substitution test.
Longer MLT was associated with all executive function measures, while greater LTV was associated with longer time to perform TMT part A, part B, Delta TMT and lower DSST scores, but not with scores on the WAIS-R digit forward and backward tests (Table 1). After adjustment for MLT, the association between LTV and TMT part A remained significant (Table 2, Model 1). There were no associations with other domains of cognitive function, including mental status, memory, language and visuospatial ability (see Supplementary Appendix S1, available in Age and Aging online).
Table 2.
Regression models of LTV predicting executive function measures that were significant at P < 0.05, standardised unit
| Unadjusted | Model 1: adjusted for MLT β (95% CI), P-value | Model 2: adjusted for MLT, age, sex and education | |
|---|---|---|---|
| Time to perform part A of TMT (n = 662) | 0.242 (0.154–0.330) <0.001 | 0.119 (0.024–0.213) 0.014 | 0.113 (0.022–0.204) 0.015 |
| Time to perform part B of TMT (n = 645) | 0.173 (0.081–0.265) <0.001 | 0.040 (−0.059 to 0.139) 0.431 | 0.041 (−0.055 to 0.137) 0.399 |
| Delta TMT (n = 645) | 0.129 (0.036–0.222) 0.006 | 0.014 (−0.086 to 0.115) 0.779 | 0.017 (−0.081 to 0.116) 0.732 |
| DSST (n = 741) | −0.195 (−0.279 to −0.110) <0.001 | −0.044 (−0.134 to 0.046) 0.336 | −0.026 (−0.107 to 0.054) 0.525 |
TMT, Trail Making Test; DSST, digit symbol substitution test.
There was a significant interaction between LTV and MLT on several executive function tests (see Supplementary Appendix S2, available in Age and Aging online, Model 1), indicating stronger associations between LTV and TMT part B, Delta TMT, and DSST scores in faster walkers (Figure 1). The slope of the association between LTV and Delta TMT increased as MLT decreased. After adjustment, the interaction between LTV and MLT on Delta TMT remained significant (see Supplementary Appendix S2, available in Age and Aging online, Model 2), while the interaction effects on TMT part B and DSST scores were slightly attenuated after adjustment to a borderline effect with a trend of P < 0.10 (see Supplementary Appendix S2, available in Age and Aging online, Model 2). There were no significant interaction effects between LTV and MLT on other cognitive domains (data not shown).
Figure 1.
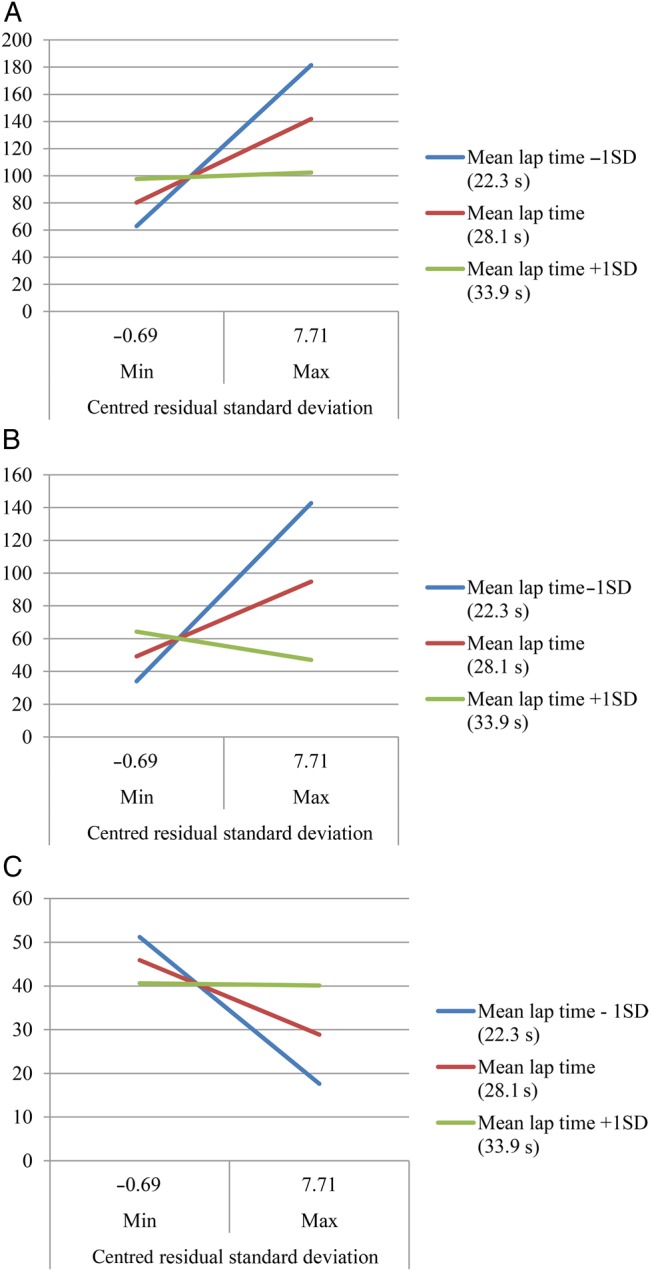
The associations of LTV with scores on TMT B (A), Delta TMT (B) and DSST (C) with representative samples at different levels of MLT.
Discussion
Using a simple, clinically accessible measure of walking variability, we found that greater LTV, independent of walking speed, was associated with psychomotor slowing as measured by TMT part A. In contrast, only in fast walkers there were associations between LTV and TMT part B, Delta TMT, and DSST, more complex tests that require greater cognitive flexibility.
This study has several novel aspects. First, our definition of walking variability is simple and accessible since it is based on times from each of the 10, 40-m laps of a 400-m walk. Since this approach requires no laboratory equipment and costs little, it may allow walking variability to be assessed in clinical and community settings [12, 24–26]. Secondly, we examined specific domains of executive function, including psychomotor speed, attention and complex aspects of cognitive flexibility. We also demonstrated the specificity of the associations between simple measures of motor variability and executive function, compared with other cognitive domains. Finally, we examined the potential modifying effect of walking time on these relationships.
Consistent with prior studies that used gait laboratories, we found many univariate associations between walking variability and executive function measures, including longer TMT part A, part B, Delta TMT and lower DSST scores [10, 11]. As in another study, we did not find an association with digit span [9].
After adjusting for MLT, the association between variability and TMT part A remained. The TMT A is the simpler of this pair of tests, and is thought to probe psychomotor speed, visuomotor scanning and attention, rather than complex cognitive flexibility. Poor performance on Trails A is a general sign of slowing and was consistently associated with variability at any walking speed. The associations between LTV with TMT part B, Delta TMT, and DSST were substantially attenuated after controlling for MLT. Adjustment for MLT may have introduced collinearity, because it is significantly correlated with LTV. Nevertheless, in our sample, variability did not provide additional explained variance beyond walking time to the more complex measures of executive function. In contrast, among fast walkers only, there were consistent findings regarding lap time variability relationships with more complex measures of executive function that requires cognitive flexibility. Perhaps increased walking variability is an early indicator of poorer executive control function even before walking slows.
This study has limitations. Overall, there was no consistent pattern between LTV and the full set of executive function measures after full adjustment. The association between LTV and TMT part A, while withstanding adjustment for multiple factors, would not hold up under a further correction for multiple testing. We chose not to correct for multiple comparisons because we felt that we were evaluating specific domains of executive function rather than six aspects of the same phenomenon. It is possible that some of our findings could be due to chance. We acknowledge that our findings would benefit from replication in another cohort. This initial study is cross sectional, while longitudinal analyses should be performed in the future. Cross-sectional studies cannot address causality.
The findings from this study suggest that a very simple measure of walking variability; LTV during a standard 400-m walk, is associated with some measures of executive function and that these associations differ by walking speed.
Key points.
A simple, clinically accessible approach to detect variability in walking is to assess temporal variation over repeated laps.
Greater LTV, independent of walking speed, is associated with psychomotor slowing.
Greater LTV appeared to be associated with worse executive control function only in faster walkers.
Supplementary data
Supplementary data mentioned in the text is available to subscribers in Age and Ageing online.
Funding
This research was supported by the Intramural Research Program of the National Institute on Aging.
Conflicts of interest
None declared.
Supplementary Material
References
- 1.Li S, Aggen SH, Nesselroade JR, Baltes PB. Short-term fluctuations in elderly people's sensorimotor functioning predict text and spatial memory performance: the Macarthur Successful Aging Studies. Gerontology 2001; 47: 100–16. [DOI] [PubMed] [Google Scholar]
- 2.Macdonald SW, Hultsch DF, Dixon RA. Predicting impending death: inconsistency in speed is a selective and early marker. Psychol Aging 2008; 23: 595–607. [DOI] [PMC free article] [PubMed] [Google Scholar]
- 3.Kliegel M, Sliwinski M. MMSE cross-domain variability predicts cognitive decline in centenarians. Gerontology 2004; 50: 39–43. [DOI] [PubMed] [Google Scholar]
- 4.Britton TC, Meyer BU, Benecke R. Variability of cortically evoked motor responses in multiple sclerosis. Electroencephalogr Clin Neurophysiol 1991; 81: 186–94. [DOI] [PubMed] [Google Scholar]
- 5.Stuss DT, Murphy KJ, Binns MA, Alexander MP. Staying on the job: the frontal lobes control individual performance variability. Brain 2003; 126(Pt 11): 2363–80. [DOI] [PubMed] [Google Scholar]
- 6.Brach JS, Van Swearingen JM, Perera S, Wert DM, Studenski SA. Motor learning versus standard walking exercise in older adults with subclinical gait dysfunction: a randomized clinical trial. J Am Geriatr Soc 2013; 61: 1879–86. [DOI] [PMC free article] [PubMed] [Google Scholar]
- 7.Ble A, Volpato S, Zuliani G et al. . Executive function correlates with walking speed in older persons: the InCHIANTI study. J Am Geriatr Soc 2005; 53: 410–5. [DOI] [PubMed] [Google Scholar]
- 8.Watson NL, Rosano C, Boudreau RM et al. . Executive function, memory, and gait speed decline in well-functioning older adults. J Gerontol A Biol Sci Med Sci, 2010; 65: 1093–100. [DOI] [PMC free article] [PubMed] [Google Scholar]
- 9.Ijmker T, Lamoth CJ. Gait and cognition: the relationship between gait stability and variability with executive function in persons with and without dementia. Gait Posture 2012; 35: 126–30. [DOI] [PubMed] [Google Scholar]
- 10.Martin KL, Blizzard L, Wood AG et al. . Cognitive function, gait, and gait variability in older people: a population-based study. J Gerontol A Biol Sci Med Sci 2013; 68: 726–32. [DOI] [PubMed] [Google Scholar]
- 11.Brach JS, Studenski SA, Perera S, Van Swearingen JM, Newman AB. Stance time and step width variability have unique contributing impairments in older persons. Gait Posture 2008; 27: 431–9. [DOI] [PMC free article] [PubMed] [Google Scholar]
- 12.Vestergaard S, Patel KV, Bandinelli S, Ferrucci L, Guralnik JM. Characteristics of 400-meter walk test performance and subsequent mortality in older adults. Rejuvenation Res 2009; 12: 177–84. [DOI] [PMC free article] [PubMed] [Google Scholar]
- 13.Wechsler D. WAIS-R Manual: Wechsler Adult Intelligence Scale-Revised. San Antonio, TX: Psychological Corporation, 1981. [Google Scholar]
- 14.Lezak MD. Neuropsychological Assessment, 3rd edition. New York: Oxford University Press, 1995. [Google Scholar]
- 15.Kortte KB, Horner MD, Windham WK. The trail making test, part B: cognitive flexibility or ability to maintain set? Appl Neuropsychol 2002; 9: 106–9. [DOI] [PubMed] [Google Scholar]
- 16.Folstein MF, Robins LN, Helzer JE. The Mini-Mental State Examination. Arch Gen Psychiatry 1983; 40: 812. [DOI] [PubMed] [Google Scholar]
- 17.Blessed G, Tomlinson BE, Roth M. The association between quantitative measures of dementia and of senile change in the cerebral grey matter of elderly subjects. Br J Psychiatry 1968; 114: 797–811. [DOI] [PubMed] [Google Scholar]
- 18.Delis DC, Massman PJ, Butters N, Salmon DP, Cermak LS, Kramer JH. Profiles of demented and amnesic patients on the California Verbal Learning Test: implications for the assessment of memory disorders. Psychol Assess 1991; 3: 19–26. [Google Scholar]
- 19.Benton A. Manuel Pour L'application du Test de Rétention Visuelle. Applications Cliniques et Expérimentales. 2nd edition Paris: Editions du Centre de Psychologie Appliquée, 1965. [Google Scholar]
- 20.Thurstone LL. Primary Mental Abilities. Psychometric Monographs, No. 1. Chicago: University of Chicago Press, 1938. [Google Scholar]
- 21.Rosen WG. Verbal fluency in aging and dementia. J Clin Neuropsychol 1980; 2: 135–46. [Google Scholar]
- 22.Kaplan EF, Goodglass H, Weintraub S. Boston Naming Test. Philadelphia: Lea & Febiger, 1978. [Google Scholar]
- 23.Ekstorm RB, French JW, Harman HH. Manual for the kit Offactor-Referenced Cognitive Tests. Princeton, NJ: Educational Testing Service, 1976. [Google Scholar]
- 24.Brach JS, Studenski SA, Perera S, Van Swearingen JM, Newman AB. Gait variability and the risk of incident mobility disability in community-dwelling older adults. J Gerontol A Biol Sci Med Sci 2007; 62: 983–8. [DOI] [PMC free article] [PubMed] [Google Scholar]
- 25.Hausdorff JM, Rios DA, Edelberg HK. Gait variability and fall risk in community-living older adults: a 1-year prospective study. Arch Phys Med Rehabil 2001; 82: 1050–6. [DOI] [PubMed] [Google Scholar]
- 26.Huang WN, VanSwearingen JM, Brach JS. Gait variability in older adults: observational rating validated by comparison with a computerized walkway gold standard. Phys Ther 2008; 88: 1146–53. [DOI] [PMC free article] [PubMed] [Google Scholar]
Associated Data
This section collects any data citations, data availability statements, or supplementary materials included in this article.