

Abstract
Background: Studies assessing the effects of protein supplementation on changes in body composition (BC) and health rarely consider the impact of total protein intake (TPro) or the change in TPro (CTPro) from participants’ usual diets.
Objective: This secondary data analysis assessed the impact of TPro and CTPro on changes in BC and metabolic syndrome (MetS) indexes in overweight and obese middle-aged adults who participated in an exercise training program.
Methods: Men and women [n = 117; age: 50 ± 0.7 y, body mass index (BMI; in kg/m2): 30.1 ± 0.3; means ± SEs] performed resistance exercise 2 d/wk and aerobic exercise 1 d/wk and consumed an unrestricted diet along with 200-kcal supplements (0, 10, 20, or 30 g whey protein) twice daily for 36 wk. Protein intake was assessed via 4-d food records. Multiple linear regression model and stratified analysis were applied for data analyses.
Results: Among all subjects, TPro and CTPro were inversely associated (P < 0.05) with changes in body mass, fat mass (FM), and BMI. Changes in BC were different (P < 0.05) among groups that consumed <1.0 (n = 43) vs. ≥1.0 to <1.2 (n = 29) vs. ≥1.2 g · kg−1 · d−1 (n = 45). The TPro group with ≥1.0 to <1.2 g · kg−1 · d−1 reduced FM and %FM and increased percentage of LM (%LM) compared with the lowest TPro group, whereas the TPro group with ≥1.2 g · kg−1 · d−1 presented intermediate responses on changes in FM, %FM, and %LM. The gain in LM was not different among groups. In addition, MetS indexes were not influenced by TPro and CTPro.
Conclusions: In conjunction with exercise training, higher TPro promoted positive changes in BC but not in MetS indexes in overweight and obese middle-aged adults. Changes in TPro from before to during the intervention also influenced BC responses and should be considered in future research when different TPro is achieved via diet or supplements. This trial was registered at clinicaltrials.gov as NCT00812409.
Keywords: dietary protein intake, aerobic and resistance exercise training, body composition, metabolic syndrome, overweight and obese middle-aged adults
Introduction
Obesity is a prevalent disorder in the United States, resulting in a negative shift in body composition (BC)4 and the accumulation of body fat (1, 2) which increase the risk of developing health morbidities that comprise the metabolic syndrome (MetS), a cluster of abnormalities related to cardiovascular disease and type 2 diabetes mellitus (3, 4). Exercise and nutrition strategies are currently viewed as effective and practical means to help reduce the risk of chronic disease associated with obesity (5). Particularly, the interaction of exercise training with higher protein intake may be an important determinant of changes in musculoskeletal and metabolic health status (6, 7).
Exercise training is a potent stimulator of muscle protein synthesis and promotes muscle hypertrophy (6, 8) and decreased fat mass (FM) (9, 10), especially when combined with higher dietary protein or essential amino acid intakes. Consumption of whey protein supplements within the context of normal eating patterns (11–13) can be an effective way to increase total protein intake (TPro), but results from investigations that examine the impact of whey protein supplementation (12–14) and TPro (15–17) on exercise training-induced changes in BC are equivocal.
Our research group conducted a prospective randomized controlled trial (RCT) that investigated the impact of isoenergetic supplements with various amounts of whey protein (0, 20, 40, 60 g/d) on BC and MetS indexes after a 36-wk period of exercise training (13). Whey protein supplementation did not influence the responses to exercise training. However, in general, studies designed to assess the effects of protein supplementation on BC changes rarely consider the impact of TPro and especially changes in TPro (CTPro; during vs. before intervention) from participants’ usual diets. Habitual TPro of ∼0.8–1.0 g · kg−1 · d−1 will permit gains in lean mass (LM) and strength and decrease FM with exercise training in middle-aged (17) and older adults (18, 19). Evidence is mounting that higher TPro will promote exercise training-induced BC changes (17, 20), but the optimum TPro during training is not established (21, 22). In addition, most research findings are from relatively short-term (≤16 wk) interventions (9, 23–25).
The primary aim of this secondary data analysis was to assess the moderating influence of TPro and CTPro on exercise-induced changes in BC and MetS indexes with the use of data from the original RCT (13). We conducted this assessment from 3 perspectives for protein intake as follows: 1) TPro as a continuous variable with the use of a multiple linear regression model; 2) CTPro during the intervention vs. each subject’s usual protein intake (postintervention value minus preintervention value) with the use of multiple linear regression; and 3) TPro as a categorical variable, <1.0, ≥1.0 to <1.2, and ≥1.2 g · kg−1 · d−1, using a stratified analysis approach. We hypothesized that higher TPro, expressed as a continuous or categorical variable, would enhance the training-induced reduction of FM and gain of LM but not influence responses of MetS indexes. In addition, we speculated that the BC responses over time would be influenced by the amount of TPro each subject consumed before the study started and that the magnitude of the CTPro would relate to the changes in BC. Specifically, subjects who increased TPro more would experience greater FM loss and LM gain.
Methods
Subjects.
Overweight and obese middle-aged men and women were recruited from the greater Lafayette/West Lafayette, Indiana area. Study participation was based on the following inclusion criteria: age 35–65 y; body mass (BM) <300 lb (136 kg); BMI (in kg/m2) of 26–35; blood pressure <160/100 mm Hg; fasting plasma glucose <110 mg/dL; total cholesterol <260 mg/dL; LDL cholesterol <160 mg/dL; and TGs <400 mg/dL; no preexisting kidney or liver conditions; not currently or within the past 6 mo consuming a weight loss diet or other special/nonbalanced diet; no weight loss/gain (≥4.5 kg) within the past 6 mo; and <2 h/wk of habitual resistance or aerobic exercise training in the past 6 mo. The Purdue University Institutional Review Board approved the study protocol, and all subjects provided written informed consent and received monetary compensation for participating.
Experimental design.
This study was a double-blind, placebo-controlled, community-based 36-wk intervention (13). After completing a 1-wk baseline period (week 0), subjects were randomly assigned to 1 of 4 groups and were instructed to consume the assigned dietary supplements. All subjects performed resistance exercise 2 d/wk and aerobic exercise 1 d/wk for 36 wk. Measurements taken before and at the end of intervention (week 36) were included in the present analyses. Subjects had to complete valid 4-d food records before and after the intervention for their data to be included in this secondary data analysis. Of the 188 subjects who completed the intervention, data from 117 subjects were used (Figure 1).
FIGURE 1.
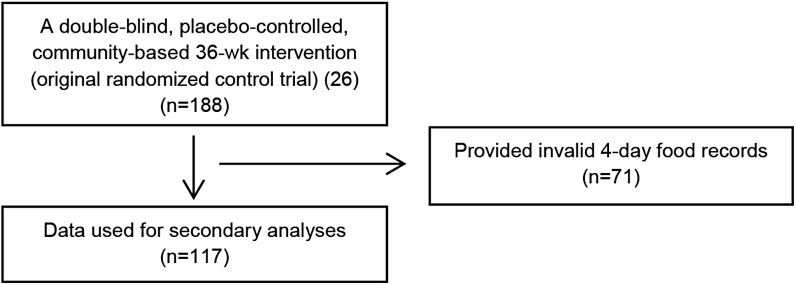
Consort flow diagram.
Whey protein supplementation.
During the intervention, each subject was instructed to consume supplements with 200 kcal and 0, 10, 20, or 30 g whey protein twice daily with breakfast and lunch. Daily whey protein intakes were 0, 20, 40 and 60 g/d, respectively. Supplements were manufactured and provided by DH Business Consulting. Subjects were told that the supplements provided 400 kcal energy/d but were not counseled to purposefully alter their usual eating behaviors.
Dietary intake assessment.
Four-day food records completed at weeks 0 and 36 were used to estimate daily energy, protein, carbohydrate, and fat intakes and the CTPro (postintervention value − preintervention value) (Nutritionist Pro; First DataBank version 1.3.36). For descriptive and analytical purposes, the dietary data obtained after the intervention was presumed to reflect each subject’s dietary intakes throughout the intervention. The age- and sex-specific Schofield equations (27) were used to estimate resting energy expenditure (REE) for the purpose of validating the food records (13). Food records were considered valid if they fell within the previously established lower and upper 95% CIs (energy intake, REE cutoffs 95% CI: 1.02, 2.35) (28).
Exercise training and testing.
Each subject was provided a membership to use at 1 of 5 local fitness facilities in the Lafayette/West Lafayette, Indiana area. During baseline, a fitness instructor acclimated subjects to the resistance and aerobic exercise equipment and procedures.
On 2 nonconsecutive days per week subjects completed resistance exercise in which 3 sets of 8–10 repetitions were performed, as previously described (29, 30). The following resistance exercises were performed during the first session of each week: chest press, arm pull down, seated leg press, and bicep curl. During the second resistance exercise session of each week, the remaining resistance exercises were performed: shoulder press, leg extension, leg curl, triceps extension, and abdominal crunch. Each exercise session included a 10-min warm-up and a 10-min cool-down period with the use of a treadmill, stationary bike, recumbent bike, or elliptical trainer.
On 1 d/wk, subjects completed a 60-min aerobic exercise session with the use of a treadmill, stationary bike, recumbent bike, or elliptical trainer. The initial prescribed intensity was 50% of estimated maximal heart rate and gradually increased to 70% at week 4 and through the end of the study as previously described (13). Maximum oxygen consumption was estimated with the submaximum modified Bruce protocol (31). Subjects walked on a treadmill at various inclines and speeds until reaching 85% of their estimated maximum heart rate. Maximum oxygen uptake capacity (in mL O2 · kg−1 · min−1) was estimated with the American College of Sports Medicine guidelines (31).
Study compliance.
Study participants completed self-reported dietary supplement consumption logs daily and exercise training logs after each exercise session. On the basis of the supplement and exercise training logs provided, participants were classified into 3 compliance categories for supplementation (<50%, 50–79%, and ≥80% of supplements consumed) and exercise training (<70%, 70–89%, and ≥90% of sessions completed) (13).
Anthropometrics and BC.
Subjects self-measured and -recorded their BM biweekly during the 36-wk intervention. These BM measurements were made on site at the Purdue University Clinical Research Center without regard to fasting or fed state. Waist circumference was measured in the standing position at the narrowest area between the lateral lower rib and the iliac crest in triplicate, and the mean value was reported. Fasting state BM, FM, and LM were measured every 9 wk with the use of the BOD POD Gold Standard Body Composition Tracking System (COSMED USA, Inc.), and the ratio of LM to FM (LM:FM) was calculated by dividing LM by FM. Fasting state whole and regional (arms, legs, trunk, android, and gynoid) BM, FM, and LM were also determined before and after the intervention with the use of DXA (LUNAR iDXA Lunar enCORE version 11.2; GE Medical Systems). Percentages of LM and FM were calculated by dividing LM and FM by BM and multiplying each ratio by 100.
Technically, the air displacement plethysmography (BOD POD) technique measures FM and fat free-mass which includes water, protein, and both bone and nonbone mineral (32), whereas DXA measures FM, LM, and bone mineral (33). The fat free-mass and LM compartments measured by BOD POD and DXA, respectively, are comparable in overweight and obese adults (34–36), and for clarity and descriptive purposes we used the term LM throughout the study.
MetS-related blood profiles and blood pressures.
Blood samples were collected in the fasting state before and after the intervention into tubes that contained a clot activator to obtain serum or sodium heparin to obtain plasma (BD Vacutainer Brand; Becton Dickinson). Serum tubes were sent to Mid America Clinical Laboratories, and total cholesterol, HDL cholesterol, and TGs were measured by photometric assays (Chemistry Immuno Analyzer AU5700; Olympus). LDL cholesterol was calculated with the Friedewald equation (37). Plasma tubes were centrifuged at 4°C for 10 min at 3000 × g, and aliquots were stored at −80°C until thawed for glucose and insulin analyses. Plasma glucose and insulin concentrations were measured in duplicate by enzymatic colorimetry with the use of an oxidase method on a COBAS Integra 400 analyzer (Roche Diagnostic Systems) and measured by an electrochemiluminescence immunoassay method on the Elecsys 2010 analyzer (Roche Diagnostic Systems), respectively. The HOMA-IR and whole-body (composite) insulin sensitivity index were calculated as previously described (38, 39).
Both systolic and diastolic blood pressures were measured in duplicate with the use of an automated sphygmomanometer (Advantage 6014 Advanced Blood Pressure Monitor; American Diagnostic Corporation) after the subject rested in a sitting position for 15 min.
Appetite.
Subjects completed visual analog questionnaires that assessed hunger, fullness, and desire to eat every waking hour for 4 d before and after the intervention. Daily hunger, fullness, and desire to eat total AUCs were calculated (40). The questionnaire had a 13-point numerical rating scale (arbitrary units) with the left anchor of 1 to mean not at all and the right anchor of 13 to mean extremely (41).
REE.
Subjects reported to the laboratory after a 10-h overnight fast and rested 30 min to acclimate to the room environment. An indirect calorimeter was used to measure REE for the next 30 min (MedGraphics Cardiopulmonary Diagnostics Systems; MedGraphics Corporation). The first 10 min of data were excluded because it was considered an adjustment period.
Statistical analysis.
A multiple linear regression model was used to assess the association between TPro during intervention and changes in whole and regional BC, appetite, REE, and MetS indexes (i.e., the dependent variables). Estimates that indicated the association between TPro and those change values were adjusted for age, sex, total carbohydrate and fat intakes during the intervention, and preintervention values of the dependent variables, as appropriate. The multiple linear regression model used to assess the association between CTPro and these dependent variables was adjusted for age, sex, preintervention values of the dependent variables, preintervention TPro, and changes in carbohydrate and fat intakes.
Data analyses were conducted to assess the impact of consuming <1.0 vs. ≥1.0 to <1.2 vs. ≥1.2 g · kg−1 · d−1 TPro on changes in the dependent variables [n = 117; <1.0 (n = 43), ≥1.0 to <1.2 (n = 29), and ≥1.2 g · kg−1 · d−1 (n = 45)]. Repeated-measures ANOVA was used to determine the main effects of time and TPro and time-by-TPro interactions. One-factor ANOVA with post hoc Tukey test was applied to examine differences in changes over time among the TPro groups for the dependent variables. In addition, those change values were adjusted for age, sex, total carbohydrate and fat intakes during the intervention, and preintervention variable values. Paired t tests were also used to compare differences from before the intervention.
We also investigated whether a participants’ preintervention TPro influenced the responses over time. We ran a model that stratified the CTPro effect on the basis of TPro effect. We did not find any differences; the CTPro effect was consistent across TPro amounts. Standard diagnostic checks were used to assess the fit of the model. Specifically, the residuals were examined to assess the assumptions of independence, constant variance, and normal distribution. Leverage and influential observations were also investigated. All analyses were performed with SAS version 9.2 and R version 2.14.1 (SAS Institute Inc.). Diagnostic checks were used to assess the assumption that each protein intake group was approximately normally distributed. Data are presented as means ± SEs, unless otherwise noted, and statistical significance was accepted at P < 0.05. For clarity, the effects of TPro during the intervention and the CTPro from before the intervention are described separately in the section below.
Results
Before the intervention, the characteristics of the 117 subjects were as follows: BM (87.7 ± 1.1 kg), BMI (30.1 ± 0.3), %FM (40.2% ± 0.6%), and age (50 ± 0.7 y). Mean TPro before and after the intervention were 1.03 ± 0.02 and 1.18 ± 0.03 g · kg−1 · d−1, respectively, and mean CTPro was 0.15 ± 0.04 g · kg−1 · d−1 during the intervention. As expected, the CTPro was highly variable among subjects, ranging from −0.87 to 1.21 g · kg−1 · d−1, because the subjects consumed supplements with different amounts of whey protein and self-chose how to adjust their usual diets to compensate for the 400 kcal/d from the supplements. Mean total carbohydrate intakes before and after the intervention were 3.12 ± 0.08 and 3.37 ± 0.08 g · kg−1 · d−1, respectively, and mean change in total carbohydrate intakes was 0.25 ± 0.09 g · kg−1 · d−1 during the intervention. Mean total fat intakes before and after the intervention were 1.02 ± 0.03 and 0.92 ± 0.02 g · kg−1 · d−1, respectively, and mean change in total fat intakes was −0.10 ± 0.03 g · kg−1 · d−1 during the intervention. Among all subjects, the TPro during the intervention period was not correlated with total carbohydrate and fat intakes during the intervention. However, CTPro was positively related to change in fat intake (r = 0.51, P < 0.0001) but not related to change in carbohydrate intake (r = 0.11, P = 0.23).
During the first half of the study (before the intervention to 18 wk), 95% of the participants consumed ≥50% of the supplements and 98% completed 70% of the exercise sessions (Supplemental Table 1). During the second half of the study (19 wk to after the intervention), 92% of the participants consumed ≥50% of the supplements and 93% completed 70% of the exercise sessions.
Findings based on multiple linear regressions
Whole and regional BC.
Among all subjects, both TPro and CTPro were inversely associated with changes in BM, FM, and BMI, but they were not associated with a change in LM. Although TPro was not associated with changes in %FM and %LM, CTPro was negatively associated with change in %FM and positively associated with change in %LM (Table 1). Comparable results were observed for regional (arms, legs, trunk, android, and gynoid) BM, FM, %FM, LM, and %LM changes (Supplemental Table 2).
TABLE 1.
Impact of TPro and CTPro on the changes in whole-body composition, appetite, and REE after a 36-wk exercise training intervention1
| TPro, g · kg−1 · d−1 |
CTPro, g · kg−1 · d−1 |
|||
| Response | β2 (95% CI) | P | β3 (95% CI) | P |
| Body composition | ||||
| ∆ Body mass, kg | −2.80 (−4.82, −0.79) | 0.007 | −3.36 (−5.25, −1.46) | 0.001 |
| ∆ FM, kg | −2.06 (−3.80, −0.32) | 0.021 | −2.62 (−4.21, −1.02) | 0.002 |
| ∆ %FM | −1.06 (−2.26, 0.14) | 0.08 | −1.52 (−2.61, −0.42) | 0.007 |
| ∆ LM, kg | −0.69 (−1.44, 0.05) | 0.07 | −0.69 (−1.40, 0.02) | 0.06 |
| ∆ %LM | 0.98 (−0.17, 2.13) | 0.09 | 1.41 (0.36, 2.45) | 0.009 |
| ∆ BMI, kg/m2 | −0.97 (−1.69, −0.26) | 0.008 | −1.18 (−1.85, −0.51) | 0.001 |
| Appetite | ||||
| ∆ AUC hunger, AU × 11 h | −0.61 (−1.44, 0.21) | 0.15 | −0.55 (−1.33, 0.23) | 0.17 |
| ∆ AUC fullness, AU × 11 h | 0.24 (−0.45, 0.94) | 0.49 | 0.33 (−0.32, 0.97) | 0.32 |
| ∆ AUC desire to eat, AU × 11 h | −0.58 (−1.44, 0.27) | 0.18 | −0.56 (−1.36, 0.23) | 0.16 |
| REE | ||||
| ∆ REE, kcal/kg | 1.18 (−1.92, 4.27) | 0.45 | 0.47 (−2.35, 3.29) | 0.74 |
n = 117. AU, arbitrary unit; CTPro, change in total protein intake (postintervention value − preintervention value); FM, fat mass; LM, lean mass; REE, resting energy expenditure; TPro, total protein intake.
Estimates of adjusted regression coefficient between TPro with changes in body composition, appetite, and REE. All estimates are adjusted for age, sex, preintervention variable values, and total carbohydrate and fat intakes during the intervention.
Estimates of adjusted regression coefficient between CTPro with changes in body composition, appetite, and REE. All estimates are adjusted for age, sex, preintervention variable values, changes in carbohydrate and fat intakes, and preintervention TPro.
Appetite and REE.
Both TPro and CTPro were not associated with changes of hunger, fullness, and desire to eat (Table 1). In addition, no associations were observed between TPro and change of REE and CTPro and change of REE, respectively (Table 1).
MetS-related health profiles.
No associations were observed between TPro and changes in MetS indexes, including waist circumference, glucose, TGs, HDL cholesterol, and systolic and diastolic blood pressures, and changes in MetS-related indexes (total cholesterol, LDL cholesterol, insulin, HOMA-IR, and insulin sensitivity index) (Table 2). Comparable results were observed between CTPro and changes of MetS indexes and MetS-related indexes.
TABLE 2.
Impact of TPro and CTPro on the changes in MetS-related health profiles after a 36-wk exercise training intervention1
| TPro, g · kg−1 · d−1 |
CTPro, g · kg−1 · d−1 |
|||
| Response | β2 (95% CI) | P | β3 (95% CI) | P |
| MetS indexes | ||||
| ∆ Waist circumference, cm | 0.67 (−2.04, 3.37) | 0.63 | 0.65 (−1.92, 3.22) | 0.62 |
| ∆ Glucose, mg/dL | 3.70 (−0.41, 7.81) | 0.08 | 3.10 (−0.78, 6.98) | 0.12 |
| ∆ TG, mg/dL | −8.42 (−48.4, 31.6) | 0.68 | −6.74 (−44.2, 30.7) | 0.72 |
| ∆ HDL cholesterol, mg/dL | 2.10 (−2.47, 6.68) | 0.64 | 2.63 (−1.75, 7.01) | 0.24 |
| ∆ Systolic BP, mm Hg | −0.89 (−9.33, 7.55) | 0.84 | 0.72 (−7.12, 8.56) | 0.86 |
| ∆ Diastolic BP, mm Hg | −0.73 (−5.83, 4.37) | 0.78 | −0.65 (−5.43, 4.14) | 0.79 |
| MetS-related indexes | ||||
| ∆ Total cholesterol, mg/dL | 7.20 (−5.14, 19.5) | 0.25 | 5.30 (−6.42, 17.0) | 0.37 |
| ∆ LDL cholesterol, mg/dL | 8.92 (−1.93, 19.8) | 0.11 | 6.87 (−3.31, 17.0) | 0.18 |
| ∆ Insulin, μU/mL | −2.01 (−6.40, 2.39) | 0.37 | −1.14 (−5.32, 3.04) | 0.59 |
| ∆ HOMA-IR | −0.38 (−1.14, 0.98) | 0.58 | −0.14 (−1.43, 1.15) | 0.83 |
| ∆ Insulin sensitivity index | 0.86 (−0.99, 2.72) | 0.36 | 1.40 (−0.34, 3.14) | 0.11 |
n = 117. BP, blood pressure; CTPro, change in total protein intake (postintervention value − preintervention value); MetS, metabolic syndrome; TPro, total protein intake.
Estimates of adjusted regression coefficient between TPro with changes in MetS indexes and MetS-related indexes. All estimates are adjusted for age, sex, preintervention variable values, and total carbohydrate and fat intakes during the intervention.
Estimates of adjusted regression coefficient between CTPro with changes in MetS indexes and MetS-related indexes. All estimates are adjusted for age, sex, preintervention variable values, changes in carbohydrate and fat intakes, and preintervention TPro.
Findings based on stratified analyses
Whole and regional BC.
Over time, BM increased in the group that consumed <1.0 g · kg−1 · d−1 and was unchanged in the groups that consumed ≥1.0 to <1.2 and ≥1.2 g · kg−1 · d−1. This TPro-dependent response was supported by BM data measured biweekly (Supplemental Figure 1), quarterly (Figure 2), and before and after the intervention (Figure 3 and Supplemental Table 3). TPro influenced changes over time in FM and LM:FM measured with plethysmography (Figure 2) and FM, %FM, and %LM measured with DXA (Figure 3 and Supplemental Table 3). Specifically, FM, LM:FM, %FM, and %LM were not changed in the <1.0 g · kg−1 · d−1 protein group, whereas FM and %FM decreased and LM:FM and %LM increased in the ≥1.0 to <1.2 and ≥1.2 g · kg−1 · d−1 protein groups (Figures 2 and 3 and Supplemental Table 3). All 3 groups increased LM, independent of TPro (Figures 2 and 3 and Supplemental Table 3). Comparable results were observed for trunk and android regional BM, FM, %FM, LM, and %LM changes (Supplemental Table 4).
FIGURE 2.

Baseline corrected changes in BM (A), FM (B), LM (C), and LM:FM (D) every 9 wk during a 36-wk exercise training intervention among groups who consumed <1.0 (n = 43), ≥1.0 to <1.2 (n = 29), and ≥1.2 (n = 45) g · kg−1 · d−1. Results are reported as means ± SEs. Analyses are adjusted for age, sex, preintervention variable values, and total carbohydrate and fat intakes during the intervention. *Different from zero, P < 0.05 (i.e., the change from before to after the intervention is significant). Values without a common letter are significantly different, P < 0.05. BM, body mass; FM, fat mass; LM, lean mass; LM:FM, ratio of LM to FM.
FIGURE 3.

The changes in BM, FM, LM, %FM, and %LM throughout the 36-wk intervention among groups who consumed <1.0 (n = 43), ≥1.0 to <1.2 (n = 29), and ≥1.2 (n = 45) g · kg−1 · d−1. Results are reported as means ± SEs. Analyses are adjusted for age, sex, preintervention variable values, and total carbohydrate and fat intakes during the intervention. *Different from zero, P < 0.05 (i.e., the change from before to after the intervention is significant). Values without a common letter are significantly different, P < 0.05. BM, body mass; FM, fat mass; LM, lean mass; LM:FM, ratio of LM to FM.
Appetite and REE.
Compared with baseline, daily hunger and desire to eat were lower in the highest TPro group (≥1.2 g · kg−1 · d−1) but unchanged in the other 2 groups (P < 0.05) (Supplemental Table 3). Daily fullness was not changed over time or influenced by TPro. REE increased over time and was not statistically influenced by TPro (Supplemental Table 3).
MetS-related health profiles.
Plasma glucose was increased over time in the highest TPro group (≥1.2 g · kg−1 · d−1), but no changes were found in the other 2 groups (Supplemental Table 5). Except plasma glucose, MetS indexes, and MetS-related indexes were not changed over time and not influenced by TPro.
Discussion
The primary finding from this secondary data analysis was that higher TPro during exercise training was associated with improvements in whole and regional BC as assessed with multiple linear regression analysis. Findings from the stratified analysis indicated that FM and %FM decreased and %LM increased in the groups that consumed ≥1.0 g · kg−1 · d−1 TPro but not the group that consumed <1.0 g · kg−1 · d−1 TPro. These BC changes were comparable in the groups that consumed ≥1.0 to <1.2 and ≥1.2 g · kg−1 · d−1, respectively. The observations of the association between TPro and BC changes from the present secondary data analyses are consistent with what we initially hypothesized for the original prospective RCT (13). We expected whey protein supplementation to enhance BC improvements in middle-aged overweight and obese adults over a 36-wk period of aerobic and resistance exercise training. However, whey protein supplementation apparently did not influence changes in LM and FM (13).
The contrasting outcomes from the original RCT and the present secondary analyses may be due to the different independent variables (TPro vs. whey protein, respectively). In addition, unlike the present study, the original study did not consider other components of diet (e.g., carbohydrate and fat intakes) or other sources of dietary protein. We also applied stricter study population criteria for this secondary data analysis. Of the 188 individuals who completed the original study, we extracted data from 117 individuals who provided validated 4-d food records (28) at weeks 0 and 36. It is generally acknowledged that accurate measurements of dietary intake via food records is difficult to accomplish in studies of human nutrition and health (28). Applying most plausible food records is important for the present study because we observed study participants’ TPro, including their habitual intake. Collectively, these study design and data processing issues underscore the likely inappropriateness of comparing the results of the present study with results from the original RCT.
Our finding that higher TPro was inversely associated with FM and %FM during the 36-wk intervention is consistent with results from a recent meta-analysis (weighted mean difference: −0.11 kg; 95% CI: −0.50, 0.29 kg) (20) and a RCT that provided higher TPro (80 vs. 59 g/d) and habitual physical activity during the 3-mo intervention (42). In this RCT, the higher TPro group lost both FM and %FM compared with the control group (−0.6 vs 0.1 kg; −1.0% vs. 0.1%, respectively), and linear regression also showed negative relations between daily TPro and FM and %FM. Dietary TPro-induced increases in whole-body energy expenditure, including REE and thermic effect of feeding, are often cited to help explain the benefit of higher TPro on changes in FM (43–45). Although REE was increased over time in the present study, TPro intake apparently did not influence this response, consistent with past research (46). Higher TPro may also cause greater postprandial energy expenditure (i.e., thermic effect of feeding) (43, 44, 47), but this variable was not measured in the present study. Thus, further study is needed to gain a better understanding of the long-term effect of higher protein intake in combination with exercise training on postprandial energy expenditure. Although we did not observe an association between TPro and LM change in the present study, higher TPro was positively associated with change in %LM. These results reflect the greater FM loss vs. LM loss with higher TPro and are generally consistent with previous research which reported increased ratio of LM to BM after higher TPro in combination with exercise training due to no change in LM but a decrease in FM (48).
To better understand the impact of TPro on exercise-induced changes in BC and MetS indexes, we also stratified our subjects into 3 TPro groups <1.0, ≥1.0 to <1.2, and ≥1.2 g · kg−1 · d−1, respectively. The TPro value of 1.0 g · kg−1 · d−1 was chosen according to previous retrospective regression analysis of data from 106 men and women age 50–80 y who participated in dietary protein intake and resistance training studies (22). When TPro was regressed with resistance training-induced changes in whole-body LM, the regression line crossed the line of neutrality (no change in LM) at a TPro of ∼1.0 g · kg−1 · d−1. Results from the present stratified analysis that groups of subjects who consumed ≥1.0 g · kg−1 · d−1 presented BM maintenance with greater reductions in FM and % FM and an increase in % LM and LM:FM observed by biweekly BM records and multiple BC assessments with the use of independent methods support consuming more than this amount of TPro during exercise training (22, 49, 50). However, note that the apparently positive impact of higher TPro intake on FM was not observed for LM; all groups gained comparable LM over time. This result is consistent with other prospective trials that have shown little impact of higher protein intake on exercise-induced LM change in middle-aged adults (23, 24, 51). Another noteworthy observation is that no additional effects were observed on BC changes between groups that consumed ≥1.0 to <1.2 and ≥1.2 g · kg−1 · d−1, respectively. Consistent with previous findings (23, 24), these results suggest that consuming ≥1.2 g · kg−1 · d−1 may not augment the improvement in BC during exercise training in middle-aged overweight and obese adults. Comparable associations were observed between regional (arms, legs, trunk, android, and gynoid) BC changes and TPro. However, consumption of diets that contained moderately higher protein did not differentially affect regional BC response to resistance training in older people (19). Limited research exists; thus, further clinical trials are required to assess the impact dietary protein intake on regional BC changes during exercise training.
Although higher TPro improved BM and BC responses over time with exercise training, it did not influence MetS responses. Dynamic changes in BC are recognized as an important determinant for risk of MetS (52), and it is suggested that improvement in BC may decrease the risk of MetS (53, 54). In addition, %BF or regional fat distribution, abdominal fat in particular, makes an important contribution to metabolic abnormalities (53, 55). To date, limited data exist on the impacts of TPro with exercise training on MetS indexes, and relevant studies generally applied hypoenergetic diets to induce weight loss in overweight and obese adults (56–58). Although weight loss improved some MetS indexes, TPro did not influence these responses. Similarly, high protein intake (∼40% of energy intake from dietary protein) vs. moderate protein intake (∼25% of energy intake from dietary protein) during exercise training did not influence the responses in fasting plasma lipid–lipoprotein profile and glucose and insulin concentrations (48). Notwithstanding that the present results are from secondary data analyses, collectively higher TPro may not have beneficial effects on MetS indexes, although TPro improves BC. This finding challenges the notion that protein-induced changes in BC are beneficial to health, although more research is warranted.
The present study assessed the association between CTPro and BC changes with the use of multiple linear regression analysis, and we found that a greater increase in TPro from before to during the intervention was inversely associated with changes in FM and %FM and was positively associated with change in %LM. These observations complement our previous research showing that changes in protein intake predict changes in bone mineral density (inverse association) in older women (59) and support that muscle and strength gains from resistance training are augmented by greater increases in habitual TPro from before to during the intervention (60). Collectively, these findings indicate that CTPro should be carefully documented and assessed as a potential BC modifier.
Strengths of the study include the successful completion of a 36-wk, free-living diet and exercise intervention in middle-aged overweight and obese adults. In addition, we used TPro data from individuals who provided validated 4-d food records, and this approach improves the accuracy of the food intake data. However, findings from this study should be interpreted with caution because of the nature of the secondary data analyses. In addition, although we accounted for multiple potential confounders as covariates, the impact of other confounders may still exist, as does the potential for type 1 (false positive) errors when multiple statistical analyses are performed without adjusting the significance level for each test.
In conclusion, findings from this study specify that higher TPro promoted positive changes in BC but not indexes of MetS in conjunction with combined resistance and aerobic exercise training in overweight and moderately obese middle-aged adults on the basis of both multiple linear regression and stratified analysis approaches. Changes in TPro from before to during the intervention might also influence BC responses over time and should be considered in future research when different TPro are achieved via diet or supplements.
Acknowledgments
WWC designed the research; JEK, AFA, SLG, and EMW-H conducted the research; JEK, AFA, and SLG analyzed the data; WWC and JEK wrote the paper; WWC and JEK have primary responsibility for the final content. All authors read and approved the final manuscript.
Footnotes
Abbreviations used: BC, body composition; BM, body mass; CTPro, change in total protein intake; FM, fat mass; LM, lean mass; MetS, metabolic syndrome; RCT, randomized controlled trial; REE, resting energy expenditure; TPro, total protein intake.
References
- 1.Flegal KM, Carroll MD, Ogden CL, Curtin LR. Prevalence and trends in obesity among US adults, 1999–2008. JAMA 2010;303:235–41. [DOI] [PubMed] [Google Scholar]
- 2.Villareal DT, Apovian CM, Kushner RF, Klein S. Obesity in older adults: technical review and position statement of the American Society for Nutrition and NAASO, The Obesity Society. Am J Clin Nutr 2005;82:923–34. [DOI] [PubMed] [Google Scholar]
- 3.Malnick SD, Knobler H. The medical complications of obesity. QJM 2006;99:565–79. [DOI] [PubMed] [Google Scholar]
- 4.Rhéaume C, Leblanc MÉ, Poirier P. Adiposity assessment: explaining the association between obesity, hypertension and stroke. Expert Rev Cardiovasc Ther 2011;9:1557–64. [DOI] [PubMed] [Google Scholar]
- 5.Church T. Exercise in obesity, metabolic syndrome, and diabetes. Prog Cardiovasc Dis 2011;53:412–8. [DOI] [PubMed] [Google Scholar]
- 6.Evans WJ. Protein nutrition, exercise and aging. J Am Coll Nutr 2004;23:601S–9S. [DOI] [PubMed] [Google Scholar]
- 7.Wolfe RR. The underappreciated role of muscle in health and disease. Am J Clin Nutr 2006;84:475–82. [DOI] [PubMed] [Google Scholar]
- 8.Phillips SM. Physiologic and molecular bases of muscle hypertrophy and atrophy: impact of resistance exercise on human skeletal muscle (protein and exercise dose effects). Appl Physiol Nutr Metab 2009;34:403–10. [DOI] [PubMed] [Google Scholar]
- 9.Soenen S, Plasqui G, Smeets AJ, Westerterp-Plantenga MS. Protein intake induced an increase in exercise stimulated fat oxidation during stable body weight. Physiol Behav 2010;101:770–4. [DOI] [PubMed] [Google Scholar]
- 10.Arciero PJ, Gentile CL, Martin-Pressman R, Ormsbee MJ, Everett M, Zwicky L, Steele CA. Increased dietary protein and combined high intensity aerobic and resistance exercise improves body fat distribution and cardiovascular risk factors. Int J Sport Nutr Exerc Metab 2006;16:373–92. [DOI] [PubMed] [Google Scholar]
- 11.Arciero PJ, Baur D, Connelly S, Ormsbee MJ. Timed-daily ingestion of whey protein and exercise training reduces visceral adipose tissue mass and improves insulin resistance: the PRISE study. J Appl Physiol (1985) 2014;117:1–10. [DOI] [PubMed] [Google Scholar]
- 12.Volek JS, Volk BM, Gomez AL, Kunces LJ, Kupchak BR, Freidenreich DJ, Aristizabal JC, Saenz C, Dunn-Lewis C, Ballard KD, et al. Whey protein supplementation during resistance training augments lean body mass. J Am Coll Nutr 2013;32:122–35. [DOI] [PubMed] [Google Scholar]
- 13.Weinheimer EM, Conley TB, Kobza VM, Sands LP, Lim E, Janle EM, Campbell WW. Whey protein supplementation does not affect exercise training-induced changes in body composition and indices of metabolic syndrome in middle-aged overweight and obese adults. J Nutr 2012;142:1532–9. [DOI] [PMC free article] [PubMed] [Google Scholar]
- 14.Weisgarber KD, Candow DG, Vogt ES. Whey protein before and during resistance exercise has no effect on muscle mass and strength in untrained young adults. Int J Sport Nutr Exerc Metab 2012;22:463–9. [DOI] [PubMed] [Google Scholar]
- 15.Antonio J, Peacock CA, Ellerbroek A, Fromhoff B, Silver T. The effects of consuming a high protein diet (4.4 g/kg/d) on body composition in resistance-trained individuals. J Int Soc Sports Nutr 2014;11:19. [DOI] [PMC free article] [PubMed] [Google Scholar]
- 16.Kim HH, Kim YJ, Lee SY, Jeong DW, Lee JG, Yi YH, Cho YH, Choi EJ, Kim HJ. Interactive effects of an isocaloric high-protein diet and resistance exercise on body composition, ghrelin, and metabolic and hormonal parameters in untrained young men: A randomized clinical trial. J Diabetes Investig 2014;5:242–7. [DOI] [PMC free article] [PubMed] [Google Scholar]
- 17.Wycherley TP, Noakes M, Clifton PM, Cleanthous X, Keogh JB, Brinkworth GD. A high-protein diet with resistance exercise training improves weight loss and body composition in overweight and obese patients with type 2 diabetes. Diabetes Care 2010;33:969–76. [DOI] [PMC free article] [PubMed] [Google Scholar]
- 18.Koopman R. Dietary protein and exercise training in ageing. Proc Nutr Soc 2011;70:104–13. [DOI] [PubMed] [Google Scholar]
- 19.Iglay HB, Apolzan JW, Gerrard DE, Eash JK, Anderson JC, Campbell WW. Moderately increased protein intake predominately from egg sources does not influence whole body, regional, or muscle composition responses to resistance training in older people. J Nutr Health Aging 2009;13:108–14. [DOI] [PubMed] [Google Scholar]
- 20.Cermak NM, Res PT, de Groot LC, Saris WH, van Loon LJ. Protein supplementation augments the adaptive response of skeletal muscle to resistance-type exercise training: a meta-analysis. Am J Clin Nutr 2012;96:1454–64. [DOI] [PubMed] [Google Scholar]
- 21.Campbell B, Kreider RB, Ziegenfuss T, La Bounty P, Roberts M, Burke D, Landis J, Lopez H, Antonio J. International Society of Sports Nutrition position stand: protein and exercise. J Int Soc Sports Nutr 2007;4:8. [DOI] [PMC free article] [PubMed] [Google Scholar]
- 22.Campbell WW, Leidy HJ. Dietary protein and resistance training effects on muscle and body composition in older persons. J Am Coll Nutr 2007;26:696S–703S. [DOI] [PubMed] [Google Scholar]
- 23.Denysschen CA, Burton HW, Horvath PJ, Leddy JJ, Browne RW. Resistance training with soy vs whey protein supplements in hyperlipidemic males. J Int Soc Sports Nutr 2009;6:8. [DOI] [PMC free article] [PubMed] [Google Scholar]
- 24.Eliot KA, Knehans AW, Bemben DA, Witten MS, Carter J, Bemben MG. The effects of creatine and whey protein supplementation on body composition in men aged 48 to 72 years during resistance training. J Nutr Health Aging 2008;12:208–12. [DOI] [PubMed] [Google Scholar]
- 25.Herda AA, Herda TJ, Costa PB, Ryan ED, Stout JR, Cramer JT. Muscle performance, size, and safety responses after eight weeks of resistance training and protein supplementation: a randomized, double-blinded, placebo-controlled clinical trial. J Strength Cond Res 2013;27:3091–100. [DOI] [PubMed] [Google Scholar]
- 26.Weinheimer EM, Conley TB, Kobza VM, Sands LP, Lim E, Janle EM, Campbell WW. Whey protein supplementation does not affect exercise training-induced changes in body composition and indices of metabolic syndrome in middle-aged overweight and obese adults. J Nutr 2012;142:1532–9. Supplemental figure 1 [cited 2015 May 14]. Available from: http://jn.nutrition.org.ezproxy.lib.purdue.edu/content/suppl/2012/08/01/jn.111.153619.DC1/nut153619-SFig1.pdf. [DOI] [PMC free article] [PubMed] [Google Scholar]
- 27.Schofield WN. Predicting basal metabolic rate, new standards and review of previous work. Hum Nutr Clin Nutr 1985;39 Suppl 1:5–41. [PubMed] [Google Scholar]
- 28.Black AE. Critical evaluation of energy intake using the Goldberg cut-off for energy intake:basal metabolic rate. A practical guide to its calculation, use and limitations. Int J Obes Relat Metab Disord 2000;24:1119–30. [DOI] [PubMed] [Google Scholar]
- 29.Apolzan JW, Leidy HJ, Mattes RD, Campbell WW. Effects of food form on food intake and postprandial appetite sensations, glucose and endocrine responses, and energy expenditure in resistance trained v. sedentary older adults. Br J Nutr 2011;106:1107–16. [DOI] [PMC free article] [PubMed] [Google Scholar]
- 30.Weinheimer EM, Sands LP, Campbell WW. A systematic review of the separate and combined effects of energy restriction and exercise on fat-free mass in middle-aged and older adults: implications for sarcopenic obesity. Nutr Rev 2010;68:375–88. [DOI] [PubMed] [Google Scholar]
- 31.ACSM’s guidelines for exercise testing and prescription. 8th ed. Baltimore: Lippincott Williams & Wilkins; 2010.
- 32.Heymsfield SB, Lohman TG, Wang Z, Going SB. Human body composition. Second edition. Champaign (IL): Human Kinetics, 2005. [Google Scholar]
- 33.Lee SY, Gallagher D. Assessment methods in human body composition. Curr Opin Clin Nutr Metab Care 2008;11:566–72. [DOI] [PMC free article] [PubMed] [Google Scholar]
- 34.Weyers AM, Mazzetti SA, Love DM, Gomez AL, Kraemer WJ, Volek JS. Comparison of methods for assessing body composition changes during weight loss. Med Sci Sports Exerc 2002;34:497–502. [DOI] [PubMed] [Google Scholar]
- 35.de Mello MT, Dâmaso AR, Antunes HKM, Siqueira KO, Castro ML, Bertolino SV, Stella SG, Tufik S. Body composition evaluation in obese adolescents: the use of two different methods (English version). Rev Bras Med Esporte 2005;11:251e–4e [cited 2015 Jan 21]. Available from: http://www.scielo.br/pdf/rbme/v11n5/en_27586.pdf. [Google Scholar]
- 36.Mahon AK, Flynn MG, Iglay HB, Stewart LK, Johnson CA, McFarlin BK, Campbell WW. Measurement of body composition changes with weight loss in postmenopausal women: comparison of methods. J Nutr Health Aging 2007;11:203–13. [PMC free article] [PubMed] [Google Scholar]
- 37.Friedewald WT, Levy RI, Fredrickson DS. Estimation of the concentration of low-density lipoprotein cholesterol in plasma, without use of the preparative ultracentrifuge. Clin Chem 1972;18:499–502. [PubMed] [Google Scholar]
- 38.Matsuda M, DeFronzo RA. Insulin sensitivity indices obtained from oral glucose tolerance testing: comparison with the euglycemic insulin clamp. Diabetes Care 1999;22:1462–70. [DOI] [PubMed] [Google Scholar]
- 39.Matthews DR, Hosker JP, Rudenski AS, Naylor BA, Treacher DF, Turner RC. Homeostasis model assessment: insulin resistance and beta-cell function from fasting plasma glucose and insulin concentrations in man. Diabetologia 1985;28:412–9. [DOI] [PubMed] [Google Scholar]
- 40.Potteiger JA, Jacobsen DJ, Donnelly JE. A comparison of methods for analyzing glucose and insulin areas under the curve following nine months of exercise in overweight adults. Int J Obes Relat Metab Disord 2002;26:87–9. [DOI] [PubMed] [Google Scholar]
- 41.DiMeglio DP, Mattes RD. Liquid versus solid carbohydrate: effects on food intake and body weight. Int J Obes Relat Metab Disord 2000;24:794–800. [DOI] [PubMed] [Google Scholar]
- 42.Soenen S, Westerterp-Plantenga MS. Changes in body fat percentage during body weight stable conditions of increased daily protein intake vs. control. Physiol Behav 2010;101:635–8. [DOI] [PubMed] [Google Scholar]
- 43.Halton TL, Hu FB. The effects of high protein diets on thermogenesis, satiety and weight loss: a critical review. J Am Coll Nutr 2004;23:373–85. [DOI] [PubMed] [Google Scholar]
- 44.Westerterp-Plantenga MS, Nieuwenhuizen A, Tome D, Soenen S, Westerterp KR. Dietary protein, weight loss, and weight maintenance. Annu Rev Nutr 2009;29:21–41. [DOI] [PubMed] [Google Scholar]
- 45.Wycherley TP, Moran LJ, Clifton PM, Noakes M, Brinkworth GD. Effects of energy-restricted high-protein, low-fat compared with standard-protein, low-fat diets: a meta-analysis of randomized controlled trials. Am J Clin Nutr 2012;96:1281–98. [DOI] [PubMed] [Google Scholar]
- 46.Luscombe ND, Clifton PM, Noakes M, Parker B, Wittert G. Effects of energy-restricted diets containing increased protein on weight loss, resting energy expenditure, and the thermic effect of feeding in type 2 diabetes. Diabetes Care 2002;25:652–7. [DOI] [PubMed] [Google Scholar]
- 47.Bendtsen LQ, Lorenzen JK, Bendsen NT, Rasmussen C, Astrup A. Effect of dairy proteins on appetite, energy expenditure, body weight, and composition: a review of the evidence from controlled clinical trials. Adv Nutr 2013;4:418–38. [DOI] [PMC free article] [PubMed] [Google Scholar]
- 48.Arciero PJ, Gentile CL, Pressman R, Everett M, Ormsbee MJ, Martin J, Santamore J, Gorman L, Fehling PC, Vukovich MD, et al. Moderate protein intake improves total and regional body composition and insulin sensitivity in overweight adults. Metabolism 2008;57:757–65. [DOI] [PubMed] [Google Scholar]
- 49.Josse AR, Atkinson SA, Tarnopolsky MA, Phillips SM. Increased consumption of dairy foods and protein during diet- and exercise-induced weight loss promotes fat mass loss and lean mass gain in overweight and obese premenopausal women. J Nutr 2011;141:1626–34. [DOI] [PMC free article] [PubMed] [Google Scholar]
- 50.Demling RH, DeSanti L. Effect of a hypocaloric diet, increased protein intake and resistance training on lean mass gains and fat mass loss in overweight police officers. Ann Nutr Metab 2000;44:21–9. [DOI] [PubMed] [Google Scholar]
- 51.Kukuljan S, Nowson CA, Sanders K, Daly RM. Effects of resistance exercise and fortified milk on skeletal muscle mass, muscle size, and functional performance in middle-aged and older men: an 18-mo randomized controlled trial. J Appl Physiol (1985) 2009;107:1864–73. [DOI] [PubMed] [Google Scholar]
- 52.Dulloo AG, Jacquet J, Solinas G, Montani JP, Schutz Y. Body composition phenotypes in pathways to obesity and the metabolic syndrome. Int J Obes (Lond) 2010;34 Suppl 2:S4–17. [DOI] [PubMed] [Google Scholar]
- 53.Peppa M, Koliaki C, Dimitriadis G. Body composition as an important determinant of metabolic syndrome in postmenopausal women. Endocrinol Metabol Syndr 2012; S1:009 [cited 2015 Feb 2]. Available from: http://www.omicsonline.org/body-composition-as-an-important-determinant-of-metabolic-syndrome-in-postmenopausal-women-2161-1017.S1-009.php?aid=20806.
- 54.Müller MJ, Lagerpusch M, Enderle J, Schautz B, Heller M, Bosy-Westphal A. Beyond the body mass index: tracking body composition in the pathogenesis of obesity and the metabolic syndrome. Obes Rev 2012;13 Suppl 2:6–13. [DOI] [PubMed] [Google Scholar]
- 55.Smith SR, Lovejoy JC, Greenway F, Ryan D, deJonge L, de la Bretonne J, Volafova J, Bray GA. Contributions of total body fat, abdominal subcutaneous adipose tissue compartments, and visceral adipose tissue to the metabolic complications of obesity. Metabolism 2001;50:425–35. [DOI] [PubMed] [Google Scholar]
- 56.Campbell DD, Meckling KA. Effect of the protein:carbohydrate ratio in hypoenergetic diets on metabolic syndrome risk factors in exercising overweight and obese women. Br J Nutr 2012;108:1658–71. [DOI] [PubMed] [Google Scholar]
- 57.Meckling KA, Sherfey R. A randomized trial of a hypocaloric high-protein diet, with and without exercise, on weight loss, fitness, and markers of the Metabolic Syndrome in overweight and obese women. Appl Physiol Nutr Metab 2007;32:743–52. [DOI] [PubMed] [Google Scholar]
- 58.Lofgren IE, Herron KL, West KL, Zern TL, Brownbill RA, Ilich JZ, Koo SI, Fernandez ML. Weight loss favorably modifies anthropometrics and reverses the metabolic syndrome in premenopausal women. J Am Coll Nutr 2005;24:486–93. [DOI] [PubMed] [Google Scholar]
- 59.Campbell WW, Tang M. Protein intake, weight loss, and bone mineral density in postmenopausal women. J Gerontol A Biol Sci Med Sci 2010;65:1115–22. [DOI] [PMC free article] [PubMed] [Google Scholar]
- 60.Bosse JD, Dixon BM. Dietary protein to maximize resistance training: a review and examination of protein spread and change theories. J Int Soc Sports Nutr 2012;9:42. [DOI] [PMC free article] [PubMed] [Google Scholar]