Abstract
We report the photophysical properties, binding-induced turn-on emission, and fluorescence imaging of the cellular uptake and distribution of lapatinib, an EGFR/ERBB inhibitor. Lapatinib, a type II, i.e. inactive state, inhibitor that targets the ATP binding pocket of the EGFR family of receptor tyrosine kinases. DFT calculations predict that the 6-furanylquinazoline core of lapatinib should exhibit an excited state with charge transfer character and an S0 to S1 transition energy of 3.4 eV. Absorption confirms an optical transition in the near UV to violet, while fluorescence spectroscopy shows that photoemission is highly sensitive to solvent polarity. The hydrophobicity of lapatinib leads to fluorescent aggregates in solution, however, binding to the lipid-carrier protein, BSA or to the kinase domain of ERBB2, produces spectroscopically distinct photoemission. Confocal fluorescence microscopy imaging of lapatinib uptake in ERBB2-overexpressing MCF7 and BT474 cells reveals pools of intracellular inhibitor with emission profiles consistent with aggregated lapatinib.
Introduction
Fluorescent analogues of biomolecules have attracted considerable attention over the past few decades.1–3 While many biomolecules, such as nucleobases, aromatic amino acids and their metabolites are inherently fluorescent, they require high energy excitation between 250 and 300 nm and emit in the UV or blue edge of the visible spectrum. Fluorescent analogues of many biomolecules, especially nucleobases, have been successfully generated by expanding the existing aromatic framework of the parent molecule thereby lowering the HOMO–LUMO gap and pushing excitation and/or emission to longer wavelengths.
The presence of aromatic cores in many non-natural ligands, such as pharmaceuticals or drug-like compounds, suggests that these molecules should also behave as fluorescent probes, or can readily be modified to generate fluorescent analogues. We recently reported a family of fluorescent quinazolines (general structure A) designed as mimics of EGFR/ERBB-targeted chemotherapies gefitinib, erlotinib and lapatinib (Fig. 1).4 These kinase inhibitors are employed to treat cancers with deregulated ERBB receptors and represent paradigms for alternative modes of kinase inhibition, i.e. type I, active state, and type II, inactive state, inhibitors. They inhibit, to varying degrees, all three ERBB receptors with robust kinase activity, i.e. EGFR, ERBB2 and ERBB4. This makes them especially useful in conjunction with specific receptor directed antibody regiments, such as Trastuzumab for ERBB2, or following the emergence of resistance against the first line of treatment. By extending the quinazoline core common to gefitinib or erlotinib (Fig. 1), we were able to generate fluorescent mimics with excitation and emission wavelengths in the visible region of the spectrum.4a These probes also exhibited ‘turn-on’ fluorescence induced by binding to the ERBB2 kinase domain. This ON/OFF emission switching is a direct result of their intramolecular charge transfer (ICT) excited states which leads to quenching in polar environments such as water. When bound in the solvent-excluding and relatively apolar ATP-binding pocket of ERBB2, emission is enhanced.
Fig. 1.
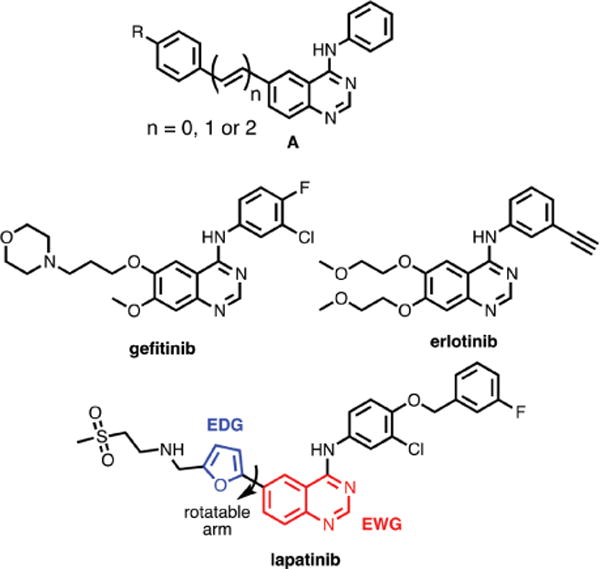
Chemical structures of EGFR/ERBB-targeted small molecule inhibitors. While gefitinib and erlotinb target active state kinases and compete directly with ATP, lapatinib is a so-called type 2 inhibitor that targets the inactive state. The pendant furan ring of lapatinib can rotate modulating the electronic interaction with the quinazoline core.
The structure of lapatinib is somewhat unique amongst the EGFR/ERBB inhibitors in that it possesses a pendant furan ring at the 6-position of the quinazoline core, required for the stabilizing insertion into a hydrophobic pocket that is specific to the inactive state. This structure suggests that lapatinib should have somewhat longer wavelength excitation energies than other members of the quinazoline class of inhibitors, such as gefitinib and erlotinib; these ligands have only solubilizing ether substituents at the 6-position. Solutions of lapatinib appear yellow, indicative of optical transitions in the violet to blue region of the visible spectrum and, under illumination of a UV-lamp, solutions of lapatinib in organic solvents exhibit blue to green fluorescence. As part of our on-going investigations into fluorescent ligands, we decided to study the basic photophysical properties (e.g. λmax, abs, ɛ, λmax, em, ϕem) of lapatinib to determine if it could function as a competent fluorescent reporter. Our results show that lapatinib possesses an S0–S1 transition in the UV to violet region of the spectrum and exhibits environmentally-sensitive fluorescence in the blue to green portion of the spectrum. Most importantly, emission is dramatically enhanced upon exposure to the lipophilic drug-carrying protein, albumin, as well as the ERBB2 kinase domain, but with distinct spectra for the bound species. We were able to image the uptake and distribution of lapatinib in MCF7 cells; we observed, surprisingly, that lapatinib forms fluorescent aggregates in the cytoplasm, but does not show signs of binding-induced emission in ERBB2, even in the presence of highly overexpressed ERBB2.
Results and discussion
Electronic structure of lapatinib
We first investigated the electronic structure of lapatinib through TD-DFT calculations at the 6-31G* level using the Coulomb-attenuating method, CAM-B3LYP.5 The geometry of EGFR-bound lapatinib (PDB ID: 1XKK)6 was utilized for the TD-DFT calculations, with the non-conjugated atoms, i.e. the amino-sulfone and benzylic fragments, removed (see ESI† for atomic coordinates). Inspection of the frontier molecular orbitals (FMOs) reveals that the HOMO is distributed over both the furan and quinazoline ring systems while the LUMO is largely concentrated on the quinazoline core (Fig. 2). The FMO distribution suggests that there should be a moderate degree of charge redistribution following the one electron excitation to the S1 state. In the gas phase, two closely spaced transitions are predicted at 330 nm and 300 nm. While these values suggest that excitation would be optimal in the UV, a prominent shoulder extends to longer wavelengths (Fig. 3). The moderately polar environment of the ATP binding pocket may also influence the optical properties of lapatinib, shifting the optical transitions to slightly longer wavelengths. Our previous investigations of solvent-excluding binding sites revealed a polarity close to that of THF7 and when this solvent dielectric is employed in the TD-DFT calculations, the S0–S1 transition is predicted to occur at slightly longer wavelengths (λmax, abs of 347 nm) making excitation with a DAPI filter set or 405 nm diode laser feasible.
Fig. 2.
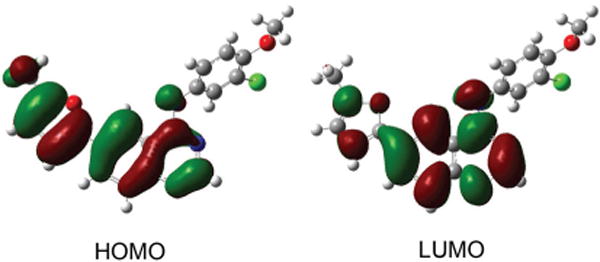
Frontier molecular orbitals of lapatinib calculated at the 6-31G* level.
Fig. 3.
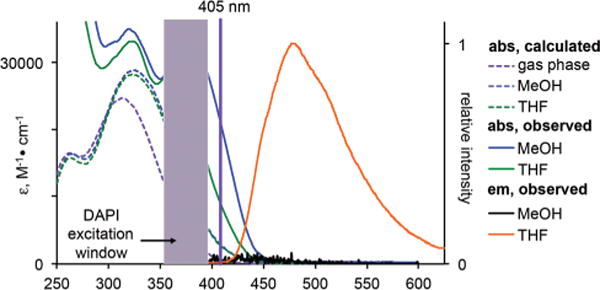
Calculated (dashed lines) versus experimentally measured solution (solid lines) spectra of lapatinib. The solution spectra are slightly red-shifted when compared to the TD-DFT predicted spectra and extend into the visible spectrum enabling excitation with near-UV or violet sources; the typical window for a DAPI filter set and the 405 nm laser line are show. While lapatinib is emissive in a relatively non-polar solvent like THF (orange line), fluorescence is quenched in methanol (black line at bottom). 10 μM and 1 μM solutions were used for absorption and emission spectroscopy, respectively.
Optical spectroscopy
In the solution UV-vis spectra of lapatinib (Fig. 3) the longest wavelength absorption appears at 367 nm in methanol and 380 nm in THF, in good agreement with the calculated values. The molar absorptivity in both solvents is moderately high with a value near 30000 M−1 cm−1. The closely spaced transitions predicted by TD-DFT appear to be more clearly separated in the actual spectra, with the second prominent transition at approximately 325 nm for both solvents. Broad shoulders extend from the longer wavelength peaks into the violet portion of the visible spectrum. The molar absorptivity at 405 nm is between 10000 in MeOH and 20000 in THF, suggesting that confocal microscopy using this excitation source is feasible.
In methanol, the emission of lapatinib is largely quenched, with ϕem of only 2.8 × 10⁻³. As the excited state is expected to exhibit some charge transfer character based on the quantum chemical calculations, this is not unexpected since methanol is a quite polar solvent with a value of 55.5 kcal mol−1 on Reichart’s ET(30) scale.8 In a less polar solvent, such as THF, ET(30) = 37.4 kcal mol−1, the quantum yield is 0.14, an increase of 40-fold compared to methanol.
Binding and aggregation induced emission
Solution spectroscopy suggests that lapatinib may exhibit binding-induced emission enhancements. In water (ET(30) = 63.1 kcal mol−1)8 as in MeOH, fluorescence should be quenched, while in the less polar and geometrically defined environment of a binding pocket, emission should be enhanced. We attempted to obtain the quantum yield of lapatinib in both water and phosphate buffered saline (PBS), however, the hydrophobic nature of lapatinib led to substantial aggregation, as previously reported by Owen et al.9 In their studies, use of a surfactant (Tween-80) reduced aggregation and restored the antiproliferative activity of lapatinib and other drugs. In the body, carrier proteins such as albumin or α1-acid glycoprotein bind hydrophobic molecules, helping to eliminate aggregation and distribute lapatinib.10 Therefore, in addition to investigating the optical response of lapatinib upon binding to ERBB2, we also explored the optical properties albumin-bound lapatinib, as well as aggregates formed in aqueous solutions.
Addition of DMSO-solubilized lapatinib to PBS to produce a clinically-relevant concentration of 3 μM,11 results in the formation of aggregates with a hydrodynamic radius of approximately 150 nm (Fig. 4) as determined by dynamic light scattering (DLS). The aggregates increase in size over a 60 min period until a visible precipitate can be observed. The lapatinib aggregates were found to be emissive, with an emission maximum of 464 nm, but a relatively low quantum yield (Table 1). This behaviour is similar to many other dyes that exhibit aggregation induced emission (AIE) and may be the result of limited rotation between the furan and quinazoline systems. Alternately, molecules present inside the aggregates should experience a less polar environment, which could lessen non-radiative decay pathways of charge transfer excited states. In either case, the presence of fluorescent aggregates could significantly impact solution spectroscopy and fluorescence microscopy, however, the use of Tween-80, as reported by Owen et al.,9 or the presence of a lipid-carrier protein should eliminate this issue.
Fig. 4.
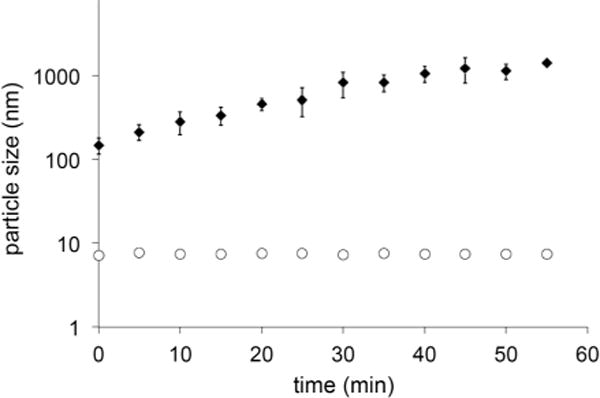
Lapatinib (3 μM) forms aggregates immediately upon introduction of stock DMSO solutions into PBS; between t = 0 to t = 60 min the aggregates increase in size from 150 nm to approximately 1500 nm. In the presence of BSA, aggregation is eliminated (open circles). Data points are the average of three independent measurements; error bars show S.D. (too small to be seen for lapatinib in the presence of BSA).
Table 1.
Photophysical parameters of protein-bound and aggregated lapatinib
| λmax, ex (nm) | λmax, em (nm) | τem (ns) | ϕema | |
|---|---|---|---|---|
| Aggregates | 371 | 464 | 0.48 ± 0.02 | 0.04 |
| BSA | 361 | 423 | 0.06 ± 0.4 (18%) | 0.07 |
| 1.13 ± 0.08 (82%) | ||||
| ERBB2 | 368 | 445 | 0.48 ± 0.2 (21%) | 0.30 |
| 2.7 ± 0.4 (79%) |
±10%.
Aggregation is indeed eliminated in the presence of 100 μM (6.6 mg ml−1) bovine serum albumin (BSA); DLS reveals a mean particle size of 7 nm that is indistinguishable from BSA alone and the particle size remains unchanged; these solutions are stable with no precipitate observed for at least 48 hours. From this result, we conclude that lapatinib must be bound to BSA and likely resides in one of the hydrophobic pockets of the protein. This notion is supported by fluorescence spectroscopy (10 μM BSA, 1 μM lapatinib) as the emission wavelengths and lifetimes differ significantly from those observed for lapatinib aggregates (Table 1). The emission is blue shifted by 41 nm while the lifetime exhibits a biexponential decay with a very short component of 0.06 ns and a longer component of 1.1 ns.
We next examined the optical response of lapatinib (200 nM) in solutions of the soluble ERBB2 kinase domain fragment, amino acids Q679-V1255, (500 nM). The emission maximum of lapatinib appears at 445 nm, in between that observed for the aggregates and BSA-bound forms. The emission lifetime measurements reveal two components: the longer component of 2.7 ns (79%) is readily assigned to ERBB2-bound lapatinib, while the shorter and less abundant component (21%) of 0.48 ns can be traced to aggregates of unbound lapatinib.
Taken together these results demonstrate that lapatinib exhibits a turn-on emission response that can be induced either by binding to a hydrophobic pocket, or through aggregation. The emission maxima progress in approximately 20 nm increments from BSA-bound, to ERBB2-bound to the aggregates. While the emission peaks overlap, the emission lifetimes are distinct and allow for resolution of the bound and unbound populations.
Confocal microscopy
The ERBB2 gene is amplified in approximately 30% of breast cancer patients, leading to a substantial overproduction of the receptor. This results frequently in more than 1 million receptors per cell as opposed to 1000 or less in non-transformed cells. However, protein levels often do not correlate well with gene amplification levels, and the responsiveness to ERBB2 targeted antibodies shows often a poor correlation with detected ERBB2 levels. The gold standard for the determination of ERBB2 status of a cancer remains therefore the very labour-intensive analysis by fluorescence in situ hybridization (FISH).12,13 The rationale for this discrepancy is poorly understood, but one limitation is the presence of ERBB2 species with altered antibody epitopes or truncated species that lack the segments being detected altogether. These truncated species have been shown to be even more tumorgenic than the full-length receptor.14–16 The binding-induced emission of lapatinib might serve as an alternative test that uses a simple and stable fluorescent “stain” to detect the presence of ERBB2 kinase domains, regardless of modifications in the remainder of the protein. We therefore decided to examine the optical response of lapatinib when exposed to ERBB2-overexpressing MCF7 and BT474 cells. As previously reported, aggregation of lapatinib will lower the efficacy in cell culture.9 While their study restored drug efficacy through the use of a surfactant, our optical spectroscopy and DLS studies revealed that serum albumin can also inhibit aggregation of lapatinib, and is arguably more representative of the carrier and exchange behaviour in vivo. MCF7 and BT474 cells used for imaging studies, were cultured in media containing 10% fetal bovine serum, which we found to be sufficient to inhibit aggregate formation. To ensure the absence of aggregates, cell culture media containing lapatinib (3 μM) was allowed to stand for 2 hours before being passed through a 0.200 μm filter. These solutions were added to the cells, which were then imaged either immediately or at 24 and 48 hours, using a 405 nm excitation source.
15 minutes after addition, lapatinib was clearly visible inside the cells and was widely distributed throughout the cytosol (Fig. 6A). With prolonged exposure (Fig. 6B) very bright punctate structures were also observed within the cytosol. The emission spectrum of lapatinib at early time points was red-shifted relative to the emission observed when bound to ERBB2 or BSA and very closely matches the emission spectrum of aggregates obtained in PBS solutions (Fig. 6C). This suggests that the lapatinib is aggregating rapidly upon entering the cell and the vast majority of the observable lapatinib is not bound in a hydrophobic pocket, which should be distinguishable by bluer emission maxima. The emission spectrum of the larger aggregates observed after 24 h is red-shifted further by approximately 60 nm. This may be the result of electronic coupling between lapatinib molecules, leading to delocalized excited states with lower energy emission.
Fig. 6.
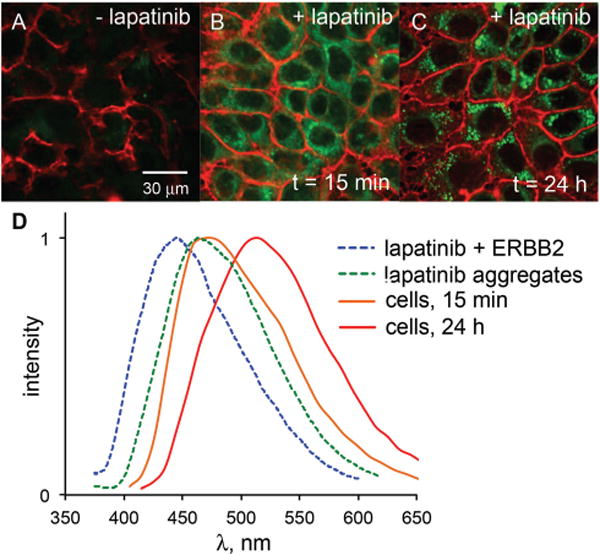
A comparison of ERBB2-overexpressing MCF7 cells without lapatinib (A), after 15 min of 3 μM lapatinib treatment (B) and 24 h of lapatinib treatment (C) reveals the turn-on fluorescence of intracellular lapatinib. All images were captured under identical conditions (e.g. laser intensity, detector gain, exposure time). The emission spectrum (D) of lapatinib at 15 min (orange line) closely matches that of lapatinib aggregates in PBS solutions (green dashed line). At longer time points, the emission is red-shifted (red line); emission of ERBB2-bound lapatinib (blue dashed line) is not observed either at the cell membrane or intracellularly.
Interestingly, no emission was observed at the cell membrane, where ERBB2 is localized. The presence of ERBB2 was confirmed through immunofluorescence (see ESI†), but no lapatinib emission was found to colocalize with the labelled antibodies. Previous studies17,18 have demonstrated the ability to image ON/OFF dynamics of fluorescent probes binding to approximately 50000 membrane proteins. One possible explanation is that the ERBB-bound pool of lapatinib is not adequately excited at 405 nm compared with the intracellular aggregates. We recently investigated18c such a case in which a protein bound form of a dye could be selectively imaged by shifting the excitation source from 458 nm to 405 nm. Based on the excitation spectra (Fig. 5), lapatinib is optimally excited near 370 nm. Therefore, we attempted to image ERBB2-bound lapatinib using an epifluorescent microscope equipped with a UV bandpass filter set, then via a two photon confocal microscope with excitation at 765 nm. In neither case were we able to detect lapatinib emission at the membrane.
Fig. 5.
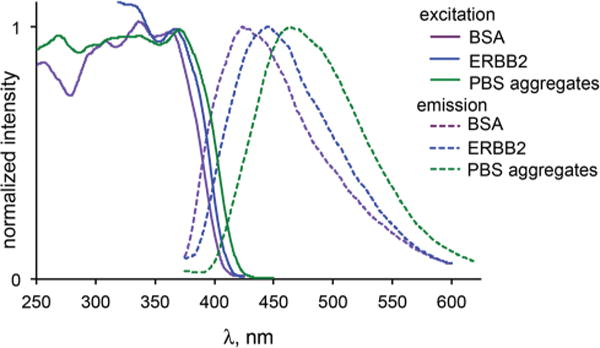
Excitation (solid lines) and emission spectra (dashed lines) of lapatinib bound to BSA (violet), ERBB2 (blue) and as aggregates in PBS (green). Solution concentrations are noted in the text.
Several factors may contribute to the apparent absence of lapatinib fluorescence despite the abundance of binding sites in these ERBB2-overexpressing cells. First, the presence of chaperone proteins may preclude access to the ATP-binding fold. Specifically the abundant chaperon HSP90 is known to associate constitutively with the ERBB2 kinase domain.19 However, given the high affinity of lapatinib to the intracellular segment of ERBB2, estimated from its Ki of 13 nM,20 any interfering protein complex would have to be of significantly higher effective affinity to cause more than just a time delay in saturation.
The expectation that cellular ERBB2 should be fully saturated by lapatinib is derived from inhibition data. Inhibition data only state that 100% of the signalling competent receptors can be saturated and blocked with inhibitor, however, this inhibited population may represent only a portion of the total receptor pool. Studies on the state of clustered ERBB2 receptors in overexpressing cancer cells, using gold particle-modified antibodies and electron microscopy,21 found that clusters of ERBB2 only contain a small portion of phosphorylated receptors, suggesting a small pool of catalytically active species. Even under conditions of ligand-induced hetro-dimerization and activation at low receptor levels, only a very small population of receptors takes part in dimerization.22 Thus, one possible explanation for the lack of observable lapatinib fluorescence is that only a small pool of autoactivated receptors may be the target for inhibition and saturation by lapatinib. Alternatively, lapatinib may stabilize an inactive state that is subsequently handed over to other inactive state stabilizing complexes that replaces lapatinib. Many of the factors involved are multimeric or clustered and their true affinities may involve large avidity components and are difficult to evaluate.
Conclusions
We have investigated the photophysical properties of the EGFR/ERBB-targeting kinase inhibitor, lapatinib. Optical spectroscopy and DFT calculations demonstrated that lapatinib functions as an environmentally responsive ‘turn-on’ fluorophore. This allows the detection of aggregates and protein-bound drug through spectroscopically distinct emission. One possible application of this information is the monitoring of dose and time dependent blood concentrations. The lack of an ERBB2-specific signal precludes the use of lapatinib fluorescence to differentiate HER2-positive tumors from other cancer types, however, using the inherent fluorescence of lapatinib, we were able to image the accumulation, distribution and aggregation of the drug within cells. It is not clear if aggregates are present in vivo and if they may possibly serve as a reservoir of drug that may act over longer time periods.
Experimental section
Computational methods
The transition energies and frontier molecular orbitals of the aromatic core of lapatinib (see ESI† for atoms and coordinates) were calculated by TD-DFT using the CAM-B3LYP functional at the 6-31G(d) level using Gaussian’09.23 The geometries utilized in the TD-DFT calculations were either calculated for the ground state in the gas phase or obtained from the crystal structure of ERBB2-bound lapatinib (PDB ID: 1XKK).6
Materials
Inhibitors and bioreagents were obtained from commercial suppliers: lapatinib ditosylate (Selleck Chemicals); canertinib and adenosine 5′-(β, γ-imido) triphosphate (Sigma-Aldrich); ERBB2 kinase domain fragment Q679-V1255 (Biaffin); BSA and mouse anti-ERBB2 (Calbiochem); Alexa Fluor546 goat antimouse (Life Technologies).
Optical spectroscopy
UV-vis absorption spectra were obtained on a Lambda 35 UV-vis (Perkin-Elmer) spectrometer with a path length of 1 cm. Fluorescence studies were performed on a LS55 Fluorometer (Perkin-Elmer) with a path length of either 1 cm or 3 mm. For determination of Φem, solutions were prepared to an optical density of less than 0.05 in order to minimize inner filter effects. Perylene in cyclohexane was used as a reference for quantum yields.24 Emission lifetime measurements were performed on an EasyLife II (Photon Technology International) using a 340 nm pulsed LED.
Cell culture and confocal microscopy
MCF7 and BT474 cells were cultured as previously described in sterile T-75 flasks.22 Cells were maintained in RPMI (Cellgro) containing 10% dialyzed FBS (Atlanta Biologicals), penicillin (100 units mL−1) and streptomycin (0.01%) solution (Cellgro) under a humidified 5% CO2 atmosphere. For imaging, cells were seeded at a density of 105 cell cm−2 in 96 microwell plates or on glass coverslips. Cells maintained a normal morphology during the course of the experiments (maximum of 1.5 h) and remained adhered to the imaging plate or coverslip.
Single photon imaging was performed on a Leica SP5 confocal microscope housed within the UM Biology Imaging Core Facility using 405 nm excitation. Two-photon imaging was performed on a Leica MP/SP5 confocal microscope using a Sapphire multiphoton laser tuned to 765 nm.
Supplementary Material
Acknowledgments
This work was supported by the National Cancer Institute Innovative Molecular Analysis Technologies Program, CA182341-01 (J. N. W. and R. L.). J. N. W. also acknowledges the support of the Bankhead-Coley New Investigator Research Program, 3BN08. R.L. also acknowledges the support of National Cancer Institute, CA98881-05 and the Braman Family Breast Cancer Institute.
Footnotes
Electronic supplementary information (ESI) available: Atomic coordinates of lapatinib fragment, additional confocal images.
Notes and references
- 1.Krueger AT, Lu H, Lee AHF, Kool ET. Acc Chem Res. 2007;40:141. doi: 10.1021/ar068200o. [DOI] [PMC free article] [PubMed] [Google Scholar]
- 2.Sinkeldam RW, Greco NJ, Tor Y. Chem Rev. 2010;110:2579. doi: 10.1021/cr900301e. [DOI] [PMC free article] [PubMed] [Google Scholar]
- 3.Wilhelmson ML. Q Rev Biophys. 2010;43:159. doi: 10.1017/S0033583510000090. [DOI] [PubMed] [Google Scholar]
- 4.(a) Dhuguru J, Liu W, Gonalez WG, Babinchak WM, Miksovska J, Landgraf R, Wilson JN. J Org Chem. 2014;79:4940. doi: 10.1021/jo500520x. [DOI] [PMC free article] [PubMed] [Google Scholar]; (b) Sicard R, Dhuguru J, Liu W, Patel N, Landgraf R, Wilson JN. Bioorg Med Chem Lett. 2012;22:5532. doi: 10.1016/j.bmcl.2012.07.034. [DOI] [PMC free article] [PubMed] [Google Scholar]
- 5.Yanai T, Tew DP, Handy NC. Chem Phys Lett. 2004;393:51. [Google Scholar]
- 6.Wood ER, Truesdale AT, McDonald OB, Yuan D, Hassell A, Dickerson SH, Ellis B, Pennisi C, Horne E, Lackey K, Alligood KJ, Rusnak DW, Gilmer TM, Shewchuk LA. Cancer Res. 2004;64:6652. doi: 10.1158/0008-5472.CAN-04-1168. [DOI] [PubMed] [Google Scholar]
- 7.Wilson JN, Brown AS, Babinchak WM, Ridge CD, Walls JD. Org Biomol Chem. 2012;10:8710. doi: 10.1039/c2ob26633d. [DOI] [PubMed] [Google Scholar]
- 8.Reichardt C. Angew Chem Int Ed Engl. 1979;18:98. [Google Scholar]
- 9.Owen SC, Doak AK, Wassam P, Shoichet MS, Soichet BK. ACS Chem Biol. 2012;7:1429. doi: 10.1021/cb300189b. [DOI] [PMC free article] [PubMed] [Google Scholar]
- 10.Zsila F, Fitos I, Bencze G, Kéri G, Örfi L. Curr Med Chem. 2009;16:1964. doi: 10.2174/092986709788682191. [DOI] [PubMed] [Google Scholar]
- 11.LoRusso PM, Jones SF, Koch KM, Arya N, Fleming RA, Loftiss J, Pandite L, Gadgeel S, Weber BL, Burris HA., III J Clin Oncol. 2008;26:3051. doi: 10.1200/JCO.2007.14.9633. [DOI] [PubMed] [Google Scholar]
- 12.Lassus H, Leminen A, Vayrynen A, Cheng G, Gustafsson JA, Isola J, Butzow R. Gynecol Oncol. 2004;92:31. doi: 10.1016/j.ygyno.2003.10.010. [DOI] [PubMed] [Google Scholar]
- 13.Neve RM, Lane HA, Hynes NE. Annu Oncol. 2001;12:S9. doi: 10.1093/annonc/12.suppl_1.s9. [DOI] [PubMed] [Google Scholar]
- 14.Ward TM, Iorns E, Liu X, Hoe N, Kim P, Singh S, Dean S, Jegg AM, Gallas M, Rodriguez C, Lippman M, Landgraf R, Pegram MD. Oncogene. 2013;32:2463. doi: 10.1038/onc.2012.256. [DOI] [PMC free article] [PubMed] [Google Scholar]
- 15.Molina MA, Saez R, Ramsey EE, Garcia-Barchino MJ, Rojo F, Evans AJ, Albanell J, Keenan EJ, Lluch A, Garcia-Conde J, Baselga J, Clinton GM. Clin Cancer Res. 2002;8:374. [PubMed] [Google Scholar]
- 16.Saez R, Molina MA, Ramsey EE, Rojo F, Keenan EJ, Albanell J, Lluch A, Garcia-Conde J, Baselga J, Clinton GM. Clin Cancer Res. 2006;12:424. doi: 10.1158/1078-0432.CCR-05-1807. [DOI] [PubMed] [Google Scholar]
- 17.(a) Schwartz JW, Blakely RD, DeFelice LJ. J Biol Chem. 2003;278:9768. doi: 10.1074/jbc.M209824200. [DOI] [PubMed] [Google Scholar]; (b) Schwartz JW, Novarino G, Piston DW, DeFelice LJ. J Biol Chem. 2005;280:19177. doi: 10.1074/jbc.M412923200. [DOI] [PubMed] [Google Scholar]
- 18.(a) Brown AS, Bernal LM, Micotto TL, Smith EL, Wilson JN. Org Biomol Chem. 2011;9:2142. doi: 10.1039/c0ob00849d. [DOI] [PubMed] [Google Scholar]; (b) Smith EL, Brown AS, Adjaye-Mensah E, Wilson JN. Org Biomol Chem. 2012;10:1493. doi: 10.1039/c2ob06796j. [DOI] [PubMed] [Google Scholar]; (c) Wilson JN, Ladefoged LK, Babinchak WM, Schiøtt B. ACS Chem Neurosci. 2014;5:296. doi: 10.1021/cn400230x. [DOI] [PMC free article] [PubMed] [Google Scholar]
- 19.Xu W, Yuan X, Beebe K, Xiang Z, Neckers L. Mol Cell Biol. 2007;27:220. doi: 10.1128/MCB.00899-06. [DOI] [PMC free article] [PubMed] [Google Scholar]
- 20.Brignola PS, Lackey K, Kadwell SH, Hoffman C, Horne E, Carter HL, Stuart JD, Blackburn K, Moyer MB, Alligood KJ, Knight WB, Wood ER. J Biol Chem. 2002;277:1576. doi: 10.1074/jbc.M105907200. [DOI] [PubMed] [Google Scholar]
- 21.Yang S, Raymond-Stintz MA, Ying W, Zhang J, Lidke DS, Steinberg SL, Williams L, Oliver JM, Wilson BS. J Cell Sci. 2007;120:2763. doi: 10.1242/jcs.007658. [DOI] [PubMed] [Google Scholar]
- 22.Park E, Baron R, Landgraf R. Biochemistry. 2008;47:11992. doi: 10.1021/bi8004208. [DOI] [PMC free article] [PubMed] [Google Scholar]
- 23.Frisch MJ, Trucks GW, Schlegel HB, Scuseria GE, Robb MA, Cheeseman JR, Scalmani G, Barone V, Mennucci B, Petersson GA, Nakatsuji H, Caricato M, Li X, Hratchian HP, Izmaylov AF, Bloino J, Zheng G, Sonnenberg JL, Hada M, Ehara M, Toyota K, Fukuda R, Hasegawa J, Ishida M, Nakajima T, Honda Y, Kitao O, Nakai H, Vreven T, Montgomery JA, Jr, Peralta JE, Ogliaro F, Bearpark M, Heyd JJ, Brothers E, Kudin KN, Staroverov VN, Kobayashi R, Normand J, Raghavachari K, Rendell A, Burant JC, Iyengar SS, Tomasi J, Cossi M, Rega N, Millam JM, Klene M, Knox JE, Cross JB, Bakken V, Adamo C, Jaramillo J, Gomperts R, Stratmann RE, Yazyev O, Austin AJ, Cammi R, Pomelli C, Ochterski JW, Martin RL, Morokuma K, Zakrzewski VG, Voth GA, Salvador P, Dannenberg JJ, Dapprich S, Daniels AD, Farkas Ö, Foresman JB, Ortiz JV, Cioslowski J, Fox DJ. Gaussian 09, Revision A.1. Gaussian, Inc; Wallingford, CT: 2009. [Google Scholar]
- 24.Berlman I. Handbook of Fluorescence Spectra of Aromatic Molecules. 2nd. Academic Press; New York: 1971. [Google Scholar]
Associated Data
This section collects any data citations, data availability statements, or supplementary materials included in this article.


