Abstract
S-adenosylhomocysteine hydrolase (AHCY) hydrolyzes S-adenosylhomocysteine to adenosine and l-homocysteine, and it is already known that inhibition of AHCY decreased cell proliferation by G2/M arrest in MCF7 cells. However, the previous study has not indicated what mechanism the cell cycle arrest is induced by. In this study, we aimed to investigate the different cell cycle mechanisms in both p53 wild-typed MCF7 and p53 mutant-typed MCF7-ADR by suppressing AHCY. We extensively proved that AHCY knockdown has an anti-proliferative effect by using the WST-1 assay, BrdU assay, and cell cytometry analysis and an anti-invasive, migration effect by wound-healing assay and trans-well analysis. Our study showed that down-regulation of AHCY effectively suppressed cell proliferation by regulating the MEK/ERK signaling pathway and through cell cycle arrests. The cell cycle arrest occurred at the G2/M checkpoint by inhibiting degradation of cyclinB1 and phosphorylation of CDC2 in MCF7 cells and at the G1 phase by inhibiting cyclinD1 and CDK6 in MCF7-ADR cells. Finally, we determined that AHCY regulates the expression of ATM kinase that phosphorylates p53 and affects to arrest of G2/M phase in MCF7 cells. The findings of this study significantly suggest that AHCY is an important regulator of cell proliferation through different mechanism in between MCF7 and MCF7-ADR cells as p53 status.
Keywords: S-adenosylhomocysteine, breast cancer, cell proliferation, cell cycle, p53, ataxia telangiectasia mutated kinase
Introduction
Breast cancer is one of the most frequently diagnosed cancers and a heterogeneous disease that is the second most lethal cancer in women worldwide [1]. It is also the most characterized human cancer using genome-wide technologies [2]. Various human breast cancer cell lines divided four subtypes such as luminal A, luminal B (MCF7 and T47D), HER2+ (MCF7-ADR and SK-BR-3) and Triple negative breast cancer (MDA-MB-231 and MDA-MB-435S) [3]. The adriamycin-resistant cell line, MCF7-ADR, was prepared in 1986 by incubating the MCF7 cells with high concentrations of the anthracycline antibiotic ADR [4-6]. This cell line is widely known as a stable multidrug-resistant (MDR) model because the cells have a high expression of P-glycoprotein and it is reported that the cells have a considerable hormone-independent metastatic potential [7,8].
S-adenosylhomocysteine hydrolase (AHCY) is a critical enzyme in the S-adenosyl methionine (SAM) cycle that plays a role in making, expending, and regenerating SAM [9]. AHCY strongly inhibits trans-methylation because it converts S-adenosylhomocysteine (SAH)- created from transferring a methyl group from SAM-into adenosine and homocysteine that are required for generating SAM [10,11]. AHCY knockdown has biochemical effects on trans-methylation reactions that affect alcohol-induced liver disease and exerts an anti-cancer effect in breast cancer cell lines [12-14], AHCY has an important role as it regulates DNA methylation in many physiological states and thus mediates gene expression [15,16]. AHCY is up-regulated by c-MYC for removing inhibitory product, RNA guanine-7 methyltransferase (RNMT), of cap methylation [17]. We hypothesize that AHCY knockdown inhibits the uncontrolled cell cycle progression of breast cancer cells and finally decreases cell proliferation in breast cancer.
Almost all breast tumors have some defect in cell cycle regulatory molecules, including cyclins, cyclin-dependent kinases (CDKs), and CDK inhibitors (CDKIs) that regulate each phase of the cell cycle progression [18,19]. In cancer cells, many CDKs have alternative substrates and functions and causes un-regulated cell proliferation [20,21]. CDK4 and CDK6 are particularly early G1 phase kinases and they strongly regulate homologous interactions with the D-type cyclins and CDKIs [22]. Once CDK4, CDK6, or their regulatory D-type cyclins are over-expressed in cultured cells, they lead to excessive cell growth and confer cancer characteristics on the cells [23]. On the other hand, CDC2 is phosphorylated on threonine-14 and tyrosine-15, which detaches it from cyclin B1 during G2 phase. The phosphorylation of CDC2 inhibits the activity of the CDC2/cyclin B1 kinase complex restricting entry into mitosis. CDC2 is suppressed by the transcriptional targets of p53, Gadd45, p21, and 14-3-3δ. The p53 is phosphorylated by ATM kinase upon DNA damage [24].
This study substantiates that knockdown of AHCY decreases cell proliferation through both MEK/ERK pathway down-regulation and p53-induced cell cycle arrest by activated-ATM kinase. These data propose that AHCY has the potential to be a regulator related to cell proliferation in breast cancer.
Materials and methods
Cell culture and transfection
MCF7, MCF7-ADR, MDA-MB-231, MDA-MB-435s and SK-BR-3 cells were cultured in high glucose Dulbecco’s modified eagle’s medium (DMEM) (Welgene, Republic of Korea) supplemented with 10% FBS (Fetal bovine serum, qualified, Canada origin, Gibco); MCF10A cells were cultured in DMEM/F12 medium added with 5% horse serum, 20 ng/ml EGF, 0.5 mg/ml hydrocortisone, 100 ng/ml cholera toxin and 10 μg/ml insulin; T47D cells were cultured in RPMI-1640 medium including 10% FBS and 10 μg/ml bovine insulin in a humidified chamber with 5% CO2 at 37°C. Approximately 2 × 10⁵ MCF7-ADR cells were seeded per well in 6-well culture plates with 10% FBS-DMEM for 1 day. When the cells were approximately 50% confluent, control [multiplicity of infection (MOI) 1:5, Santa Cruz, sc-108080] and AHCY shRNA lentiviral particles (MOI 1:5, Santa Cruz, sc-62972-V) were transduced into the cells with 10% FBS-DMEM containing 10 µg/ml polybrene (Santa Cruz, sc-134220). After 12 h, the cells were incubated with medium without polybrene for 24 h and then the clones stably expressing the shRNA were selected using 10 µg/ml puromycin (Santa Cruz, sc-108071) and maintained in culture in 10% FBS-DMEM including 2 µg/ml puromycin. MCF7 cells were seeded at a density of 5 × 10⁵ cells in a 60-mm culture dish and they were transfected with 25 nM AHCY siRNA using Lipofectamine RNAi MAX (Invitrogen, 13778-150) with 0.5% FBS-DMEM.
Real-time quantitative PCR
RNA was isolated from breast cancer cell lines using NucleoSpin® RNA/Protein kit (Macherey-Nagel) using the manufacturer’s instruction. Complementary DNA (5 µg) was made by reverse-transcribing RNA using M-MLV reverse transcriptase (Promega, M170A), RNasin® ribonuclease inhibitor (Promega, N211A), 100 nM oligo-dT, and 2.5 mM dNTP mixture. Approximately 0.1 µg cDNA was used for real-time qPCR that was conducted using HiFast SYBR Lo-Rox (Genepole, Q100240) and primers in LightCycler® thermocycler (Roche). The primers were as follows: human AHCY (forward: 5’-ATC CTT GGC CGG CAC TTT GAG-3’, reverse: 5’-TCC ACC TGC GGC TTG ATG TTC-3’) and human 18 s rRNA (forward: 5’-GTC GGC GTC CCC CAA CTT CTT-3’, reverse: 5’-CGT GCA GCC CCG GAC ATC TA-3’). Primers were produced by Bioneer (Daejeon, South Korea), and human 18 s rRNA was used for normalization.
Western blotting
Proteins were isolated from breast cancer cell lines using NucleoSpin® RNA/Protein kit (Macherey-Nagel) following the manufacturer’s instructions. The protein concentrations were determined using the bicinchoninic acid solution (Sigma, B9643) and copper (II) sulfate solution (Sigma, C2284). Proteins were separated on sodium dodecyl sulfate-polyacrylamide gels [10% resolving gel, 5% stacking gel; H2O, 30% acrylamide (Bio-Rad, #161-0156)], 1.5 M pH 8.8 Tris, 10% SDS, 10% ammonium persulfate, TEMED (Sigma, T9281) and transferred to a Clear Blot membrane (Atto, AE-6667-P). Membranes with the transferred proteins were blocked with a 5% solution of skim milk (BD, 232100) and washed with 1 × PBS (Welgene, LB204-01) with 0.1% Tween-20 (Sigma Aldrich, P9416), and the bands were visualized using chemiluminescence on an X-ray film (Fujifilm). Used-antibodies were organized in Table 1.
Table 1.
Information about antibodies used to western blotting analysis
| Name | Cat No. | Company |
|---|---|---|
| AHCY | ab134966 | Abcam |
| Ras (27H5) | #3339 | Cell signaling |
| Phospho-B-Raf (Ser445) | #2696 | Cell signaling |
| B-Raf (55C6) | #9433 | Cell signaling |
| Phospho-C-Raf (Ser259) | #9421 | Cell signaling |
| C-Raf | #9422 | Cell signaling |
| Phospho-MEK1/2 (Ser221) (166F8) | #2338 | Cell signaling |
| MEK1/2 (L38C12) | #4694 | Cell signaling |
| phospho-p44/42 MAPK (Erk1/2) (Thr202/Tyr204) (197G2) | #4377 | Cell signaling |
| p44/42 MAPK (Erk1/2) | #9102 | Cell signaling |
| cyclinD1 (92G2) | #2978 | Cell signaling |
| CDK6 (DCS83) | #3136 | Cell signaling |
| cyclinE (HE12) | #4129 | Cell signaling |
| CDK2 | sc-163 | Santa cruz |
| cyclinB1 (D5C10) XP® | #12231 | Cell signaling |
| phospho-cdc2 (Tyr15) (10A11) | #4539 | Cell signaling |
| cdc2 (POH1) | #9116 | Cell signaling |
| p21 waf1/cip1 (DCS60) | #2946 | Cell signaling |
| chk2 | NB100-500 | Novus Bio |
| ATM | NB100-309 | Novus Bio |
| phospho-MDM2 (Ser166) | sc-293105 | Santa cruz |
| MDM2 (SMP14) | sc-965 | Santa cruz |
| phospho-p53 (Ser15) | sc-101762 | Santa cruz |
| p53 (DO-1) | sc-126 | Santa cruz |
| Gadd45α (D17E8) | #4632 | Cell signaling |
| 14-3-3ζ/δ (D7H5) | #7413 | Cell signaling |
| cytoskeletal actin | A300-291A | Bethyl |
| goat anti-rabbit IgG, pAb | ADI-SAB-300-J | Enzo |
| goat anti-mouse IgG, pAb | ADI-SAB-100 | Enzo |
| anti-biotin HRP-linked Ab | #7075 | Cell signaling |
Cell proliferation assay
Approximately 1 × 10⁴ cells were seeded per well in 12-well cell culture plates in 10% FBS-DMEM. Five hours after seeding, 100 µl/well of the cell proliferation reagent WST-1 (Roche, 644807001) was added to the zero-hour wells and incubated in the dark for 1 h. Approximately 100 µl of the supernatant from each well was transferred to a 96-well culture plate and the absorption was measured at 450 nm using an ELISA plate reader (Bio-tek instruments, PowerWaveX340). The medium was changed to 1% FBS-DMEM and 100 µl/well WST-1 was added for 1 h and the supernatant was moved to a 96-well plate and the absorbance measured from 12 h post-incubation up to 48 h post-incubation in 12-h intervals in MCF7 cells and from 24 h post-incubation up to 96 h post-incubation in 24-h intervals in MCF7-ADR cells. Three independent experiments were carried out in triplicates.
BrdU assay
Approximately 1 × 10⁴ cells were seeded per well in 96-well plates and incubated in a humidified incubator at 37°C for 24 h. To analyze the cells’ proliferation capacity, 10 µM BrdU (Roche, 11647229001) was added to each well. After 2 h, the cells were fixed and stained according to the manufacturer’s instruction. Colorimetric analysis was carried out using an ELISA plate reader (Bio-tek instruments, PowerwaveX340).
Wound healing analysis
Approximately 1 × 10⁵ cells per milliliter were seeded in 10% FBS-DMEM in 60-mm dishes and kept in a humidified incubator at 37°C for 24 h. The medium was changed to 1% FBS-DMEM for an additional 24 h. When the cells were confluent, the cells on the dish’s midline were removed using a 10-µl pipette tip. After 0, 24, and 48 h of culture, the plate was photographed under a microscope at 40 × magnification.
Trans-well invasive analysis
Cell invasion was assessed using the Biocoat Matrigel Invasion Chamber (Becton Dickinson, 354480) according to the manufacturer’s instructions. Invasion chambers (24 wells) were rehydrated by adding 500 µl of warmed serum-free DMEM on each upper and lower chamber for 2 h. DMEM in the upper chamber was replaced with 500 µl of 3 × 10⁴ cells/ml in 1% FBS-DMEM, and in the lower chamber, DMEM was replaced with 750 µl of 10% FBS-DMEM with 5 µg/ml fibronectin (Sigma, F2006) as a chemoattractant. The plates were incubated for 24 h at 37°C with 5% CO2. Non-invasive cells were blotted dry from the upper chamber using cotton swabs. The cells that had invaded through the matrigel membrane were fixed with 100% methanol and stained with crystal violet (Sigma, C0775). The upper chamber was washed with H2O and the non-invading cells that had remained in the staining solution were removed by using cotton swabs. Invaded cells were visualized at 100 × magnification using a light compound microscope. Subsequently, 10% acetic acid was added to the upper chamber for quantifying the invading cells by using an ELISA plate reader (Bio-tek instruments, PowerwaveX340).
Cell cycle analysis
Approximately 1 × 10⁵ cells/ml were seeded in 10% FBS-DMEM in 100-mm dishes and incubated overnight. The medium was changed to FBS-free DMEM for 24 h and then changed to 1% FBS-DMEM for an additional 24 h. The cells were trypsinized and washed twice with phosphate-buffered saline (1 × PBS), autoclaved, and then fixed in 70% cold ethanol overnight at -20°C. Immediately before the assay, the cells were stained using PI/RNase staining buffer (Becton Dickinson, 550825) in the dark on ice until cell cycle analysis was carried out using a flow cytometer (Becton Dickinson, BD FACS Canto II). The flow cytometer equipped with a 488-nm laser was used for the analysis and 10,000 cells were analyzed in each measurement. Data were acquired and analyzed using the BD FACS Diva software (Becton Dickinson). The relative change in the mean fluorescence intensity was calculated as the ratio between mean fluorescence intensity in the channel of the treated cells and that of the control cells.
Statistical analysis
All in vitro experiments were repeated at least three times and presented as the mean ± standard deviation (SD). Statistical significance was analyzed using Student’s t tests at a P < 0.05.
Ethics statement
This study was officiated by the Biomedical Ethics Committee of the Sookmyung women’s university. This study was carried out according to contents of Institutional Review Board (IRB) seminar. The certification of the IRB seminar was assigned by Korea Human Resource Development Institute for Health & Welfare.
Results
AHCY is differentially expressed in human breast cancer cell lines
To screen the expression of AHCY in human breast cancer cell lines, we investigated the expression of AHCY by quantitative RT-PCR and western blot analysis. The mRNA and protein forms of AHCY were highly expressed in most of breast cancer cells including MCF7, MCF7-ADR, MDA-MB-231, MDA-MB-435S and T47D cells compared with human breast MCF10A cells, while they were less expressed in SK-BR-3 cells (Figure 1). To confirm the function of AHCY in breast cancer cells, we established stable AHCY-knockdown MCF7-ADR cells by using shRNA lentiviral particles (MCF7-ADR/shCon, MCF7-ADR/shAhcy). The mRNA and protein expression levels of AHCY in these cells are shown in Figure 1.
Figure 1.
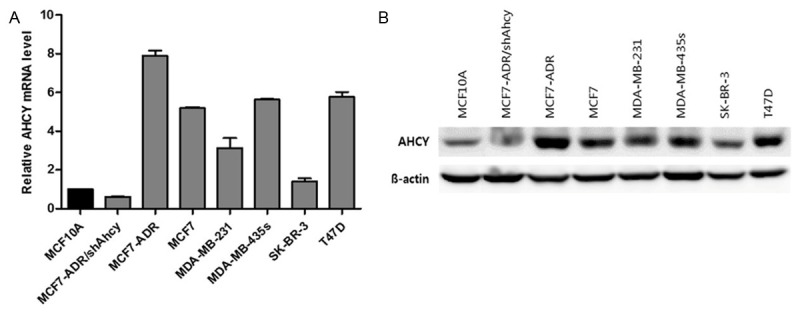
Profiling AHCY expression in a panel of human breast cancer cell lines. A. AHCY mRNA level by quantitative RT-PCR in human breast cancer cell lines. B. AHCY protein level in breast cancer cells was analyzed by western blot and 30 µg proteins were loaded per well.
The expression of AHCY is regulated by c-MYC activation in human breast cancer cell lines regardless of subtypes
Although MCF7-ADR cells and SK-BR-3 cells belong to same subtype of human breast cancer cell lines, they have opposite expression of AHCY each other. AHCY was over-expressed in MCF7-ADR cells, while less-expressed in SK-BR-3 cells than normal cells. In addition to, MCF7-ADR and MCF7 cells are different subtypes but they had similar expression pattern of AHCY (Figure 1). To investigate mechanism regulating expression of AHCY, we studied expression of c-MYC that is known as upstream molecule for AHCY expression. The results indicated that AHCY expression is dependent to c-MYC expression unrelated to subtype of breast cancer cell lines (Figure 2A and 2B). To study how different cell cycle mechanisms regulated by AHCY in both p53 wild-type and mutant-type breast cancer cell lines, we selected MCF7 as p53 wild-type cells and MCF7-ADR as p53 mutant-type cells. Before using MCF7 and MCF7-ADR cell lines for study, we confirmed that AHCY expression is decided by c-MYC using c-MYC siRNA. In the results, we can know that expression of AHCY is decreased by inhibiting c-MYC and c-MYC expression is little changed by AHCY inhibition in both MCF7 and MCF7-ADR cell lines (Figure 2C and 2D). It suggests that c-MYC effects on expression of AHCY in human breast cancer cells independent of subtypes.
Figure 2.
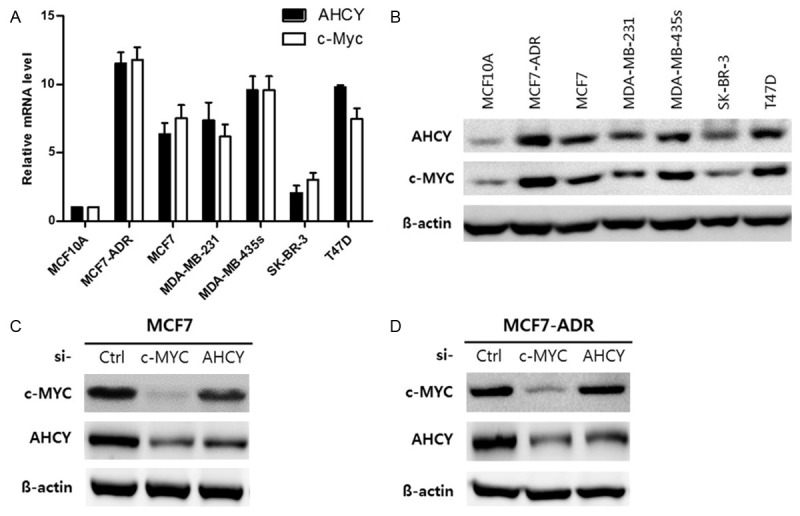
The expression of AHCY is determined by c-MYC activation in human breast cancer cell lines. A. c-MYC mRNA level by quantitative RT-PCR in human breast cancer cell lines. B. AHCY and c-MYC protein levels in breast cancer cells were analyzed by western blot and 30 µg proteins were loaded per well. C, D. 25 nM control, c-MYC and AHCY siRNA were treated in both MCF7 and MCF7-ADR cells for 48 h and the 30 µg protein levels were loaded per well and analyzed by western blot.
Knockdown of AHCY induces a decrease in cell proliferation in MCF7 and MCF7-ADR cells
To confirm whether the two cell lines we used for the functional studies had a change in cell viability and proliferation upon knock-down of AHCY, we first examined the expression of AHCY by quantitative RT-PCR and western blotting. The mRNA expression of AHCY was inhibited by about 90% in MCF7 cells and 60% in MCF7-ADR cells compared to the cells of origin (Figure 3A and 3D). To demonstrate the effects of AHCY on cell viability, we examined the cell proliferation rate using the cell proliferation reagent WST-1 in both AHCY-silenced breast cancer cell lines. The results showed that cell viability was decreased in MCF7 cells that were treated with AHCY siRNA starting at 12 h and MCF7-ADR/shAhcy cells starting at 48 h compared to each control groups (Figure 3B and 3E). To accurately assess the cell proliferation inhibitory ability of AHCY knockdown, we used BrdU analysis in both cell lines. The results indicated that the cell proliferation was reduced by about 70% in MCF7/siAhcy cells and by 50% in MCF7-ADR/shAhcy cells cultured in 5% FBS-DMEM (Figure 3C and 3F). According to these results, AHCY silencing causes a decrease in cell viability and the proliferation rate in both MCF7 and MCF7-ADR cells.
Figure 3.
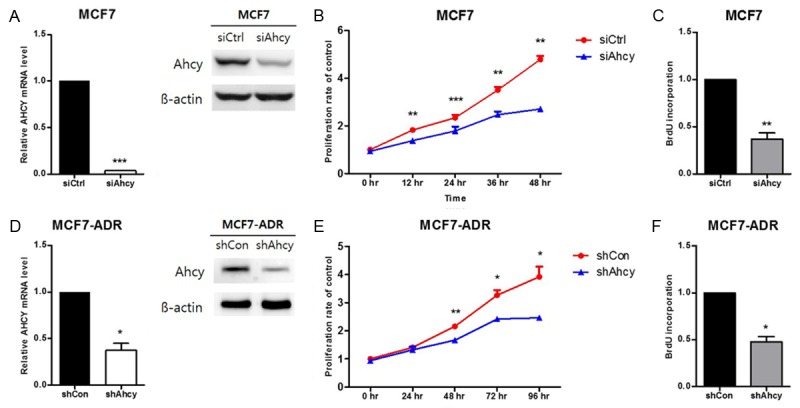
Effect of AHCY-knockdown in breast cancer cells. A, D. The AHCY expression levels in the cells used in the proliferation assay were confirmed by qRT-PCR and western blot and 30 µg proteins are loaded per well. The graphs show mean ± SD of three independent experiments. *means P<0.05 and ***means P<0.005. B, E. Cell proliferation rate of MCF7 and MCF7-ADR cells was detected by staining with the 10% solution of WST-1 for 48 and 96 h. The graphs show mean ± SD of three independent experiments. *means P<0.05, **means P<0.01 and ***means P<0.005. C, F. BrdU incorporation was measured after 2 h of staining by thymidine. The graphs show mean ± SD of three independent experiments. *means P<0.05 and **means P<0.01.
AHCY inhibition suppresses cell invasion and migration in MCF7 and MCF7-ADR cells
To confirm whether AHCY inhibition has the ability to regulate invasion and migration in breast cancer cells, we examined the invasive and metastatic activities of both MCF7 and MCF7-ADR cell lines using the wound-healing and trans-well assays. As shown in Figure 4A, the migration of AHCY siRNA-transfected MCF7 cells was reduced compared with control cells. Similarly, when MCF7 cells had low expression of AHCY, the invasive ability of the cells was also decreased (Figure 4B). In MCF7-ADR cells, the wound closure rate was lower in MCF7-ADR/shAhcy cells at 24 h post-wound induction and beyond (Figure 4C). The difference in the wound size between control groups and experimental groups was bigger in MCF7 cells than in MCF7-ADR cells (Figure 4A and 4C). The movement capability of cells was suppressed by about 50% in MCF7-ADR/shAhcy cells compared to the non-transduced cells (Figure 4D). The western blotting data in Figure 4 show that the expression of AHCY in both breast cancer cells used to each experiment. Therefore, we conclude that down-regulation of AHCY plays a role in interrupting the invasion and migration potential of breast cancer cells.
Figure 4.
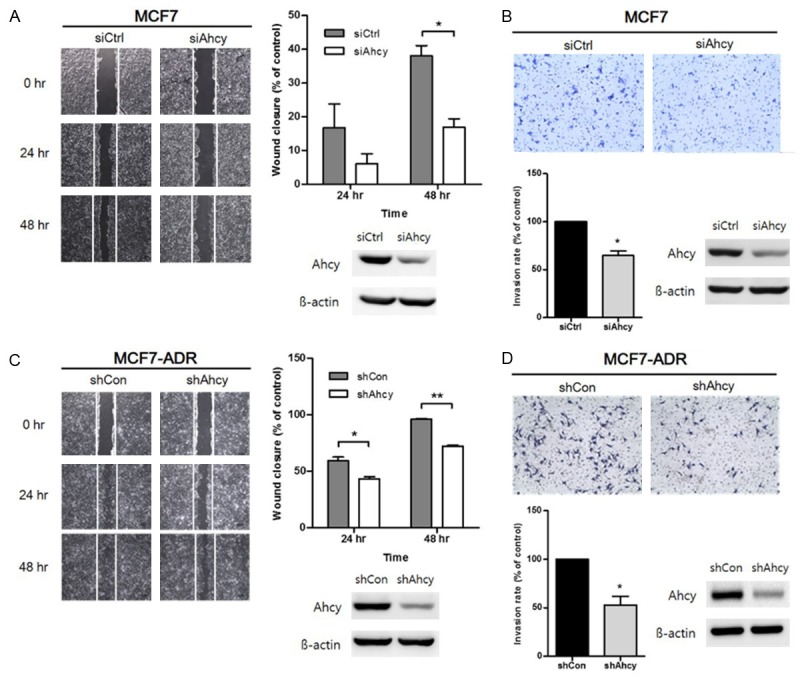
Effect of inhibiting AHCY in breast cancer cells on cell invasion and migration. A, C. Effect of AHCY on cell migration was studied by wound-healing assay with both MCF7 and MCF7-ADR cell lines. A wound was made by scraping with a pipet tip and the plates were observed after 24 h and 48 h using microscope with 40 × magnification. The empty area was measured for quantification of wound closure rate using the Image J program. The expression of AHCY in these cells was confirmed by western blotting analysis. The graphs show mean ± SD of three independent experiments. *means P<0.05 and **means P<0.01. B, D. Invasive cells were observed after 24 h of seeding under a microscope with 100 × magnification. Quantification of the relative cell invasion was detected by 10% acetic acid solution. The expression of AHCY of cells used in each experiment was confirmed by western blotting analysis. The graphs show mean ± SD of three independent experiments. *means P<0.05.
Silencing of AHCY regulates cell proliferation through the MEK/ERK signaling pathway in MCF7 and MCF7-ADR cells
The effect of AHCY on Ras, phospho-B-Raf (P-B-Raf), phospho-C-Raf (P-C-Raf), MEK, and ERK protein expression in breast cancer cells was studied by western blot analysis because these proteins are important for cell proliferation of breast cancer cells. A decrease in the protein levels of P-B-Raf, P-MEK, and P-ERK was observed in AHCY-knockdown MCF7 cells but the protein levels of Ras and P-C-Raf were not changed by AHCY down-regulation (Figure 5A and 5B). Similar to the results in MCF7 cells, phosphorylation of MEK and ERK was also inhibited in MCF7-ADR/shAhcy cells but the phosphorylation of B-Raf was slightly elevated as opposed to the MCF7 cells (Figure 5C and 5D). These results suggest that the proliferation of breast cancer cell lines is regulated by the expression of AHCY through the MEK/ERK signaling independent to Ras and Raf.
Figure 5.
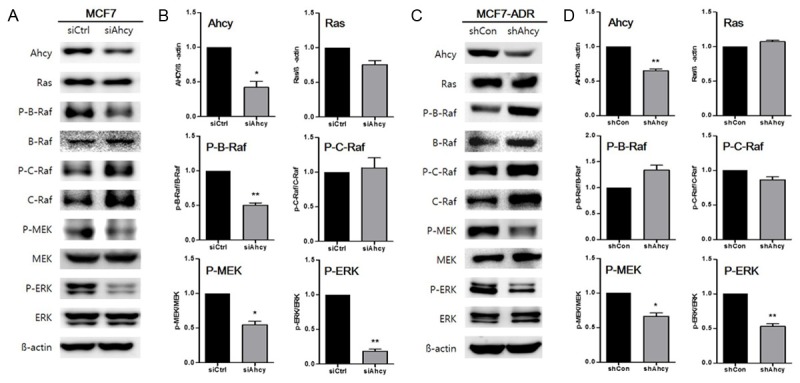
Regulation of MEK/ERK signaling in AHCY-knockdown breast cancer cells. A, C. Expression levels of Ras, C-/B-Raf, MEK, and ERK pathway molecules were detected by western blotting analysis in both MCF7 and MCF7-ADR cells and 30 µg of the proteins were loaded per well. B, D. Protein levels were quantified by densitometry using Multi gauge. The graphs show mean ± SD of three independent experiments. *means P<0.05 and **means P<0.01.
Reduction of AHCY causes G2/M phase arrest in MCF7 cells and G0/G1 phase arrest in MCF7-ADR cells
To study the mechanism behind AHCY’s cell proliferation-inhibitory activity, we carried out cell cycle analysis using flow cytometry. The results show that the cell cycle was arrested at the G2/M checkpoint in AHCY-knocked down MCF7 cells (Figure 6A). To elucidate the molecular mechanism behind the cell cycle arrest, we examined the expression of regulatory proteins of G2/M phase including cyclinB1 and phospho-CDC2 in AHCY-suppressed MCF7 cells. We determined that cyclinB1 was not degraded but was upregulated because CDC2 could not be de-phosphorylated and thus was unable to phosphorylate cyclinB1, which would cause the G2/M arrest of the cell cycle (Figure 6B). When AHCY was knocked down in MCF7-ADR cells, the cell cycle was arrested at the G0/G1 checkpoint (Figure 6C). The expression of cyclinD1 and CDK6-modulators of the G0/G1 cell cycle checkpoint-was reduced in MCF7-ADR/shAhcy cells as opposed to the levels of cyclinE and CDK2, which were not changed (Figure 6D). We also confirmed that the expression of p21 and p27, two CDK inhibitors, was increased in both MCF7 and MCF7-ADR cells treated with AHCY siRNA and shRNA (Figure 6B and 6D). The results demonstrated that AHCY knockdown induced cell cycle arrest at the G2/M checkpoint in MCF7 cells and at the G0/G1 checkpoint in MCF7-ADR cells.
Figure 6.
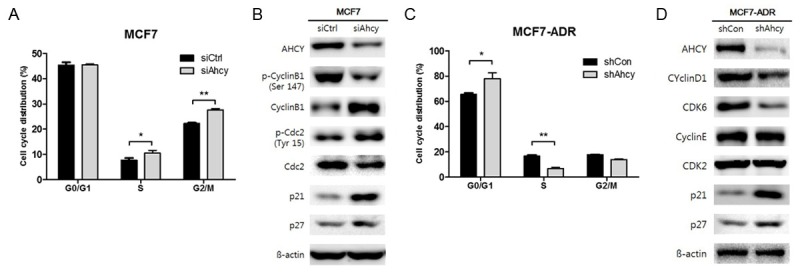
Cell cycle arrest by AHCY inhibition in breast cancer cells. A, C. The number of cells treated with propidium iodide (PI) for DNA staining in various stages of the cell cycle were quantified by measuring the area under the peaks. The cells in each phase were normalized to the total cells stained with PI. The graphs show mean ± SD of three independent experiments. *means P<0.05 and **means P<0.01. B, D. The expression of cell cycle proteins was detected by western blotting analysis in both MCF7 and MCF7-ADR cells and 30 µg proteins were loaded per well.
AHCY inhibition indirectly affects phosphorylation of p53 by regulating ATM kinase in MCF7 cells
We confirmed that the expression of p53, an inducer of p21, increased in MCF7 cells treated with AHCY siRNA. To confirm whether phosphorylation of p53 is indirectly induced by regulation of AHCY in MCF7 cells, we studied the expression of phospho-p53 and phospho-MDM2, an inhibitor of p53. Additionally, we also confirmed the expression of ATM-a kinase that directly phosphorylates p53- and CHEK2-an up-regulator of ATM- and molecules down-stream of p53 such as Gadd45 and 14-3-3δ. When AHCY was suppressed in MCF7 cells, ATM was hyper-expressed independent of CHEK2 and p53 was actively phosphorylated by the de-phosphorylation of MDM2. Furthermore, the expression of Gadd45 and 14-3-3δ, two modulators of G2/M cell cycle arrest, were upregulated (Figure 7A). These results support the data of flow cytometry shown in Figure 6. To verify that ATM is directly regulated by AHCY, we used an ATM inhibitor. Although MDM2 was slightly phosphorylated by the ATM inhibitor, other molecules such as phospho-p53, p21, Gadd45, 14-3-3-δ, cyclinB1 and phospho-CDC2 that were upregulated by AHCY siRNA, were down-regulated by the ATM inhibitor (Figure 7B). We thus conclude that AHCY regulates the cell cycle and proliferation in an ATM-dependent manner.
Figure 7.
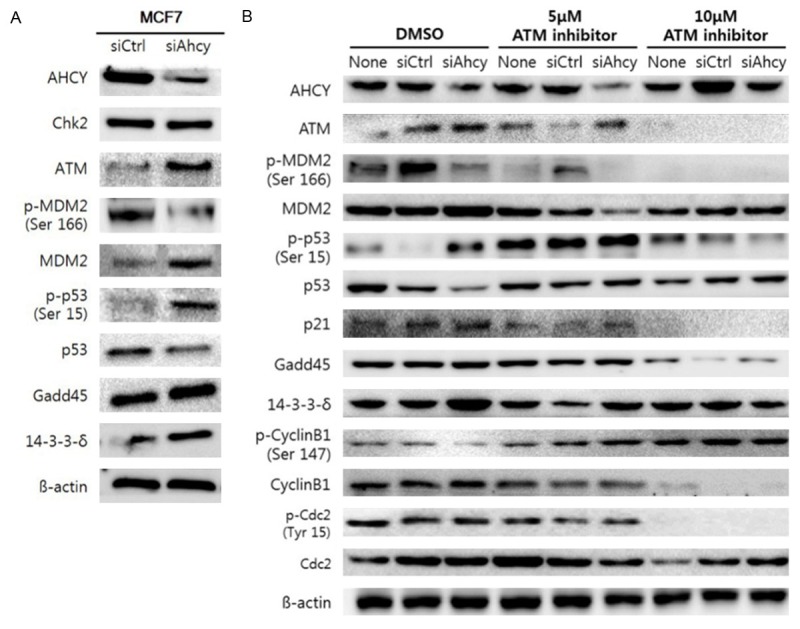
Phosphorylation of p53 through ATM kinase is controlled by AHCY in breast cancer cells. A. The expression of proteins related to the p53/MDM2 pathway were detected by western blotting analysis in MCF7 cells and 30 µg proteins were loaded per well. B. The expression of proteins related to both the p53/MDM2 pathway and G2/M checkpoint in the cell cycle were detected by western blotting analysis in MCF7 cells and 30 µg of the proteins were loaded per well. The ATM inhibitor was dissolved in DMSO and 10 µl of each solution was added to 2 ml DMEM. The ATM inhibitor was added after 1 h of AHCY siRNA transfection and the cells were harvested after 24 h of adding the ATM inhibitor.
Discussion
In this study, inhibition of AHCY in both MCF7 and MCF7-ADR cells suppressed cell invasion and migration as well as proliferation via the inhibition of the phosphorylation of MEK/ERK and cell cycle arrest. The cell proliferation was regulated by arrested at the G2/M checkpoint through the over-expression of ATM in AHCY-deficient MCF7 cells and at the G0/G1 checkpoint through the down-regulation of cyclinD1 and CDK6 in AHCY-silenced MCF7-ADR cells (Figure 8). Especially, our study demonstrated that the arrest of G2/M phase resulted from ATM kinases which was regulated by AHCY in MCF7 and it can be novel fact.
Figure 8.
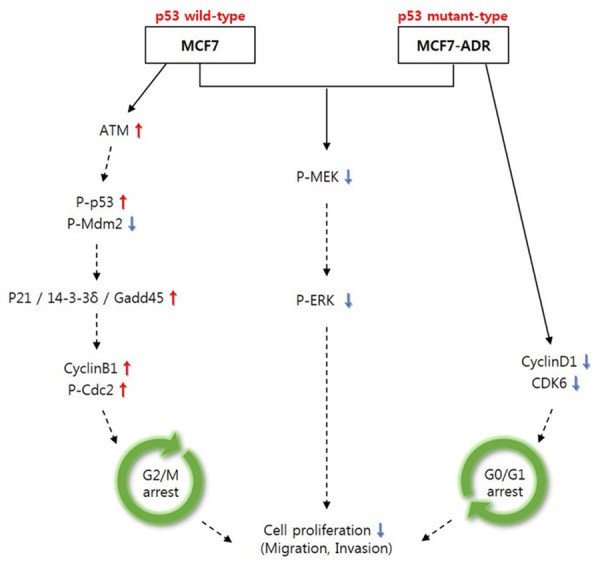
Summary of function of silenced-AHCY in MCF7 and MCF7-ADR cells. Brief sketch about function of AHCY-silencing on cell proliferation in both MCF7 and MCF7-ADR cells in vitro. Solid line means novelty processes and dotted line means to be already known.
Despite MCF7 and MCF7-ADR cell lines have common origin, the two cell lines are very different. The MCF7-ADR cells were more resistant to doxorubicin than MCF7 cell line and expression of genes that are important in drug resistance significantly change about 49% [25]. However, the expression pattern of AHCY was same in both MCF7 and MCF7-ADR cells (Figure 1). These expression patterns may result from c-MYC-overexpressed in two cell lines because it is known that c-MYC induces up-regulation of AHCY for mRNA cap methylation in cells [26]. We determined that the AHCY is expressed dependent of c-MYC in various subtypes of breast cancer cell lines including luminal (MCF7 and T47D), HER2 positive (MCF7-ADR and SK-BR-3) and triple-negative (MDA-MB-231 and MDA-MB-435s). This finding suggests that breast cancer cells negatively expressing AHCY such as SK-BR-3 may have c-MYC mutation, but it remains unclear whether c-MYC directly regulates expression of AHCY.
The Ras-Raf-MEK-ERK is responsible for many phenotypes in breast cancer cells, including cell proliferation, cell cycle progression, apoptosis, and senescence [27]. Consequently, our study confirms that breast cancer cell proliferation is inhibited by a decrease in the phosphorylation of MEK and ERK through the silencing of AHCY and independent of Ras and B-/C-Raf. This suggests that the AHCY knockdown may induce activation of some molecules that suppress the phosphorylation of MEK independently of the levels of Ras and Raf. PP2A regulates MEK activation Raf-independent in response to ERK silencing [28], we supposed that AHCY-defected induces activation of PP2A for inhibiting MEK phosphorylation but we confirmed that PP2A was not a target of AHCY (not shown data). More research is needed on the molecules that are regulated by AHCY and suppress MEK independently of Ras and Raf.
While MCF-7 human breast carcinoma cells have wild-type p53, MCF7-ADR subline cells have mutant p53 [29]. We found that cell cycle arrest occurred at different phases of the cell cycle in the breast cancer cells, MCF7 and MCF7-ADR (Figure 6). These studies suggest that AHCY may influence on cell cycle in other p53-wild typed breast cancer cells through same mechanism as that in MCF7 cells. Furthermore, silenced-AHCY may induce cell cycle arrest in breast cancer cells regardless of p53 status although we could not find accurate mechanisms yet. Therefore, we expect that unnatural cell proliferation could be inhibited by suppressing AHCY in various breast cancer cell lines.
ATM is a kinase that activates p53 by de-phosphorylating MDM2 [30], and a crucial substrate of ATM is CHEK2 that results in the activation and, in turn, the phosphorylation of a number of substrates such as p53, breast cancer 1 (BRCA1), and others [31]. However, we found that ATM levels were increased in AHCY-deficient breast cancer cells while CHEK2 levels were not changed (Figure 7). Therefore, we conclude that the effects of AHCY are independent of CHEK2 activation or AHCY may have other substrates for ATM activation in breast cancer cells. AHCY-dependent substrates about ATM should be more researched in the future.
In conclusion, our study extensively evaluated the anti-proliferative effects of AHCY-knockdown breast cancer cells, which was mediated by G2/M arrest via the ATM-kinase activated p53/MDM2 pathway in p53 wild-type MCF7 cells, and G1/S arrest in p53-mutated MCF7-ADR cells. Finally, our findings significantly contribute to the understanding of the anti-cancer properties of AHCY as well as to the future development of therapeutic agents against breast cancer.
Acknowledgements
This study was supported by the National Research Foundation of Korea (NRF) grant funded by the Korea government (MSIP) (2013R1A2A1A01011908) and the Sookmyung Women’s University Research Grants (1-1403-0086).
Disclosure of conflict of interest
I have disclosed those interests fully to Sookmyung women’s university, and have in place an approved plan for managing any potential conflicts arising from this arrangement.
References
- 1.Redig AJ, McAllister SS. Breast cancer as a systemic disease: a view of metastasis. J Intern Med. 2013;274:113–126. doi: 10.1111/joim.12084. [DOI] [PMC free article] [PubMed] [Google Scholar]
- 2.Muthuswami M, Ramesh V, Banerjee S, Viveka Thangaraj S, Periasamy J, Bhaskar Rao D, Barnabas GD, Raghavan S, Ganesan K. Breast tumors with elevated expression of 1q candidate genes confer poor clinical outcome and sensitivity to Ras/PI3K inhibition. PLoS One. 2013;8:e77553. doi: 10.1371/journal.pone.0077553. [DOI] [PMC free article] [PubMed] [Google Scholar]
- 3.Anderson WF, Rosenberg PS, Prat A, Perou CM, Sherman ME. How many etiological subtypes of breast cancer: two, three, four, or more? J Natl Cancer Inst. 2014:106. doi: 10.1093/jnci/dju165. [DOI] [PMC free article] [PubMed] [Google Scholar]
- 4.Batist G, Tulpule A, Sinha BK, Katki AG, Myers CE, Cowan KH. Overexpression of a novel anionic glutathione transferase in multidrug-resistant human breast cancer cells. J Biol Chem. 1986;261:15544–15549. [PubMed] [Google Scholar]
- 5.Scherf U, Ross DT, Waltham M, Smith LH, Lee JK, Tanabe L, Kohn KW, Reinhold WC, Myers TG, Andrews DT, Scudiero DA, Eisen MB, Sausville EA, Pommier Y, Botstein D, Brown PO, Weinstein JN. A gene expression database for the molecular pharmacology of cancer. Nat Genet. 2000;24:236–244. doi: 10.1038/73439. [DOI] [PubMed] [Google Scholar]
- 6.Moon YJ, Morris ME. Pharmacokinetics and bioavailability of the bioflavonoid biochanin A: effects of quercetin and EGCG on biochanin A disposition in rats. Mol Pharm. 2007;4:865–872. doi: 10.1021/mp7000928. [DOI] [PubMed] [Google Scholar]
- 7.Cheng Y, Tao L, Xu J, Li Q, Yu J, Jin Y, Chen Q, Xu Z, Zou Q, Liu X. CD44/cellular prion protein interact in multidrug resistant breast cancer cells and correlate with responses to neoadjuvant chemotherapy in breast cancer patients. Mol Carcinog. 2014;53:686–697. doi: 10.1002/mc.22021. [DOI] [PubMed] [Google Scholar]
- 8.Jin W, Liu Y, Xu SG, Yin WJ, Li JJ, Yang JM, Shao ZM. UHRF1 inhibits MDR1 gene transcription and sensitizes breast cancer cells to anticancer drugs. Breast Cancer Res Treat. 2010;124:39–48. doi: 10.1007/s10549-009-0683-8. [DOI] [PubMed] [Google Scholar]
- 9.Bartel RL, Borchardt RT. Effects of adenosine dialdehyde on S-adenosylhomocysteine hydrolase and S-adenosylmethionine-dependent transmethylations in mouse L929 cells. Mol Pharmacol. 1984;25:418–424. [PubMed] [Google Scholar]
- 10.Gibson KD, Wilson JD, Udenfriend S. The enzymatic conversion of phospholipid ethanolamine to phospholipid choline in rat liver. J Biol Chem. 1961;236:673–679. [PubMed] [Google Scholar]
- 11.Paik WK, Paik DC, Kim S. Historical review: the field of protein methylation. Trends Biochem Sci. 2007;32:146–152. doi: 10.1016/j.tibs.2007.01.006. [DOI] [PubMed] [Google Scholar]
- 12.Kim JH, Kim SC, Yi YS, Yang WS, Yang Y, Kim HG, Lee JY, Kim KH, Yoo BC, Hong S, Cho JY. Adenosine dialdehyde suppresses MMP-9-mediated invasion of cancer cells by blocking the Ras/Raf-1/ERK/AP-1 signaling pathway. Biochem Pharmacol. 2013;86:1285–1300. doi: 10.1016/j.bcp.2013.08.022. [DOI] [PubMed] [Google Scholar]
- 13.Song Z, Zhou Z, Song M, Uriarte S, Chen T, Deaciuc I, McClain CJ. Alcohol-induced S-adenosylhomocysteine accumulation in the liver sensitizes to TNF hepatotoxicity: possible involvement of mitochondrial S-adenosylmethionine transport. Biochem Pharmacol. 2007;74:521–531. doi: 10.1016/j.bcp.2007.05.005. [DOI] [PMC free article] [PubMed] [Google Scholar]
- 14.Villanueva JA, Halsted CH. Hepatic transmethylation reactions in micropigs with alcoholic liver disease. Hepatology. 2004;39:1303–1310. doi: 10.1002/hep.20168. [DOI] [PubMed] [Google Scholar]
- 15.Shu S, Mahadeo DC, Liu X, Liu W, Parent CA, Korn ED. S-adenosylhomocysteine hydrolase is localized at the front of chemotaxing cells, suggesting a role for transmethylation during migration. Proc Natl Acad Sci U S A. 2006;103:19788–19793. doi: 10.1073/pnas.0609385103. [DOI] [PMC free article] [PubMed] [Google Scholar]
- 16.Yideng J, Jianzhong Z, Ying H, Juan S, Jinge Z, Shenglan W, Xiaoqun H, Shuren W. Homocysteine-mediated expression of SAHH, DNMTs, MBD2, and DNA hypomethylation potential pathogenic mechanism in VSMCs. DNA Cell Biol. 2007;26:603–611. doi: 10.1089/dna.2007.0584. [DOI] [PubMed] [Google Scholar]
- 17.Dunn S, Cowling VH. Myc and mRNA capping. Biochim Biophys Acta. 2015;1849:501–505. doi: 10.1016/j.bbagrm.2014.03.007. [DOI] [PMC free article] [PubMed] [Google Scholar]
- 18.Ho A, Dowdy SF. Regulation of G(1) cell-cycle progression by oncogenes and tumor suppressor genes. Curr Opin Genet Dev. 2002;12:47–52. doi: 10.1016/s0959-437x(01)00263-5. [DOI] [PubMed] [Google Scholar]
- 19.Yu Q, Sicinska E, Geng Y, Ahnstrom M, Zagozdzon A, Kong Y, Gardner H, Kiyokawa H, Harris LN, Stal O, Sicinski P. Requirement for CDK4 kinase function in breast cancer. Cancer Cell. 2006;9:23–32. doi: 10.1016/j.ccr.2005.12.012. [DOI] [PubMed] [Google Scholar]
- 20.Grossel MJ, Hinds PW. Beyond the cell cycle: a new role for Cdk6 in differentiation. J Cell Biochem. 2006;97:485–493. doi: 10.1002/jcb.20712. [DOI] [PubMed] [Google Scholar]
- 21.Malumbres M, Barbacid M. Mammalian cyclindependent kinases. Trends Biochem Sci. 2005;30:630–641. doi: 10.1016/j.tibs.2005.09.005. [DOI] [PubMed] [Google Scholar]
- 22.Ericson KK, Krull D, Slomiany P, Grossel MJ. Expression of cyclin-dependent kinase 6, but not cyclin-dependent kinase 4, alters morphology of cultured mouse astrocytes. Mol Cancer Res. 2003;1:654–664. [PubMed] [Google Scholar]
- 23.Quelle DE, Ashmun RA, Shurtleff SA, Kato JY, Bar-Sagi D, Roussel MF, Sherr CJ. Overexpression of mouse D-type cyclins accelerates G1 phase in rodent fibroblasts. Genes Dev. 1993;7:1559–1571. doi: 10.1101/gad.7.8.1559. [DOI] [PubMed] [Google Scholar]
- 24.Yunlan L, Juan Z, Qingshan L. Antitumor activity of di-n-butyl-(2,6-difluorobenzo hydroxamato) tin(IV) against human gastric carcinoma SGC-7901 cells via G2/M cell cycle arrest and cell apoptosis. PLoS One. 2014;9:e90793. doi: 10.1371/journal.pone.0090793. [DOI] [PMC free article] [PubMed] [Google Scholar] [Retracted]
- 25.AbuHammad S, Zihlif M. Gene expression alterations in doxorubicin resistant MCF7 breast cancer cell line. Genomics. 2013;101:213–220. doi: 10.1016/j.ygeno.2012.11.009. [DOI] [PubMed] [Google Scholar]
- 26.Fernandez-Sanchez ME, Gonatopoulos-Pournatzis T, Preston G, Lawlor MA, Cowling VH. S-adenosyl homocysteine hydrolase is required for Myc-induced mRNA cap methylation, protein synthesis, and cell proliferation. Mol Cell Biol. 2009;29:6182–6191. doi: 10.1128/MCB.00973-09. [DOI] [PMC free article] [PubMed] [Google Scholar]
- 27.Wang H, Dey SK. Roadmap to embryo implantation: clues from mouse models. Nature reviews. Genetics. 2006;7:185–199. doi: 10.1038/nrg1808. [DOI] [PubMed] [Google Scholar]
- 28.Bae D, Ceryak S. Raf-independent, PP2Adependent MEK activation in response to ERK silencing. Biochem Biophys Res Commun. 2009;385:523–527. doi: 10.1016/j.bbrc.2009.05.082. [DOI] [PMC free article] [PubMed] [Google Scholar]
- 29.Robinson BW, Shewach DS. Radiosensitization by gemcitabine in p53 wild-type and mutant MCF-7 breast carcinoma cell lines. Clin Cancer Res. 2001;7:2581–2589. [PubMed] [Google Scholar]
- 30.Jain AK, Allton K, Duncan AD, Barton MC. TRIM24 is a p53-induced E3-ubiquitin ligase that undergoes ATM-mediated phosphorylation and autodegradation during DNA damage. Mol Cell Biol. 2014;34:2695–2709. doi: 10.1128/MCB.01705-12. [DOI] [PMC free article] [PubMed] [Google Scholar]
- 31.Abdel-Fatah TM, Arora A, Alsubhi N, Agarwal D, Moseley PM, Perry C, Doherty R, Chan SY, Green AR, Rakha E, Ball G, Ellis IO, Madhusudan S. Clinicopathological Significance of ATMChk2 Expression in Sporadic Breast Cancers: a Comprehensive Analysis in Large Cohorts. Neoplasia. 2014;16:982–991. doi: 10.1016/j.neo.2014.09.009. [DOI] [PMC free article] [PubMed] [Google Scholar]


