Abstract
Objective: To discuss the expression of hTrm6p/hTrm61p in bladder urothelial carcinoma tissue and its relationship with m1A level in urine, as well as the influences of hTrm6/hTrm61 on the proliferation and apoptosis of cancer cell line on urothelium. Methods: m1A levels in urine of 32 patients of bladder urothelial carcinoma and normal people were detected by HPLC/ESI-Q-TOF-MS, hTrm6p/hTrm61p expression levels in cancer tissue and para-carcinoma tissue of the same patient were detected by western blotting, and hTrm61 expressions of cancer cell line T24, 5637, and EJ of bladder urothelium and kidney cell line HEK-293 of human embryo were detected by RT-qPCR. The hTrm61 high-expression cell line is selected to detect the situation of proliferation and apoptosis by CCK-8 and flow cytometry (FCM) after knocking out hTrm61 with siRNA. Results: m1A level in urine of carcinoma of urinary bladder is significantly higher than that of normal people, and hTrm6p/hTrm61p expression level in cancer tissue is significantly higher than that in para-carcinoma tissue and has linear correlation with m1A level in urine. The hTrm61 expression in cell line 5637 is significantly higher than that of T24, EJ, and HEK293, and apoptosis is significantly affected after hTrm61 is knocked out from 5637 cell line. Conclusion: High-level expression of hTrm6p/hTrm61p is an important reason for high emission of m1A in urine, and hTrm6/hTrm61 promotes the occurrence of carcinoma of urinary bladder.
Keywords: Bladder urothelial carcinoma, urinary modified nucleosides, m1A, hTrm6p/hTrm61p, hTrm6/hTrm61, HPLC/ESI-Q-TOF-MS
Introduction
It is reported that modified nucleoside in urine can be used in diagnosis of various tumors [1-5] and has close relationship with prognosis. Moreover, it draws more and more attention for its convenient collection, non-invasive, small influences by external factors, and other advantages [2,6,7]. The latest research results show that combined detection to carcinoma of urinary bladder by 2 modified nucleosides, 1-methyladenosine (m1A) and 1-methyl inosine (1-MeI) has high sensitivity without reducing the specificity. Therefore, this combined detection can be treated as the primary tumor marker of carcinoma of urinary bladder, and has certain clinical application value in prognosis of carcinoma of urinary bladder [8]. In generation of urinary modified nucleosides, tRNA methylase plays an important role [9]. The expression of genetic abnormality of coding methyltransferase in tumor tissue may cause abnormal quantity and activity of methylase [10] and abnormal methylation level of tRNA to increase the level of modified nucleosides. The research indicates that m1A is formed by catalyzing methylase hTrm6p/hTrm61p [11,12]. This study detects m1A level in urine of patients with urothelium carcinoma by HPLC/ESI-Q-TOF-MS, and detects the expression level of hTrm6p/hTrm61p in cancer tissue and para-carcinoma tissue of the same patient by western blotting. On this basis, hTrm61 high-expression cell line is selected from cancer cell line of bladder urothelium, and one subunit of hTrm61 expression is knocked out by siRNA technology to detect its influences on cell proliferation and apoptosis and discuss its significance.
Materials and methods
Materials
Specimen source and data
32 patients of carcinoma of urinary bladder verified by pathology, including 25 males and 7 females in age of 41~85 with average of (63±8) ages were selected from The First Affiliated Hospital of Zhengzhou University from July 2011 to October 2012. There were 22 patients in primary attack and 10 patients in recurrence. According BUTT classification and staging methods proposed in 1999, they can be classified into I level in 14 cases, II level in 10 cases, in III level of 8 cases; invasive cancer of 18 cases and non-invasive cancer of 14 cases. For patients with emission standard of cryptorrhea, insobriety, urinary system infection, and renal insufficiency, above factors may affect RNA metabolism to affect the emission of urinary modified nucleosides [13]. 16 volunteers with normal results in physical examination conducted in Physical Examination Department, including 8 males and 8 females in age of 50~70 with average of (58±4) were selected as the control group. Urine of patients with carcinoma of urinary bladder was collected, and urine sample was randomly selected from control group. All the urine sample should be immediately pretreated after sampling for measuring nucleoside and inosine value. All the operations are bladder partial nephrectomy and hysterectomy, during which cancer tissue and para-carcinoma tissue (about 2 cm around cancer tissue) were collected. Collected tissues should be cleaned with normal saline, and the tissue specimen should be stored in liquid nitrogen immediately after collection.
Methods
Detection method of m1A in urine
Samples were stored in -20°C refrigerator after collection and unfrozen under room temperature before measuring. The pH value is adjusted to about 9.5, and the sample is centrifuged for 15 min by revolving speed of 12,000 rounds/minute. 1 ml supernatant is taken, and 0.30 mmol 6Cl-G loading sample with interior label in solid phase extraction column to collect effluent.
Measurement of nucleoside and creatinine in urine. Nucleoside concentration in urine is measured by HPLC online system, nucleoside content is measured by HPLC method, and uracil riboside is separated with C18 column. Internal standard method is used for quantification.
Measurement of creatinine. Creatinine content in urine sample is measured by ultraviolet spectroscopy. Random urine sample is taken as research object and ratio between nucleoside concentration and creatinine concentration [nmol/(μmol creatinine)] as research index to reflect the level of nucleoside in urine [14].
Nucleoside qualification and quantification. Peak identification method is adopted for measurement. Appearance time of unknown peak of urine sample to be inspected is compared with the appearance of standard nucleoside sample to identify various nucleosides in urine. Working curve of ratio between concentration and internal label of standard nucleoside sample in different concentrations is set to deduct the nucleoside concentration. Table 1 shows the linear relationship in standard curve of m1A and the lowest detection limit.
Table 1.
Standard Curve Data and the Lowest Limit of m1A (Equation of Linear Regression: y=ax+b)
| m1A standard sample | Linear equation | Linearity | Weight range (R2) | The lowest detection amount (nmol/ml) | |
|---|---|---|---|---|---|
|
| |||||
| Slope, a | interception, b | ||||
| 1- methyladenosine | 0.127 2 | 0.182 7 | 0.999 8 | 0.44-222.33 | 0.23 |
Detection of hTrm6p/hTrm61p expression level in cancer tissue and para-cancer tissue by western blotting
Total protein in tissue specimen is extracted by protein extraction kit, and the protein concentration is detected by BCA protein quantification kit. 25 μg loading quantity of sample is transferred under constant voltage and closed for 1 h under room temperature after SDS-PAGE electrophoresis. Primary antibody of anti-hTram6p (1:1000) and primary antibody of GADPH (1:2000) are acting for 12 h under 4°C. Working concentration of IgG/TRITC second antibody marked by HRP (1:1000) is acting for 1 h under 37°C, and then enhanced chemilluminescence (ECL) color-substrate solution is added to develop image by exposure after acting for 2 min in darkroom. Semi-quantitative analysis is conducted by image analysis software image J (NIH, U.S.) after film scanning.
Cell culture
Cell line 5637, T24, and EJ of bladder urothelium and cell line HEK-293 of kidney embryo are cultured in 1640 medium with 10% fetal calf serum and passaged by 0.25% trypsinization with EDTA. Tumor cells in logarithmic phase are selected for experiment.
RT-qPCR
Total RNA of cell is extracted by Trozol method, 5× g DNA Eraser Buffer, 2.0 ul; gDNA Eraser, 1.0 ul; TOTAL RNA, and calculation is conducted according to measured RNA concentration (<1.0 ug). Reaction system is supplemented with RNase Free dH2O to 10 ul, 42°C in 2 min, and impurities in total RNA is eliminated. 5×PrimeScript Buffer2, 4.0 ul; PrimeScript RT EnzymeMix I, 1.0 ul; RT Primer Mix, 1.0 ul; 10 ul total RNA reaction fluid and RNase Free dH2O used in impurity elimination, 4.0 ul, 37°C in 15 min, 85°C in 5sec, Pause at 4°C. SYBR® Premix Ex TaqTM (2×) 10.0 ul; PCR Forward Primer 0.4 ul; PCR Reverse Primer 0.4 ul; ROX Reference Dye II 0.4 ul; DNA mould 2.0 ul; dH2O 6.8 ul; 95°C 30 s; 95°C 3 s, 60°C 30 s for 40 circulations; 95°C in 15 s, 60°C in 1 min, and 95°C in 15 s. Meanwhile, GAPDH and hTrm61 were amplified, and Table 2 shows the primer used for amplification.
Table 2.
Sequences of siRNA and primers used in this study
| Name | Direction | Sequence 5→3 |
|---|---|---|
| GAPDH | Forward | AAGGTGAAGGTCGGAGTCA [dT][dT] |
| Reverse | UCUACUGUCACUCAGUAGU[dT][dT] | |
| hTrm61 | Forward | CCAGTCAGGTTCAACATGGAAG |
| Reverse | TGTGCGTCACCCAGTTCA | |
| NC | Sense | UUCUCCGAACGUGUCACGUTT |
| Auti-sense | ACGUGACACGUUCGGAGAATT | |
| siRNA1 | Sense | GGCACUCAGUUGACCUUAUTT |
| Anti-sense | AUAAGGUCAACUGAGUGCCTT | |
| siRNA2 | Sense | UCCUCUACUCCACAGACAUTT |
| Auti-sense | AUGUCUGUGGAGUAGAGGATT |
Lipofection transfection of siRNA to target cell
One day before transfection, 2 ml RPMI1640 medium without antibiotics is laid in 6-well plate to adjust cell concentration and make cells mixing by 30%-50% in transfection. Medium should be replaced in transfection. 200 pmol siRNA is diluted in 250 ul RPMI1640 medium without double resistant and serum. 5 ul Lipofectamine® 2000Reagent is mixed into 250 ul RPMI1640 medium without double resistant and serum, and incubate it for 5 min under room temperature after stiring slightly to evenness. After incubation, diluted siRNA is mixed into diluted Lipofectamine® 2000Reagent evenly, and incubate it for 20 min under room temperature. The mixture of siRNA and Lipofectamine® 2000Reagent is dropped in 6-well plate with cells and medium, and shake the plate back and forth to make it even. Normal medium should be replaced after transferred cells are cultured for 5 h under 37°C, 5% CO2, and saturation humidity, and cells should be collected after 24 hours to do detection of knockout efficiency.
Detection of cell proliferation by CCK-8
Cells transferred in 6-well plate should be digested by pancreatin without EDTA, and inoculated into 96-well plate by 2×10³ with 100 μl in each well. Influences on cell proliferation should be detected 24 h, 48 h, and 72 h after transfection, respectively. After adding 10 μl CCK-8 agent, microplate reader is adopted to detect optical density (OD value) at 45 nm after 2 hours of incubation. Then, all the groups of cells are compared in proliferation, and the experiment should be repeated for 3 times.
Apoptosis measurement by flow cytometry
Cells are digested by pancreatin without EDTA. Observed with microscope, cells are collected by centrifugal in rotate speed of 2000 r/s for 5 min after cells turn round. Then, medium is abandoned. PBS stored at 4°C in advance is used to wash cells for twice (in centrifugal speed of 2000 r/s for 5 min to collect cells); 400 ul 1× Binding Buffer is used to blow suspension cells to adjust cell concentration to about 1×10⁶ cells/ml. 5 ul Annexin V-FITC is added in cell suspension, and then blow and mix it mildly to evenness and incubate away from light under 2-8°C for 15 min. Later, 10 ul PI is added to blow and mix slightly to evenness and incubate away from light under 2-8°C for 5 min. After completing the system preparation, board detection should be completed in 2 hours.
Statistical treatment
SPSS17.0 statistical software is adopted in data processing, and (x̅±s) represents the result of measurement data. The difference comparison between m1A levels of patients with carcinoma of urinary bladder and normal people in control group can be conducted by two-independent-samples T test. In relation between expressions level of hTrmp6/hTrm61p in bladder cancer tissue and clinical and pathological characteristics, two two-independent-samples T test is adopted for different genders, recurrence and non-recurrence, and invasion and non-invasion. One-way analysis of variance and SNK-q test are adopted in mutual comparison between tissues. Difference of expression level of hTrm6p/hTrm61p in cancer tissue and para-cancer tissue is tested by matched T. The relationship between m1A level in urine and expression level of hTrm6p/hTrm61p is analyzed by Pearson correlation analysis and linear regression. The expression levels of cell lines EJ, T24, and 5637 in bladder urothelium and cell lines HEK-293, hTrm61, and mRNA in embryo kidney are tested by one-way analysis of variance and LSD-T test. Effect monitoring after knocking out hTrm61 and change of cell proliferation and apoptosis after knocking out are all tested by one-way analysis of variance and LSD-T test. With P<0.05, the difference has statistical significance.
Results
Comparison between m1A level in urine of bladder cancer group and control group
Two-independent-samples data T test is conducted to detect m1A level in urine of 32 patients with bladder cancer and 16 healthy volunteers. The result shows that m1A level in urine of bladder cancer group (5.76±0.90) is significantly higher than that of healthy volunteers (2.79±0.54) with statistical significance (P<0.05), and m1A level in urine of every patient in bladder cancer group is higher than that of control group in average.
Comparison between expression levels of hTrm6p/hTrm61p in bladder cancer group and control group
The detection result of western blotting shows that the expression quantity in 31 pairs (97%) of hTrm6p/hTrm61p protein in 32 pairs of tissue is significantly higher than that in para-cancer tissue. The expression of hTrm6p/hTrm61p in tissue of bladder cancer is (0.701±0.259) which has is different from that in para-cancer tissue (0.443±0.239) with statistical significance (P<0.05, Figure 1).
Figure 1.
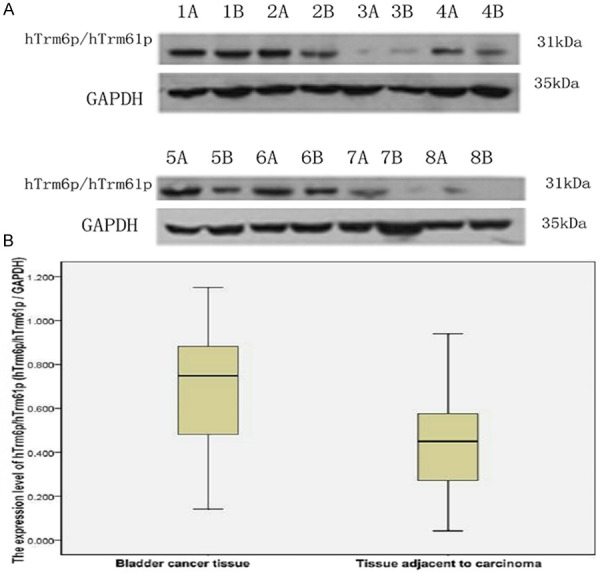
Expression of hTrm6p/hTrm61p protein in bladder cancer tissue and para-cancer tissue detected by western blot. A. Expression of hTrm6p/hTrm61p in bladder cancer tissue and para-cancer tissue (A is the cancer tissue, and B is para-cancer tissue); B. Plotting of relative transcript level of hTrm6p/hTrm61p protein/internal reference protain (GAPDH) in bladder cancer tissue and para-cancer tissue (mean).
Relationship between expression of hTrm6p/hTrm61p in bladder cancer and clinical and pathological characteristics
Table 3 shows the relationship between expression level of hTrm6p/hTrm61p in tissue of bladder cancer and clinical and pathological characteristics. The hTrm6p/hTrm61p expression level of patients in primary occurrence is 0.679±0.250 and that of patients in recurrence is 0.743±0.283, t=-0.641, P=0.526>0.05 which means the difference has no statistical significance. The hTrm6p/hTrm61p expression level of male patients is 0.703±0.273 and that of female patients is 0.696±0.221, t=0.057, P=0.955>0.05 which means the difference has no statistical significance. The hTrm6p/hTrm61p expression level of patients with invasive cancer is 0.689±0.272 and that of patients with non-invasive cancer is 0.716±0.251, t=-0.289, P=0.775>0.05. For the difference among histological grades, F=1.176 and P=0.323>0.05 which mean that there is no significant statistical difference between two groups.
Table 3.
Relationship between expression level of hTrm6p/hTrm61p in bladder cancer tissue and clinicopathologic features
| n | Expression level of hTrm6p/hTrm61p in bladder cancer tissue (hTrm6p/hTrm61p/GAPDH) | |
|---|---|---|
| Pathological grade | ||
| Grade I | 14 | 0.622±0.253 |
| Grade II | 10 | 0.770±0.227 |
| Grade III | 8 | 0.753±0.300 |
| If it is invasive | ||
| Invasive cancer | 18 | 0.689±0.272 |
| Non-invasive cancer | 14 | 0.716±0.251 |
| Gender | ||
| Male | 25 | 0.703±0.273 |
| Female | 7 | 0.696±0.221 |
| Primary occurrence and reoccurrence | ||
| Primary occurrence | 22 | 0.679±0.250 |
| Reoccurrence | 10 | 0.743±0.283 |
There is no correlation between the expression of hTrm6p/hTrm61p in bladder cancer tissue and clinical and pathological features.
Correlation analysis on m1A level in urine of patients with bladder cancer and expression level of hTrm6p/hTrm61p in cancer tissue
Scatter diagram was drew for the correlation between m1A level in urine of patients with bladder cancer and expression level of hTrm6p/hTrm61p in cancer tissue. Figure 2 shows the individual reference range and the regression fitted curve in 95% credibility interval of mean. According to the scatter diagram, m1A level in urine tends to increase with the rise of hTrm6p/hTrm61p protein expression level in cancer tissue. By conducting Pearson correlation analysis on these two variants, r=0.799 and P=0.000<0.05 which mean that m1A level in urine is correlated with hTrm6p/hTrm61p protein expression level in cancer tissue. By further linear regression analysis on two variants, determination coefficient R2=0.639 which reflects that the increase of hTrm6p/hTrm61p protein expression level in cancer tissue accounts for 63.9% in reasons to the rise of m1A level in urine, and F=53.018, P=0.000<0.05 which mean that the regression model has statistical significance. It can be considered that the increase of m1A level in urine of patients with bladder cancer has linear relationship with the increase of hTrm6p/hTrm61p protein expression level. Therefore, the constant and hTrm6p/hTrm61p expression level in bladder cancer tissue all have statistical significance. Constant a=3.816, regression coefficient b=2.782, and regression equation Ŷ=3.816+2.782X.
Figure 2.
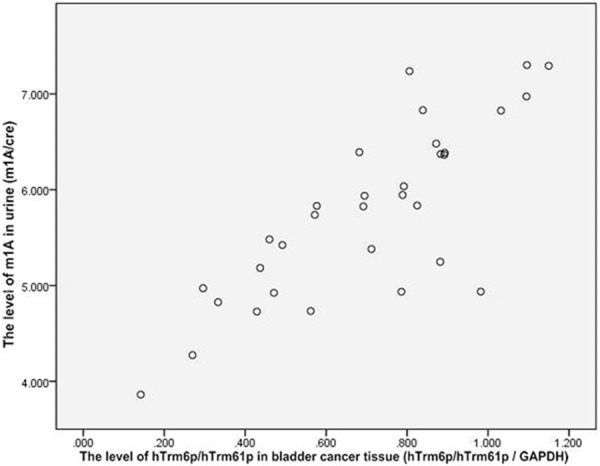
Tendency that m1A level in urine will increase with the rise of hTrm6p/hTrm61p protein expression level in cancer tissue.
The increase of hTrm61 expression level in cell line 5637 of bladder cancer
Fluorogenic quantitative PCR technology is used to detect hTrm61 expression of cancer cell lines T24, 5637, and EJ in bladder urothelium and cell line HEK-293 in embryo kidney. The difference between expressions of every group has statistical significance (F=58.081, P=0.000). Compared with cell line HEK293 (1.00±0.00), hTrm61 expression of cell line 5637 is 5.46±1.38, that of cell line T24 is 1.03±0.24, and that of cell line EJ is 1.17±0.19. By pairwise comparison of LSD: p=0.000 in comparison between 5637 and T24 which has statistical significance; P=0.000 in comparison between 5637 and EJ which has statistical significance; and P=0.000 in comparison between 5637 and HEK-293 which has statistical significance. On contrary, P=0.937 in comparison between T24 and HEK293 which has no statistical significance, and P=0.679 in comparison between EJ and HEK293 which has no statistical significance (Figure 3).
Figure 3.
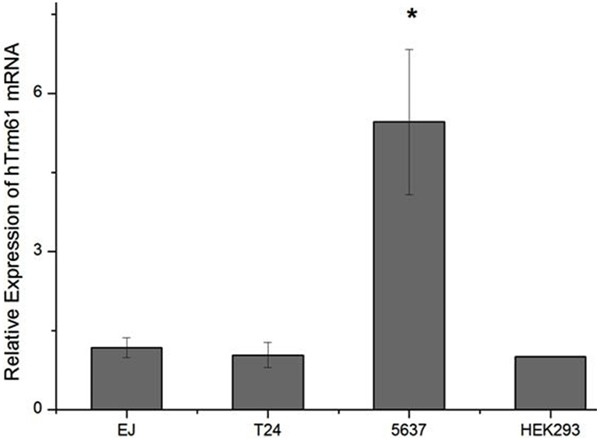
Expression level of hTrm61 in cell line 5637 of bladder cancer is the highest, which is significantly higher than that in T24, EJ, and cell line HEK-293 of human embryo kidney. The expression level of hTrm61 in T24, EJ, and cell line HEK-293 of human embryo kidney are all comparable without significant difference.
Influences of knockout of hTrm61 on proliferation activity and apoptosis
hTrm61 is knocked out from cell line 5637 of bladder cancer to set blank control group (BLANK), negative control group (NC), and siRNA1 and siRNA2 (which are knockout group) group. Knockout effect of total RNA detection is extracted 24 hours after transfection. Among blank control group (1.00±0.00), negative control group (0.96±0.09), siRNA1 group (0.30±0.01), and siRNA2 group (0.48±0.01), F=120.559 and P=0.000. By further pairwise comparison in knockout group and comparison between blank group and negative group, hTrm61 mRNA significantly reduces, and the knockout efficiency of siRNA1 group up to 70% is the best. siRNA1 is selected for subsequent experiment (Figure 4).
Figure 4.
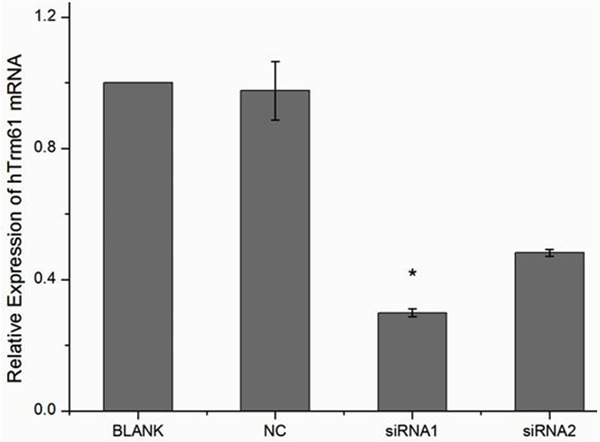
The expression level of hTrm61 mRNA in siRNA1 group and siRNA2 group after knocking hTrm61 out is significantly lower than that in blank control group and negative control group. However, there is no significant difference between the expression levels of hTrm61 mRNA in blank control group and negative control group, as well as siRNA1 group and siRNA2 group.
Cell Counting Kit-8 (CCK-8) is used to detect cell proliferation activity after knocking hTrm61 out from cell line 5637. The result shows that it has obvious influence on cell proliferation activity. The OD values of BLANK group, NC group, and knockout group (sihTrm61) 24 hours after knocking the target gene out are 0.87±0.03, 0.81±0.02, and 0.72±0.09, respectively. The difference between knockout group and BLANK group and NC group has statistical significance, while the difference between BLANK group and NC group has no statistical significance. The OD values of sihTrm61 group, BLANK group, and NC group 48 hours after knocking hTrm61 out are 1.03±0.09, 0.95±0.06, and 0.83±0.02. The difference between knockout group and BLANK group and NC group has statistical significance, while the difference between BLANK group and NC group has no statistical significance. The OD values of sihTrm61 group, BLANK group, and NC group 48 hours after knocking hTrm61 out are 1.04±0.04, 0.99±0.03, and 0.92±0.04. The difference between knockout group and BLANK group and NC group has statistical significance, while the difference between BLANK group and NC group has no statistical significance (Figure 5).
Figure 5.
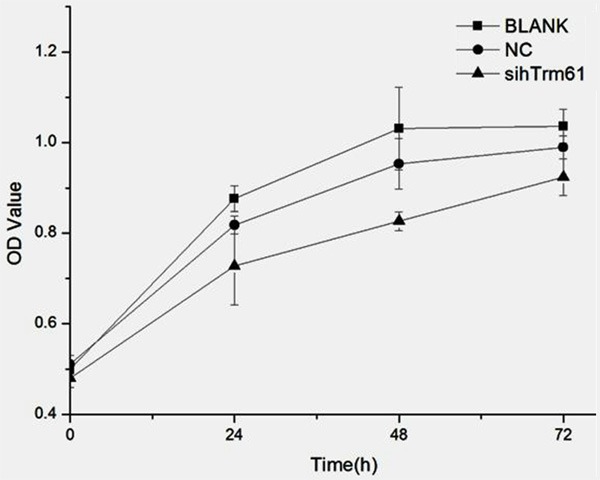
The cell proliferation activity significantly reduces after siRNA interferes the silent hTrm61, which has difference with statistical significance compared with NC group and BLANK group. However, the cell proliferation of NC group and BLANK group has no significant difference.
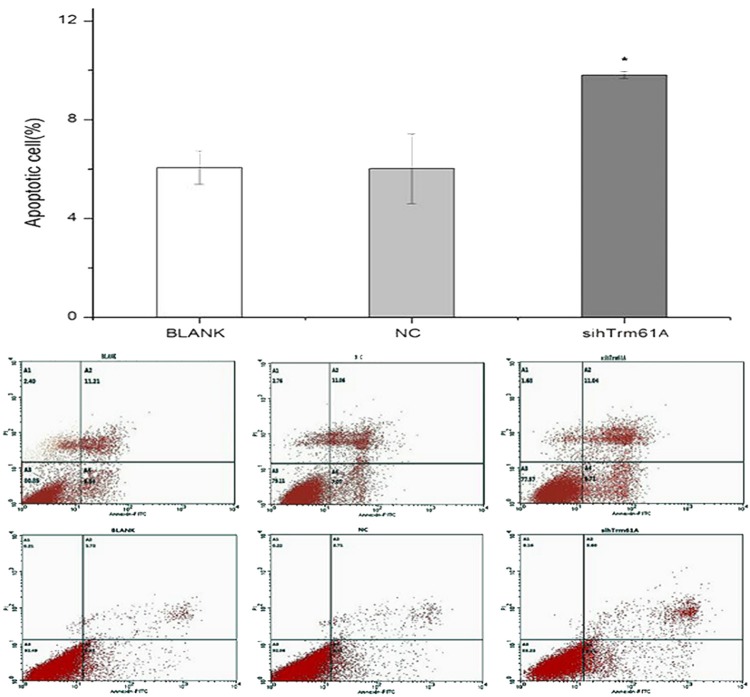
Cells are collected 48 hours after knocking hTrm61 out from cell line 5637 according to steps of apoptosis assays kit. By detecting with flow cytometry (FC), apoptotic cells of BLANK group account for 6.06±0.67 percent, apoptotic cells of NC group for 6.01±1.41 percent, and apoptotic cells of sihTrm61A group for 9.81±0.14 percent. The difference among different groups has statistical significance (F=11.490, P=0.039). By pairwise comparison of LSD: P=0.96 between BLANK group and NC group, which has no statistical significance; while P=0.026 between BLANK group and sihTrm61A group and P=0.025 between NC group and sihTrm61 group, which have statistical significance (Figure 6).
Figure 6.
The percentage of apoptotic cells significantly increases after siRNA interferes silent hTrm61, which has statistical significance compared with NC group and BLANK group. However, the percentage of apoptotic cells in NC group and BLANK group has no significant difference.
Discussions
Urinary modified nucleosides is the tumor molecular marker studied a lot in recent years [15]. The concentration of urinary modified nucleosides of patients with various malignant tumors is significantly higher than that of normal people [13,15]. The study shows that the level of modified nucleosides in urine can be used in selection of various tumors [16,17]. The adoption of urinary modified nucleosides in diagnosis and prognostic detection of breast cancer [18], liver cancer [4], rectal cancer [4], thyroid cancer [7], and other cancers has made satisfactory progress. Some researches prove that the combined detection by 1-methyladenosine (m1A) and 1-methyl inosine (1-MeI), these two urinary modified nucleosides has significance in diagnosis and prognosis of bladder cancer, so it can be the primary tumor marker of bladder cancer [8]. Therefore, the detection of modified nucleoside in urine can be used in tumor screening of population of large sample to screen and shrink the range of high-risk cancer-prone population.
The concentration of modified nucleosides in urine of patients with malignant tumor significantly increases mainly for following two reasons. Firstly, a large amount of cells in malignant tumor is in vigorous growth. The velocity of nucleic acid metabolism and protein synthesis accelerates, RNA metabolism speeds up, and the production of modified nucleosides increases. Secondly, some researches think that highly active tRNA modified enzyme exists in malignant cells [12]. This enzyme can highly modify tRNA with normal structure to produce abnormal tRNA which can produce a large amount of modified nucleosides in metabolism. The m1A 58 transmethylase (hTrm6p/hTrm61p) is an important enzyme which can modify to produce m1A in human body. As a heterological tetramer composed of two subunits, it can catalyze the adenosine (A) of tRNA 58 digits to become 1-methyladenosine (m1A). The literature reported that hTrm6p subunit plays a role of combing with tRNA template, and hTrm61p subunit anticipate in not only the combination with tRNA temperate, but also the catalyst modification from A to m1A. Without any subunit, the activity of enzyme will be affected. The study shows that tRNA transmethylase formed by catalyzing m1A in human body is m1A58 transmethylase that is, hTrm6p/hTrm61p [11,12].
This study further verifies that the m1A level (5.76±0.90) in urine of bladder cancer group is significant higher than that (2.79±0.54) in urine of health volunteers based on the preliminary study, which have statistical significance (P<0.05). Therefore, the m1A level can be used as the marker in diagnosis and forecasting prognosis of bladder tumor, which is consistent with the result of preliminary test. The detection for expression level of hTrm6p/hTrm61p protease forming m1A by catalyzing shows that the expression level of hTrm6p/hTrm61p protease in bladder cancer tissue (0.701±0.259) is significantly higher than that in para-cancer tissue (0.443±0.239), the difference between which has statistical significance (P<0.05). However, the expression level of hTrm6p/hTrm61p in bladder cancer tissue is not significantly different from clinicopathologic feature in statistics. At present, no rational explanation to this situation is found. The results of correlation analysis and linear regression analysis on expression level of hTrm6p/hTrm61p protease in bladder cancer tissue and m1A level in urine further explain the reason of increasing m1A level in urine, correlation coefficient r=0.799, determination coefficient R2=0.639, and P<0.05. These mean that the m1A level in urine has correlation with the expression level of hTrm6p/hTrm61p in bladder cancer tissue, and the increase of m1A level in urine of patients with bladder cancer has linear relation with that the increase of hTrm6p/hTrm61p protein expression level in cancer tissue. The increase of m1A in urine by 63.9% is resulted by the increase of hTrm6p/hTrm61p protein expression level in cancer tissue. This means that it is the high-level expression of tRNA modified enzyme in bladder cancer tissue that causes the high modification of tRNA, produces a large amount of abnormal tRNA, and further causes a large amount of emission of m1A, the modified nucleoside in urine.
We used fluorogenic quantitative PCT technology (qPCR) to detect the mRNA level of one subunit (hTrm6p/hTrm61p) in cell lines EJ, T24, 5637, and cell line HEK-293 of human embryo kidney and screen out the cell line 5637 with high expression of hTrm61 mRNA. The proliferation and apoptosis of cell line 5637 of bladder cancer were further detected after knocking hTrm61 out from cell line 5637 by siRNA interference. The result shows that the proliferation reduces, while the apoptosis increases in cell line 5637 of bladder cancer after knocking hTrm61 out. This means that hTrm61 plays an important role in pathogenesis of bladder cancer, and it possibly participates and promotes the morbidity of bladder cancer. However, the role of hTrm61 playing in the morbidity of bladder cancer is still unclear. Its influence on cells is mainly the modification of tRNAi Met. Any subunit knocked out from yeast and human breast cancer cell can make the growth of human breast cancer cell growth slow. After knocking Trm61 from bladder cancer cell, the proliferation activity of cells is also restricted. The literature reported that this is because the cell is easy to be degraded for the reduced stability of tRNAi Met. The degradation of tRNAi Met in yeast occurs before tRNA Met is mature in the endonuclear. Genes anticipating degradation are TRF4 and RRP44. The degradation of tRNAi Met may be reduced by knock any gene out based on the mutation of Trm6, and the phenotype of slow growth of yeast will also be improved [20].
In conclusion, the expression level of hTrm6p/hTrm61p protease in bladder cancer tissue is significantly higher than that in para-cancer tissue. In cancer tissue, the increasing expression level of hTrm6p/hTrm61p protease is an important reason causing the rise of m1A in urine. Meanwhile, the proliferation reduces and apoptosis increases after knocking hTrm61 out from cell lien 5637 with high expression hTrm61 mRNA, which provides evidence to the study on the mechanism that the urinary modified nucleoside obviously rises in urine of patients with bladder cancer. However, samples for this study is too few, and the activity of hTrm6p/hTrm61p proteinase is not detected, so the role of urinary modified nucleoside in the morbidity of bladder cancer is still unclear. In the later period, therefore, the samples should be further enlarged period, the activity of tRNA modified enzyme should be detected, and hTrm6/hTrm61 should be further discussed in level of gene to explore deeper reason of increasing level of urinary modified nucleoside of patients with bladder cancer, and provide evidence to early diagnosis and prognosis monitoring of bladder cancer.
Acknowledgements
The national natural science foundation of China (81272823) and Science and technology research project of Henan province (112102310547).
Disclosure of conflict of interest
None.
References
- 1.Hsu WY, Chen CJ, Huang YC, Tsai FJ, Jeng LB, Lai CC. Urinary Nucleosides as Biomarkers of Breast, Colon, Lung, and Gastric Cancer in Taiwanese. PLoS One. 2013;8:e81701. doi: 10.1371/journal.pone.0081701. [DOI] [PMC free article] [PubMed] [Google Scholar]
- 2.Bullinger D, Fröhlich H, Klaus F, Neubauer H, Frickenschmidt A, Henneges C, Zell A, Laufer S, Gleiter CH, Liebich H, Kammerer B. Bio informatical evaluation of modified nucleosides as biomedical markers in diagnosis of breast cancer. Anal Chim Acta. 2008;618:29–34. doi: 10.1016/j.aca.2008.04.048. [DOI] [PubMed] [Google Scholar]
- 3.Lo WY, Jeng LB, Lai CC, Tsai FJ, Lin CT, Chen WT. Urinary cytidine as an adjunct biomarker to improve the diagnostic ratio for gastric cancer in Taiwanese patients. Clin Chim Acta. 2014;428:57–62. doi: 10.1016/j.cca.2013.10.008. [DOI] [PubMed] [Google Scholar]
- 4.Jeng LB, Lo WY, Hsu WY, Lin WD, Lin CT, Lai CC, Tsai FJ. Analysis of urinary nucleosides as helper tumor markers in hepatocellular carcinoma diagnosis. Rapid Commun Mass Spectrom. 2009;23:1543–9. doi: 10.1002/rcm.4034. [DOI] [PubMed] [Google Scholar]
- 5.Seidel A, Seidel P, Manuwald O, Herbarth O. Modified nucleosides as biomarkers for early cancer diagnose in exposed populations. Environ Toxicol. 2015;30:956–67. doi: 10.1002/tox.21970. [DOI] [PubMed] [Google Scholar]
- 6.Hsu WY, Chen WT, Lin WD, Tsai FJ, Tsai Y, Lin CT, Lo WY, Jeng LB, Lai CC. Analysis of urinary nucleosides as potential tumor markers in human colorectal cancer by high performance liquid chromatography/electrospray ionization tandem mass speetrometry. Clin Chim Acta. 2009;402:31–7. doi: 10.1016/j.cca.2008.12.009. [DOI] [PubMed] [Google Scholar]
- 7.Kim KR, La S, Kim A, Kim JH, Liebich HM. Capillary electrophoretic profiling and pattern recognition analysis of urinary nucleosides from thyroid cancer patients. J Chromatogr B Biomed Sci Appl. 2001;754:97–106. doi: 10.1016/s0378-4347(00)00585-5. [DOI] [PubMed] [Google Scholar]
- 8.Zhang YR, Shi L, Wu H, Tang DD, Wang SM, Liu SM, Zhang LR, Song DK. Urinary modified nucleosides as novel biomarkers for diagnosis and prognostic monitoring of urothelial bladder cancer. Tumori. 2014;100:660–666. doi: 10.1700/1778.19274. [DOI] [PubMed] [Google Scholar]
- 9.Feng B, Zheng MH, Zheng YF, Lu AG, Li JW, Wang ML, Ma JJ, Xu GW, Liu BY, Zhu ZG. Normal and modified urinary nucleosides represent novel biomarkers for colorectal cancer diagnosis and surgery monitoring. J Gastroenterol Hepatol. 2005;20:1913–9. doi: 10.1111/j.1440-1746.2005.03888.x. [DOI] [PubMed] [Google Scholar]
- 10.Songe-Møller L, van den Born E, Leihne V, Vågbø CB, Kristoffersen T, Krokan HE, Kirpekar F, Falnes PØ, Klungland A. Mammalian ALKBH8 Possesses tRNA Methyltransferase Activity Required for the Biogenesis of Multiple Wobble Uridine Modifications Implicated in Translational Decoding. Mol Cell Biol. 2010;30:1814–27. doi: 10.1128/MCB.01602-09. [DOI] [PMC free article] [PubMed] [Google Scholar]
- 11.Ozanick S, Krecic A, Andersland J, Anderson JT. The bipartite structure of the tRNA m1A58 methyltransferase from S. cerevisiae is conserved in humans. RNA. 2005;11:1281–90. doi: 10.1261/rna.5040605. [DOI] [PMC free article] [PubMed] [Google Scholar]
- 12.Barraud P, Golinelli-Pimpaneau B, Atmanene C, Sanglier S, Van Dorsselaer A, Droogmans L, Dardel F, Tisné C. Crystal Structure of Thermus thermophilus tRNA m1A58 Methyltransferase and Biophysical Characterization of Its Interaction With tRNA. J Mol Biol. 2008;377:535–50. doi: 10.1016/j.jmb.2008.01.041. [DOI] [PubMed] [Google Scholar]
- 13.Seidel A, Brunner S, Seidel P, Fritz GI, Herbarth O. Modified nucleosides: an accurate tumor marker for clinical diagnosis of cancer, early detection and therapy control. Br J Cancer. 2006;94:1726–33. doi: 10.1038/sj.bjc.6603164. [DOI] [PMC free article] [PubMed] [Google Scholar]
- 14.Li HY, Wang SM, Liu HM, Bu SS, Li J, Han D, Zhang MZ, Wu GY. Separation and identification of purine nucleosides in the urine of patients with malignant cancer by reverse phase liquid chromatography/electrospray tandem mass spectrometry. J Mass Spectrom. 2009;44:641–51. doi: 10.1002/jms.1539. [DOI] [PubMed] [Google Scholar]
- 15.Zheng YF, Xu GW, Liu DY, Xiong JH, Zhang PD, Zhang C, Yang Q, Lv S. Study of urinary nucleosides as biological marker in cancer patients analyzed by micellar electrokinetic capillary chromatography. Electrophoresis. 2002;23:4104–9. doi: 10.1002/elps.200290027. [DOI] [PubMed] [Google Scholar]
- 16.Mao Y, Zhao X, Wang S, Cheng Y. Urinary nucleosides based potential biomarker selection by support vector machine for bladder cancer recognition. Anal Chim Acta. 2007;598:34–40. doi: 10.1016/j.aca.2007.07.038. [DOI] [PubMed] [Google Scholar]
- 17.Zheng YF, Yang J, Zhao XJ, Feng B, Kong HW, Chen YJ, Lv S, Zheng MH, Xu GW. Urinary nucleosides as biological markers for patients with colorectal cancer. Word J Gastroenterol. 2005;11:3871–6. doi: 10.3748/wjg.v11.i25.3871. [DOI] [PMC free article] [PubMed] [Google Scholar]
- 18.Xu G, Schmid HR, Lu X, Liebich HM, Lu P. Excretion pattern investigation of Urinary normal and modified nucleosides of breast cancer patients by RP-HPLC and factor analysis method. Biomed Chromatogr. 2000;14:459–63. doi: 10.1002/1099-0801(200011)14:7<459::AID-BMC7>3.0.CO;2-K. [DOI] [PubMed] [Google Scholar]
- 19.Min-Hua Z, BoFeng The clinical value of urinary nucleosides determination for the diagnosis of colorectal cancer. Chinese Journal of Surgery. 2004;19:595–597. [Google Scholar]
- 20.Kadaba S, Krueger A, Trice T, Krecic AM, Hinnebusch AG, Anderson J. Nuclear surveillance and degradation of hypomodified initiator tRNAMet in S. cerevisiae. Genes Dev. 2004;18:1227–40. doi: 10.1101/gad.1183804. [DOI] [PMC free article] [PubMed] [Google Scholar]


