Abstract
Background: Inflammation plays an important role in cancer progression and prognosis. However, the prognostic values of inflammatory biomarkers in esophageal cancer (EC) were not established. In the present study, therefore, we initially used a nomogram to predict prognostic values of various inflammatory biomarkers in patients with esophageal squamous cell carcinoma (ESCC). Methods: A total of 326 ESCC patients were included in this retrospective study. Glasgow prognostic score (GPS), neutrophil lymphocyte ratio (NLR), platelet lymphocyte ratio (PLR) and lymphocyte monocyte ratio (LMR) were analyzed in the current study. Kaplan-Meier method was used to calculate the cancer-specific survival (CSS). Cox regression analysis was also performed to evaluate the prognostic factors. A nomogram was established to predict the prognosis for CSS. Results: Patients were divided into 3 groups according to GPS (GPS 0, 1 and 2) and 2 groups according to NLR (≤3.45 and >3.45), PLR (≤166.5 and >166.5) and LMR (≤2.30 and >2.30). The 5-year CSS in patients with GPS 0, 1 and 2 were 49.2%, 26.8% and 11.9%, respectively (P<0.001). In addition, patients with NLR (>3.45), PLR (>166.5) and LMR (≤2.30) were significantly associated with decreased CSS, respectively (P<0.001). Multivariate analysis revealed that GPS (P<0.001), PLR (P=0.002) and LMR (P=0.002) were independent prognostic factors in patients with ESCC. In addition, a nomogram was established according to all significantly independent factors for CSS. The Harrell’s c-index for CSS prediction was 0.72. Conclusion: GPS, PLR and LMR were potential prognostic biomarkers in patients with ESCC. The nomogram based on CSS could be used as an accurately prognostic prediction for patients with ESCC.
Keywords: Esophageal cancer, squamous cell carcinoma, prognostic factor, cancer-specific survival, nomogram
Introduction
Esophageal cancer (EC) is the 8th most common cancer worldwide [1]. Incidences vary widely in different regions. The estimated overall incidence of EC was 5.7/100,000 [2]. However, the incidence of EC was 20.9/100,000 in China [3]. Therefore, China still suffers a great disease burden of EC. Radical resection remains the treatment of choice, however, the prognosis is still poor [4,5]. Esophageal squamous cell carcinoma (ESCC) is the most common pathological type of EC in China (90%-95%), in contrast to the predominance of esophageal adenocarcinoma (EAC) in the West [5,6]. Therefore, a prognostic study that takes into account the predominance of ESCC in China is important.
Recent reports revealed that inflammation plays an important role in cancer progression and prognosis [7,8]. Therefore, a series of inflammatory biomarkers, such as Glasgow prognostic score (GPS), neutrophil lymphocyte ratio (NLR), platelet lymphocyte ratio (PLR), and lymphocyte monocyte ratio (LMR), have been performed to evaluate the prognosis in various cancers [9-14]. However, few studies regarding these inflammatory biomarkers in patients with EC are available, and the clinical significance and prognostic values of these biomarkers remain uncertain [15-18]. In addition, previous studies had several drawbacks. First, most of these studies only evaluated one or two inflammatory biomarkers without considering others. Second, controversy exists concerning the optimal cut-off points for NLR, PLR and LMR to predict prognosis. The aim of the current study was initially to investigate the prognostic role of these inflammatory biomarkers (GPS, NLR, PLR and LMR) in patients with ESCC. In addition, we initially used a nomogram to predict prognostic values of these inflammatory biomarkers (GPS, NLR, PLR and LMR) in patients with ESCC.
Patients and methods
A retrospective analysis was conducted in patients with ESCC who underwent radical esophagectomy in our hospital between January 2006 and December 2008. The inclusion criteria were as follows: 1) ESCC was confirmed by histopathology and classified by the seventh edition of the TNM-UICC/AJCC classification [19]; 2) patients with curative esophagectomy (Ivor Lewis procedure or McKeown procedure) with standard lymphadenectomy (two-field or three-field lymphadenectomy) [20,21]; 3) patients without preoperative neoadjuvant therapy; 4) patients without previous anti-inflammatory medicines; and 5) preoperative laboratory tests were obtained before esophagectomy. At last, 326 patients were enrolled in the current study. Ethical approval was obtained from the Ethical Committees of Zhejiang Cancer Hospital (Hangzhou, China).
Routine laboratory results including the serum levels of c-reactive protein (CRP), albumin and blood cell counts (neutrophil, lymphocyte and platelet count) were extracted in a retrospective medical records. The GPS was calculated as follows: patients with elevated CRP level (>10 mg/l) and hypoalbuminemia (<35 g/l) were assigned to GPS2. Patients with one or no abnormal value were assigned to GPS1 or GPS0, respectively [9,15]. The definitions of NLR, PLR and LMR are described as follows: NLR=neutrophil to lymphocyte ratio; PLR=platelet count to lymphocyte ratio; and LMR=lymphocyte to monocyte ratio.
In our institute, patients were followed up every 3 to 6 months for the first 2 years after initial surgery, then annually. As the current study described the prognosis of patients with ESCC, therefore, a cancer-specific survival (CSS) analysis was ascertained. The CSS was defined as the time from surgery to cancer-related death. The median follow-up for the entire cohort was 45 months.
Statistical analysis
Statistical evaluation was conducted with SPSS 17.0 (SPSS Inc., Chicago, IL, USA) and R 3.1.2 software (Institute for Statistics and Mathematics, Vienna, Austria). Receiver operating characteristic (ROC) curves for CSS prediction were plotted to verify the optimum cuf-off points for NLR, PLR and LMR. Chi-square test was used to analyze the relationship between clinicopathologic parameters and these inflammatory biomarkers. The CSS was calculated by the Kaplan-Meier method, and the difference was assessed by the log-rank test. A univariate analysis was used to examine the association between various prognostic predictors and CSS. Possible prognostic factors associated with CSS were considered in a multivariable analysis. A nomogram for possible prognostic factors associated with CSS was established by R software, and the predictive accuracy was evaluated by Harrell’s concordance index (c-index) [22,23]. A P value less than 0.05 was considered to be statistically significant.
Results
Among the 326 patients, 43 (13.2%) were women and 283 (86.8%) were men. The mean age was 59.2 ± 7.9 years (range 38-80 years). Patients were divided into 3 groups according to GPS (GPS 0, 1 and 2). ROC curves for CSS were plotted to verify the optimum cut-off points for NLR, PLR and LMR, which were 3.45, 166.5, and 2.30, respectively (Figure 1). The areas under curve (AUC) for NLR, PLR and LMR were 0.680 (P<0.001), 0.701 (P<0.001) and 0.703 (P<0.001), respectively. Based on the optimum cut-off values of NLR, PLR and LMR, patients then were divided into 2 groups for further analysis (NLR ≤3.45 and >3.45; PLR ≤166.5 and >166.5; LMR ≤2.30 and >2.30).
Figure 1.
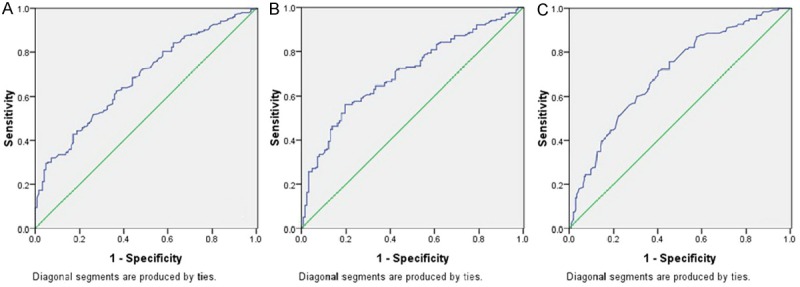
ROC curves for survival prediction (CSS) were plotted to verify the optimum cut-off points for NLR (A), PLR (B) and LMR (C). ROC curves for CSS were plotted to verify the optimum cut-off points for NLR, PLR and LMR, which were 3.45, 166.5, and 2.30, respectively. The areas under curve (AUC) for NLR, PLR and LMR were 0.680 (P<0.001), 0.701 (P<0.001) and 0.703 (P<0.001), respectively.
Clinicopathologic characters were compared between the high and low groups for GPS, NLR, PLR and LMR (Table 1). NLR, PLR and LMR grouped by GPS were shown in Figure 2. Pearson correlation analyses were used to analyze the correlation of NLR, PLR and LMR (Figure 3). Our results revealed that there were significant positive correlations between NLR and PLR (r=0.601, P<0.001). However, there were significant negative correlations in NLR and LMR (r=-0.194, P<0.001) and PLR and LMR (r=-0.185, P=0.001).
Table 1.
Comparison of baseline clinical characteristics based on GPS, NLR, PLR and LMR
| Cases (n, %) | GPS (n, %) | P value | NLR (n, %) | P value | PLR (n, %) | P value | LMR (n, %) | P value | ||||||
|---|---|---|---|---|---|---|---|---|---|---|---|---|---|---|
|
|
|
|
|
|||||||||||
| 0 | 1 | 2 | ≤3.45 | >3.45 | ≤166 | >166 | ≤2.30 | >2.30 | ||||||
| Age (years) | 0.598 | 0.410 | 0.676 | 0.167 | ||||||||||
| ≤60 | 184 (56.4) | 110 | 52 | 22 | 119 | 65 | 102 | 82 | 101 | 83 | ||||
| >60 | 142 (43.6) | 77 | 45 | 20 | 98 | 44 | 82 | 60 | 67 | 75 | ||||
| Gender | 0.449 | 0.633 | 0.810 | 0.704 | ||||||||||
| Female | 43 (13.2) | 27 | 13 | 3 | 30 | 13 | 25 | 18 | 21 | 22 | ||||
| Male | 283 (86.8) | 160 | 84 | 39 | 187 | 96 | 159 | 124 | 147 | 136 | ||||
| Tumor length (cm) | 0.001 | <0.001 | 0.001 | 0.304 | ||||||||||
| ≤3 | 89 (27.3) | 64 | 22 | 3 | 77 | 12 | 63 | 26 | 50 | 39 | ||||
| >3 | 237 (72.7) | 123 | 75 | 39 | 140 | 97 | 121 | 116 | 118 | 119 | ||||
| Tumor location | 0.179 | 0.277 | 0.121 | 0.146 | ||||||||||
| Upper | 19 (5.8) | 9 | 6 | 4 | 11 | 8 | 15 | 4 | 12 | 7 | ||||
| Middle | 156 (47.9) | 81 | 52 | 23 | 99 | 57 | 87 | 69 | 72 | 84 | ||||
| Lower | 151 (46.3) | 97 | 39 | 15 | 107 | 44 | 82 | 69 | 84 | 67 | ||||
| Vessel invasion | 0.136 | 0.066 | 0.523 | 0.635 | ||||||||||
| Negative | 269 (82.5) | 161 | 76 | 32 | 185 | 84 | 154 | 115 | 137 | 132 | ||||
| Positive | 57 (17.5) | 26 | 21 | 10 | 32 | 25 | 30 | 27 | 31 | 26 | ||||
| Differentiation | 0.333 | 0.023 | 0.186 | 0.079 | ||||||||||
| Well | 50 (15.3) | 31 | 12 | 7 | 35 | 15 | 28 | 22 | 33 | 17 | ||||
| Moderate | 206 (63.2) | 123 | 60 | 23 | 145 | 61 | 123 | 83 | 102 | 104 | ||||
| Poor | 70 (21.5) | 33 | 25 | 12 | 37 | 33 | 33 | 37 | 33 | 37 | ||||
| T stage | <0.001 | <0.001 | 0.078 | 0.059 | ||||||||||
| T1 | 59 (18.1) | 47 | 11 | 1 | 54 | 5 | 42 | 17 | 37 | 22 | ||||
| T2 | 60 (18.4) | 41 | 16 | 3 | 45 | 15 | 34 | 26 | 35 | 25 | ||||
| T3 | 175 (53.7) | 88 | 55 | 32 | 105 | 70 | 92 | 83 | 84 | 91 | ||||
| T4 | 32 (9.8) | 11 | 15 | 6 | 13 | 19 | 16 | 16 | 12 | 20 | ||||
| N stage | 0.001 | 0.007 | 0.004 | 0.041 | ||||||||||
| N0 | 179 (54.9) | 117 | 48 | 14 | 130 | 49 | 111 | 68 | 103 | 76 | ||||
| N1 | 84 (25.8) | 39 | 33 | 12 | 55 | 29 | 50 | 34 | 41 | 43 | ||||
| N2 | 40 (12.3) | 20 | 12 | 8 | 23 | 17 | 13 | 27 | 17 | 23 | ||||
| N3 | 23 (7.1) | 11 | 4 | 8 | 9 | 14 | 10 | 13 | 7 | 16 | ||||
Figure 2.
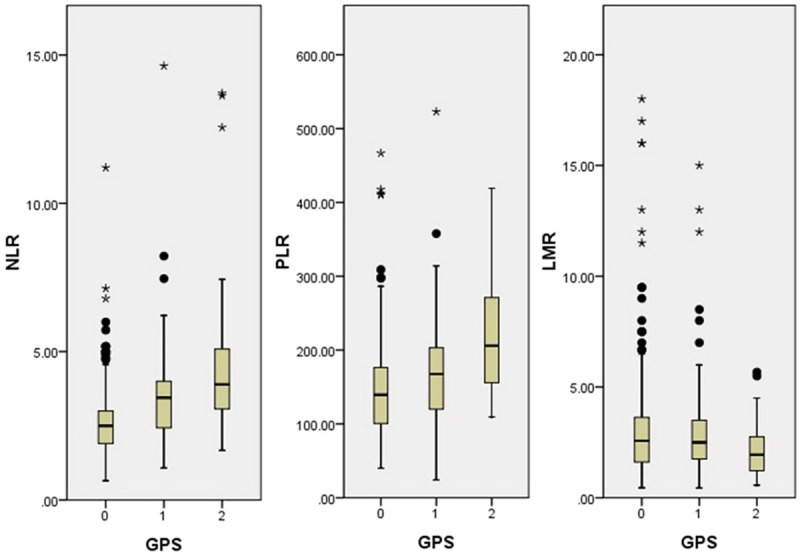
NLR, PLR and LMR grouped by GPS. NLR and PLR were significantly higher in patients with GPS 2, but LMR was significantly higher in patients with GPS 0.
Figure 3.
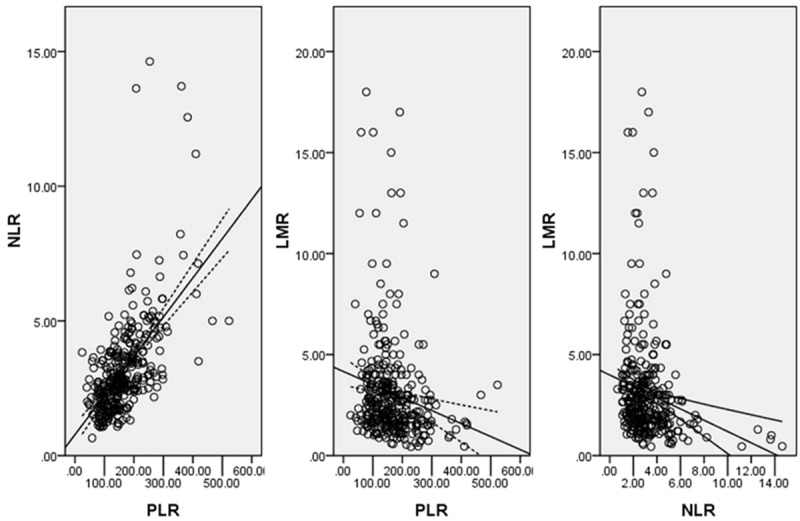
Pearson correlation analysis. There were significant positive correlations between NLR and PLR (r=0.601, P<0.001), but negative correlations in NLR and LMR (r=-0.194, P<0.001) and PLR and LMR (r=-0.185, P=0.001).
To evaluate the association of baseline characteristics and prognosis, Kaplan-Meier survival analysis and log-rank tests were performed (Table 2). The 5-year CSS was 37.7% in our study. The 5-year CSS in patients with GPS 0, 1 and 2 were 49.2%, 26.8% and 11.9%, respectively (P<0.001, Figure 4A). In addition, our study revealed that patients with NLR (>3.45), PLR (>166.5) and LMR (≤2.30) were significantly associated with decreased CSS, respectively (P<0.001, Figure 4B-D).
Table 2.
Survival analysis in ESCC patients
| 5-years CSS (%) | Log rank (Chi-square) | P-value | |
|---|---|---|---|
| Age (years) | 0.018 | 0.894 | |
| ≤60 | 37.5 | ||
| >60 | 38.0 | ||
| Gender | 0.999 | 0.317 | |
| Female | 46.5 | ||
| Male | 36.4 | ||
| Tumor length (cm) | 17.250 | <0.001 | |
| ≤3.0 | 55.1 | ||
| >3.0 | 31.2 | ||
| Tumor location | 1.132 | 0.568 | |
| Upper | 52.6 | ||
| Middle | 39.1 | ||
| Lower | 34.4 | ||
| Vessel invasion | 14.375 | <0.001 | |
| Negative | 41.6 | ||
| Positive | 19.3 | ||
| Differentiation | 7.105 | 0.029 | |
| Well | 46.0 | ||
| Moderate | 38.3 | ||
| Poor | 30.0 | ||
| T stage | 38.104 | <0.001 | |
| T1 | 67.8 | ||
| T2 | 45.0 | ||
| T3 | 28.0 | ||
| T4 | 21.9 | ||
| N stage | 63.989 | <0.001 | |
| N0 | 53.1 | ||
| N1 | 26.2 | ||
| N2 | 10.0 | ||
| N3 | 8.7 | ||
| Adjuvant therapy | 0.891 | 0.345 | |
| No | 39.4 | ||
| Yes | 34.0 | ||
| GPS | 45.504 | <0.001 | |
| 0 | 49.2 | ||
| 1 | 26.8 | ||
| 2 | 11.9 | ||
| NLR | 29.332 | <0.001 | |
| 0 (≤3.45) | 47.0 | ||
| 1 (>3.45) | 19.3 | ||
| PLR | 34.786 | <0.001 | |
| 0 (≤166.5) | 51.6 | ||
| 1 (>166.5) | 19.7 | ||
| LMR | 28.609 | <0.001 | |
| 0 (>2.30) | 51.8 | ||
| 1 (≤2.30) | 22.8 |
Figure 4.
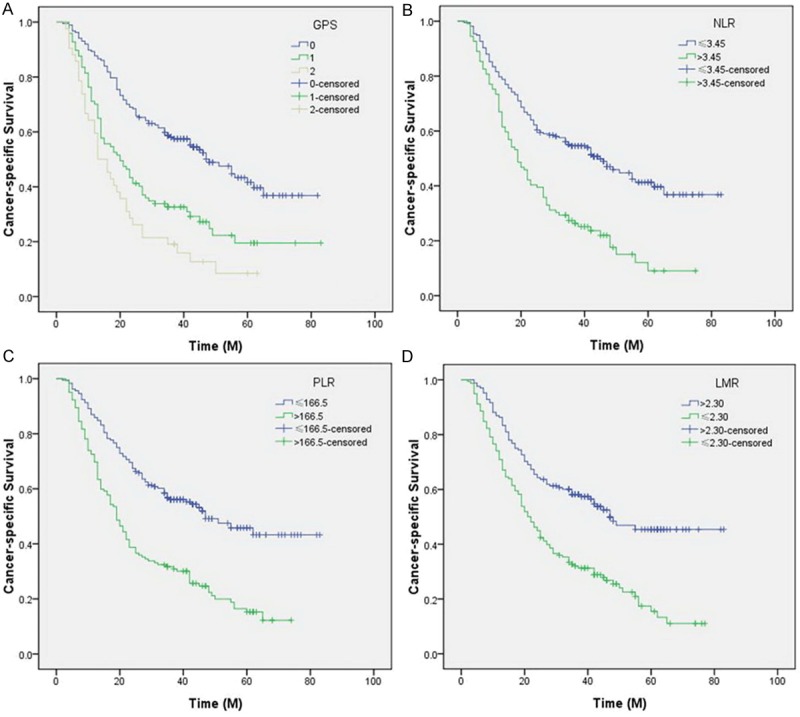
Kaplan-Meier CSS curves stratified by GPS (A), NLR (B), PLR (C) and LMR (D). The 5-year CSS in patients with GPS 0, 1 and 2 were 49.2%, 26.8% and 11.9%, respectively (P<0.001). Patients with NLR (>3.45), PLR (>166.5) and LMR (≤2.30) were significantly associated with decreased CSS, respectively (P<0.001).
Clinicopathological characters for prediction of CSS were further investigated by univariate analysis with Cox regression model. In univariate analysis, tumor length, vessel invasion, differentiation, T stage, N stage, GPS, NLR, PLR and LMR were significantly associated with CSS (Table 3). Then all of the 9 variables above were included in a multivariate Cox proportional hazards model to adjust the effects of covariates. In that model, we demonstrated that GPS (P<0.001), PLR (P=0.002) and LMR (P=0.002) were independent prognostic factors in patients with ESCC (Table 3).
Table 3.
Univariate and multivariate analyses of CSS in ESCC patients
| Univariate analysis | P-value | Multivariate analysis | P-value | |
|---|---|---|---|---|
|
|
|
|||
| HR (95% CI) | HR (95% CI) | |||
| Age (years) | 0.895 | - | - | |
| ≤60 | 1.000 | |||
| >60 | 1.019 (0.772-1.345) | |||
| Gender | 0.324 | - | - | |
| Female | 1.000 | |||
| Male | 1.244 (0.806-1.921) | |||
| Tumor length (cm) | <0.001 | 0.622 | ||
| ≤3.0 | 1.000 | 1.000 | ||
| >3.0 | 2.040 (1.441-2.887) | 1.106 (0.740-1.654) | ||
| Tumor location | 0.343 | - | - | |
| Upper/Middle | 1.000 | |||
| Lower | 1.119 (0.887-1.413) | |||
| Vessel invasion | <0.001 | 0.529 | ||
| Negative | 1.000 | 1.000 | ||
| Positive | 1.862 (1.338-2.591) | 1.121 (0.785-1.603) | ||
| Differentiation | 0.010 | 0.320 | ||
| Well/Moderate | 1.000 | 1.000 | ||
| Poor | 1.356 (1.075-1.711) | 1.139 (0.881-1.474) | ||
| T stage | <0.001 | 0.015 | ||
| T1-2 | 1.000 | 1.000 | ||
| T3-4 | 2.540 (1.831-3.524) | 1.634 (1.101-2.425) | ||
| N stage | <0.001 | <0.001 | ||
| N0 | 1.000 | 1.000 | ||
| N1-3 | 2.903 (2.183-3.862) | 1.919 (1.392-2.645) | ||
| Adjuvant therapy | 0.351 | - | - | |
| No | 1.000 | |||
| Yes | 1.150 (0.857-1.543) | |||
| GPS | <0.001 | <0.001 | ||
| 0 | 1.000 | 1.000 | ||
| 1-2 | 1.815 (1.516-2.172) | 1.438 (1.176-1.759) | ||
| NLR | <0.001 | 0.929 | ||
| 0 (≤3.45) | 1.000 | 1.000 | ||
| 1 (>3.45) | 2.116 (1.598-2.801) | 1.016 (0.723-1.426) | ||
| PLR | <0.001 | 0.002 | ||
| 0 (≤166.5) | 1.000 | 1.000 | ||
| 1 (>166.5) | 2.240 (1.696-2.960) | 1.655 (1.207-2.269) | ||
| LMR | <0.001 | 0.002 | ||
| 0 (>2.30) | 1.000 | 1.000 | ||
| 1 (≤2.30) | 2.105 (1.587-2.790) | 1.624 (1.202-2.195) |
To predict the survival risk (CSS) for patients with ESCC, a nomogram was established by multivariate Cox regression model according to all significantly independent factors for CSS (Figure 5). The nomogram is used by totalling the points identified at the top of the scale for each independent factor. This total point score is then identified on the total points scale to determine the probability of risk prediction. It can predict the probability of death for ESCC patients after initial surgery. The Harrell’s c-index for CSS prediction was 0.72.
Figure 5.
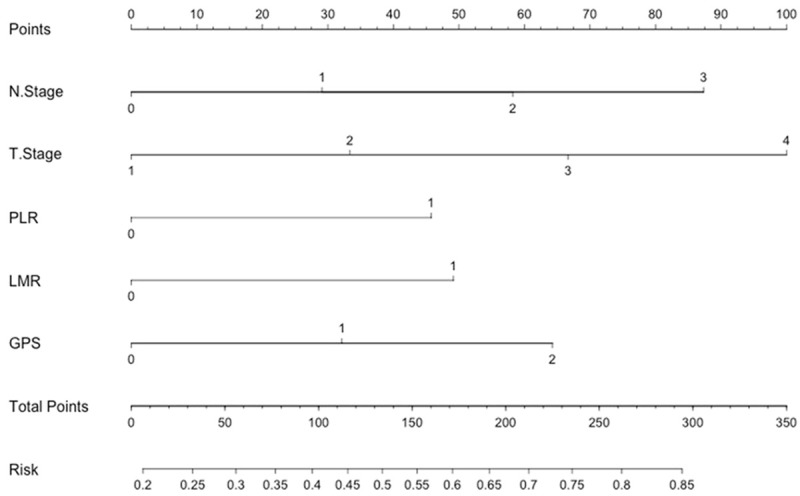
Nomogram predicts survival prediction based on GPS, PLR, LMR and other clinicopathological factors in patients with ESCC. The nomogram is used by totalling the points identified at the top of the scale for each independent factor. This total point score is then identified on the total points scale to determine the probability of risk prediction. The Harrell’s c-index for CSS prediction was 0.72.
Discussion
To the best of our knowledge, this is the first study to determine the prognostic values of various inflammatory biomarkers in predicting postoperative prognosis for patients with ESCC. In addition, this study was also the first attempt to establish a predictive nomogram to improve predictive accuracy based on these inflammatory biomarkers. Our study showed that preoperative GPS, NLR, PLR and LMR were significantly associated with prognosis in patients with ESCC. However, we demonstrated that only GPS (P<0.001), PLR (P=0.002) and LMR (P=0.002) were independent prognostic factors. A nomogram based on CSS could be used to be an accurately prognostic prediction for patients with ESCC (c-index=0.72).
In our study, we analyzed the prognostic values of these inflammatory biomarkers in ESCC patients without neoadjuvant therapy mainly because chemotherapy and/or radiation may have an important impact on the systemic inflammation. Several hematological biomarkers have shown prognostic significance in patients with cancers. In particular, the GPS has been well validated. Several previous studies have shown that GPS is associated with prognosis in various cancers, including Ecs [9,15]. In our study, GPS is still an independent prognostic factor. Recently, the prognostic values of NLR, PLR and LMR in patients with EC remain uncertain. Furthermore, controversy exists concerning the optimal cut-off points for these biomarkers to predict prognosis. Therefore, in our study, ROC curves for CSS prediction were plotted to verify the optimum cut-off points for NLR, PLR and LMR, which were 3.45, 166.5, and 2.30, respectively. NLR is related to prognosis in several cancers; however, its role in EC is still controversial. Several studies demonstrated that NLR is an independent prognostic factor in patients with EC [16,17]. In other reports, however, NLR does not correlate with cancer prognosis in patients with EC [18,24]. Moreover, there have been few studies regarding PLR in EC patients. Previous reports demonstrated that PLR does not correlate with prognosis in patients with EC [18]. In addition, recent studies demonstrated that LMR is associated with prognosis in hematological malignancy and lung cancer [13,14]. However, to the best of our knowledge, no studies regarding the predictive value of LMR in patients with EC are available. In our study, we revealed that preoperative NLR, PLR and LMR were all significantly associated with CSS. However, we demonstrated that only PLR and LMR were independent prognostic factors in patients with ESCC.
The mechanism of the prognostic values of these inflammatory biomarkers in cancer remains unclear. Several reports demonstrated that cancer-related inflammation causes suppression of antitumor immunity by recruiting regulatory T cells and activating chemokines, which results in tumor growth and metastasis [25,26]. The presence of neutrophilia, thrombocytosis and lymphopenia tends to represent a nonspecific response to cancer-related inflammation [27]. In addition, cancer has been shown to produce various cytokines, such as tumor necrosis factor-alpha (TNF-α), interleukin-1 (IL-1), and interleukin-6 (IL-6), which may influence tumor-related inflammation [27].
In the present study, we attempt to establish a predictive nomogram to predict the survival prediction based on GPS, PLR, LMR and other clinicopathological factors. We believe that our model could be a simple and easy tool for both the doctors and patients for estimating the survival in the absence of treatment in patients with ESCC. Thus, for example, a patient with T2 (33 points) N1 (29 points), PLR1 (>166.5, 45 points), LMR1 (<2.30, 49 points) and GPS1 (31 points) would score 187 total points that converts to a risk probability for death of 64%. Thus, we believe that the nomogram based on CSS could be used as an accurately prognostic prediction for patients with ESCC.
Several limitations should be acknowledged. Firstly, the current study was a retrospective design with a small size population. Secondly, the model did not include factors such as age or gender that may influence survival. Finally, the c-index showed that the model has a good accuracy but it is not perfect. There is still room for improvement of the predictive ability of the model. Therefore, further studies are needed to illuminate the relationship between these inflammatory biomarkers and prognosis in patients with ESCC.
In conclusion, GPS, PLR and LMR were potential prognostic biomarkers in patients with ESCC. The nomogram based on CSS could be used as an accurately prognostic prediction for patients with ESCC.
Acknowledgements
The authors would like to thank Dr. Fuxiang Ye (Department of Ophthalmology, Shanghai 9th People’s Hospital, Shanghai Jiao Tong University School of Medicine) for statistical analysis.
Disclosure of conflict of interest
The authors have no competing interests to disclose.
References
- 1.Siegel R, Naishadham D, Jemal A. Cancer statistics, 2013. CA Cancer J Clin. 2013;63:11–30. doi: 10.3322/caac.21166. [DOI] [PubMed] [Google Scholar]
- 2.Ferlay J, Shin HR, Bray F, Forman D, Mathers C, Parkin DM. Estimates of worldwide burden of cancer in 2008: GLOBOCAN 2008. Int J Cancer. 2010;127:2893–2917. doi: 10.1002/ijc.25516. [DOI] [PubMed] [Google Scholar]
- 3.Lin Y, Totsuka Y, He Y, Kikuchi S, Qiao Y, Ueda J, Wei W, Inoue M, Tanaka H. Epidemiology of esophageal cancer in Japan and China. J Epidemiol. 2013;23:233–242. doi: 10.2188/jea.JE20120162. [DOI] [PMC free article] [PubMed] [Google Scholar]
- 4.Keditsu KK, Jiwnani S, Karimundackal G, Laskar SG, Pramesh CS. Multimodality management of esophageal cancer. Indian J Surg Oncol. 2013;4:96–104. doi: 10.1007/s13193-013-0216-0. [DOI] [PMC free article] [PubMed] [Google Scholar]
- 5.Kamangar F, Dores GM, Anderson WF. Patterns of cancer incidence, mortality, and prevalence across five continents: defining priorities to reduce cancer disparities in different geographic regions of the world. J. Clin. Oncol. 2006;24:2137–2150. doi: 10.1200/JCO.2005.05.2308. [DOI] [PubMed] [Google Scholar]
- 6.Napier KJ, Scheerer M, Misra S. Esophageal cancer: A review of epidemiology, pathogenesis, staging workup and treatment modalities. World J Gastrointest Oncol. 2014;6:112–120. doi: 10.4251/wjgo.v6.i5.112. [DOI] [PMC free article] [PubMed] [Google Scholar]
- 7.Balkwill F, Mantovani A. Inflammation and cancer: back to Virchow? Lancet. 2001;357:539–545. doi: 10.1016/S0140-6736(00)04046-0. [DOI] [PubMed] [Google Scholar]
- 8.Mantovani A, Allavena P, Sica A, Balkwill F. Cancer-related inflammation. Nature. 2008;454:436–444. doi: 10.1038/nature07205. [DOI] [PubMed] [Google Scholar]
- 9.McMillan DC, Crozier JE, Canna K, Angerson WJ, McArdle CS. Evaluation of an inflammation-based prognostic score (GPS) in patients undergoing resection for colon and rectal cancer. Int J Colorectal Dis. 2007;22:881–886. doi: 10.1007/s00384-006-0259-6. [DOI] [PubMed] [Google Scholar]
- 10.Azab B, Mohammad F, Shah N, Vonfrolio S, Lu W, Kedia S, Bloom SW. The value of the pretreatment neutrophil lymphocyte ratio vs. platelet lymphocyte ratio in predicting the longterm survival in colorectal cancer. Cancer Biomark. 2014;14:303–312. doi: 10.3233/CBM-140416. [DOI] [PubMed] [Google Scholar]
- 11.Jiang N, Deng JY, Liu Y, Ke B, Liu HG, Liang H. The role of preoperative neutrophil-lymphocyte and platelet-lymphocyte ratio in patients after radical resection for gastric cancer. Biomarkers. 2014;19:444–451. doi: 10.3109/1354750X.2014.926567. [DOI] [PubMed] [Google Scholar]
- 12.Wang D, Yang JX, Cao DY, Wan XR, Feng FZ, Huang HF, Shen K, Xiang Y. Preoperative neutrophil-lymphocyte and platelet-lymphocyte ratios as independent predictors of cervical stromal involvement in surgically treated endometrioid adenocarcinoma. Onco Targets Ther. 2013;6:211–216. doi: 10.2147/OTT.S41711. [DOI] [PMC free article] [PubMed] [Google Scholar]
- 13.Wei X, Huang F, Wei Y, Jing H, Xie M, Hao X, Feng R. Low lymphocyte to monocyte ratio predicts unfavorable prognosis in non-germinal center type diffuse large B cell lymphoma. Leuk Res. 2014;38:694–698. doi: 10.1016/j.leukres.2014.03.013. [DOI] [PubMed] [Google Scholar]
- 14.Lin GN, Peng JW, Xiao JJ, Liu DY, Xia ZJ. Prognostic impact of circulating monocytes and lymphocyte-to-monocyte ratio on previously untreated metastatic non-small cell lung cancer patients receiving platinum-based doublet. Med Oncol. 2014;31:70. doi: 10.1007/s12032-014-0070-0. [DOI] [PubMed] [Google Scholar]
- 15.Vashist YK, Loos J, Dedow J, Tachezy M, Uzunoglu G, Kutup A, Yekebas EF, Izbicki JR. Glasgow Prognostic Score is a predictor of perioperative and long-term outcome in patients with only surgically treated esophageal cancer. Ann Surg Oncol. 2011;18:1130–1138. doi: 10.1245/s10434-010-1383-7. [DOI] [PubMed] [Google Scholar]
- 16.Sato H, Tsubosa Y, Kawano T. Correlation between the pretherapeutic neutrophil to lymphocyte ratio and the pathologic response to neoadjuvant chemotherapy in patients with advanced esophageal cancer. World J Surg. 2012;36:617–622. doi: 10.1007/s00268-011-1411-1. [DOI] [PubMed] [Google Scholar]
- 17.Sharaiha RZ, Halazun KJ, Mirza F, Port JL, Lee PC, Neugut AI, Altorki NK, Abrams JA. Elevated preoperative neutrophil:lymphocyte ratio as a predictor of postoperative disease recurrence in esophageal cancer. Ann Surg Oncol. 2011;18:3362–3369. doi: 10.1245/s10434-011-1754-8. [DOI] [PMC free article] [PubMed] [Google Scholar]
- 18.Dutta S, Crumley AB, Fullarton GM, Horgan PG, McMillan DC. Comparison of the prognostic value of tumour- and patient-related factors in patients undergoing potentially curative resection of oesophageal cancer. World J Surg. 2011;35:1861–1866. doi: 10.1007/s00268-011-1130-7. [DOI] [PubMed] [Google Scholar]
- 19.Rice TW, Rusch VW, Ishwaran H, Blackstone EH Worldwide Esophageal Cancer Collaboration. Cancer of the esophagus and esophagogastric junction: data-driven staging for the seventh edition of the American Joint Committee on Cancer/International Union Against Cancer Staging Manuals. Cancer. 2010;116:3763–3773. doi: 10.1002/cncr.25146. [DOI] [PubMed] [Google Scholar]
- 20.Low DE, Bodnar A. Update on clinical impact, documentation, and management of complications associated with esophagectomy. Thorac Surg Clin. 2013;23:535–550. doi: 10.1016/j.thorsurg.2013.07.003. [DOI] [PubMed] [Google Scholar]
- 21.Ye T, Sun Y, Zhang Y, Zhang Y, Chen H. Three-field or two-field resection for thoracic esophageal cancer: a meta-analysis. Ann Thorac Surg. 2013;96:1933–1941. doi: 10.1016/j.athoracsur.2013.06.050. [DOI] [PubMed] [Google Scholar]
- 22.Kattan MW. Validating a prognosting model. Cancer. 2006;107:2523–2524. doi: 10.1002/cncr.22314. [DOI] [PubMed] [Google Scholar]
- 23.Steyerberg EW, Eijkemans MJ, Harrell FE, Habbema JD. Prognostic modeling with logistic regression analysis: in search of a sensible strategy in small data sets. Med Decis Making. 2001;21:45–56. doi: 10.1177/0272989X0102100106. [DOI] [PubMed] [Google Scholar]
- 24.Rashid F, Waraich N, Bhatti I, Saha S, Khan RN, Ahmed J, Leeder PC, Larvin M, Iftikhar SY. A pre-operative elevated neutrophil: lymphocyte ratio does not predict survival from oesophageal cancer resection. World J Surg Oncol. 2010;8:1. doi: 10.1186/1477-7819-8-1. [DOI] [PMC free article] [PubMed] [Google Scholar]
- 25.Hoffmann TK, Dworacki G, Tsukihiro T, Meidenbauer N, Gooding W, Johnson JT, Whiteside TL. Spontaneous apoptosis of circulating T lymphocytes in patients with head and neck cancer and its clinical importance. Clin Cancer Res. 2002;8:2553–2562. [PubMed] [Google Scholar]
- 26.Schmidt H, Bastholt L, Geertsen P, Christensen IJ, Larsen S, Gehl J, von der Maase H. Elevated neutrophil and monocyte counts in peripheral blood are associated with poor survival in patients with metastatic melanoma: a prognostic model. Br J Cancer. 2005;93:273–278. doi: 10.1038/sj.bjc.6602702. [DOI] [PMC free article] [PubMed] [Google Scholar]
- 27.Kusumanto YH, Dam WA, Hospers GA, Meijer C, Mulder NH. Platelets and granulocytes, in particular the neutrophils, form important compartments for circulating vascular endothelial growth factor. Angiogenesis. 2003;6:283–287. doi: 10.1023/B:AGEN.0000029415.62384.ba. [DOI] [PubMed] [Google Scholar]


