

Abstract
Study Objectives:
Chronic sleep restriction is prevalent in the U.S. population and associated with increased morbidity and mortality. The primary reasons for reduced sleep are unknown. Using population data on time use, we sought to identify individual characteristics and behaviors associated with short sleep that could be targeted for intervention programs.
Design:
Analysis of the American Time Use Survey (ATUS).
Setting:
Cross-sectional annual survey conducted by the U.S. Bureau of Labor Statistics.
Participants:
Representative cohort (N = 124,517) of Americans 15 years and older surveyed between 2003 and 2011.
Interventions:
None.
Measurements and Results:
Telephone survey of activities over 24 hours. Relative to all other waking activities, paid work time was the primary waking activity exchanged for sleep. Time spent traveling, which included commuting to/from work, and immediate pre- and post-sleep activities (socializing, grooming, watching TV) were also reciprocally related to sleep duration. With every hour that work or educational training started later in the morning, sleep time increased by approximately 20 minutes. Working multiple jobs was associated with the highest odds for sleeping ≤ 6 hours on weekdays (adjusted OR 1.61, 95% CI 1.44; 1.81). Self-employed respondents were less likely to be short sleepers compared to private sector employees (OR 0.83, 95% CI 0.72; 0.95). Sociodemographic characteristics associated with paid work (age 25-64, male sex, high income, and employment per se) were consistently associated with short sleep.
Conclusions:
U.S. population time use survey findings suggest that interventions to increase sleep time should concentrate on delaying the morning start time of work and educational activities (or making them more flexible), increasing sleep opportunities, and shortening morning and evening commute times. Reducing the need for multiple jobs may increase sleep time, but economic disincentives from working fewer hours will need to be offset. Raising awareness of the importance of sufficient sleep for health and safety may be necessary to positively influence discretionary behaviors that reduce sleep time, including television viewing and morning grooming.
Citation:
Basner M, Spaeth AM, Dinges DF. Sociodemographic characteristics and waking activities and their role in the timing and duration of sleep. SLEEP 2014;37(12):1889-1906.
Keywords: time use, short sleep, sleep deprivation, work, health, sleep time, long sleep, travel, television, mortality, morbidity
INTRODUCTION
Sleep is a biological imperative. Undisturbed sleep of sufficient duration is essential for memory consolidation and for maintaining levels of alertness and cognitive performance required for safe and effective functioning.1,2 Insufficient sleep increases the likelihood of errors and accidents; every year at least 83,000 automobile crashes in the US involve drowsy driving, causing 1,000 fatalities.3 Epidemiologic studies—increasingly prospective in nature—have consistently found that habitual short sleep duration is associated with negative health outcomes, including obesity, diabetes, hypertension, cardio-metabolic risk factors and cardiovascular disease, declines in cognitive function, and all-cause mortality.4–13 Experimental studies have demonstrated that both acute total and chronic partial sleep deprivation in healthy adults causes inadequate pancreatic insulin secretion, decreased insulin sensitivity, changes in appetite regulating hormones leptin and ghrelin, an attenuated immune response to vaccination, and increased sympathetic activity and venous endothelial dysfunction.14–18 These effects provide biological plausibility for a causal relationship between short sleep and negative health outcomes, as well as all-cause mortality when considered with the well-documented safety risks of reduced sleep.19
Despite the apparent benefits of sufficient sleep for cognitive performance, safety, and health, current representative surveys indicate that 35% to 40% of the adult US population report sleeping less than the usually recommended 7-8 hours on weekday nights, and about 15% report sleeping less than 6 hours.20 The high prevalence of habitual short sleep and its association with morbidity and mortality warrant the identification of populations at risk for habitual short sleep as well as the identification of behaviors that predispose to short sleep and that could be targeted in intervention programs.
Although some sociodemographic variables associated with short sleep have been identified,21–23 less is known about specific activities that these at-risk populations trade for sleep, and that could be targeted to increase sleep duration. Furthermore, the importance of the timing of sleep and waking activities in determining whether or not an individual will sleep short hours has not received enough attention. Intervention programs and educational campaigns can only be successful if they target the right behavior, at the right time of day, and in the right population. Time use surveys provide these crucial insights that cannot be derived from experimental or epidemiological studies. In the American Time Use Survey (ATUS) respondents report their activities (including sleep) on a minute-by-minute basis during a 24-hour period.24 For the analyses presented here we facilitated ATUS data gathered between the years 2003 and 2011 in a representative sample of 124,517 Americans aged 15 years and older.
Our analyses had three main objectives: (1) Determine the strength of the association of demographic, family structure, and socioeconomic variables as well as of variables related to geographical location and time of survey administration with short and long sleep. To our knowledge, ATUS is the largest representative dataset to date that allows exploration of these associations. (2) Identify waking activities predominantly exchanged for less or more sleep, and whether this exchange is stable across demographic, family structure, and socioeconomic strata. Although waking activities predominantly exchanged for sleep have been previously identified in a much smaller sample by our group,25 to our knowledge, this is the first time that comprehensive stratified analyses are presented. (3) Investigate the role of the timing of selected waking activities in short and long sleep. Activities predominantly exchanged for sleep (work, travel, socializing and communicating, grooming) and watching TV were chosen for this analysis. To our knowledge, this is the first comprehensive study addressing the timing of waking activities and sleep duration which will be critical information when attempting to modify sleep duration in intervention programs.
METHODS
ATUS Survey
ATUS is a federally administered, continuous survey on time use in the United States sponsored by the Bureau of Labor Statistics (BLS) and conducted by the U.S. Census Bureau. ATUS covers all residents living in U.S. households who are at least 15 years of age, with the exception of active military personnel and people residing in institutions such as nursing homes and prisons. The major purpose of ATUS is to develop nationally representative estimates of how people spend their time. It involves a 15- to 20-min computer-assisted telephone interview in which people are asked about how they spent their time between 04:00 on the previous day and 04:00 on the interview day (e.g., when interviewed on Monday and asked about Sunday, responses cover the period from Sunday morning 04:00 until Monday morning 04:00), as well as where they were, and whom they were with during this time. Section 9 of Title 13, United States Code, ensures that all respondent and household information obtained via ATUS remains confidential. The ATUS advance letter also advises designated persons that this is a voluntary survey. The U.S. Office of Management and Budget (OMB) approved the survey.
ATUS participants are randomly selected from a subset of the households that complete their eighth and final month interviews for the Current Population Survey (CPS). ATUS involves a stratified, 3-stage sample. In the first stage of selection, the CPS over-sample in less-populous states is reduced. In the second stage, households are stratified based on the following characteristics: race/ethnicity of the householder, presence and age of children, and number of adults in adults-only households. In the third stage, an eligible person from each household selected in the second stage is randomly selected to be the designated person for the ATUS interview. To ensure good measures of time spent on weekdays and weekend days, the sample is split evenly between weekdays and weekend days (10% of the sample is allocated to each weekday, and 25% to each weekend day). Most of the sociodemographic and family structure information is updated during the ATUS interview and otherwise available from the CPS. The 2003 sample size of N = 20,720 was reduced to an average sample size of N = 12,975 (range N = 12,248 to N = 13,973) in subsequent years due to budget constraints. ATUS response rates averaged 55.8% across survey years (range 52.5% to 57.8%). A survey conducted by the Bureau of Labor Statistics (BLS) and the Census Bureau in early 2004 analyzing responses and reviewing operations data indicated that the primary reason for refusal is survey fatigue: the designated persons are tired of participating in the CPS survey and do not want to respond to another survey. To account for missing data, the BLS uses several imputation strategies (relational imputation, longitudinal assignment, hot-deck allocation). Most ATUS variables had an item non-response of well under 2%, with the exception of information on earnings (see Table 2). Details on ATUS survey history, survey design, data collection procedures, coding, imputation, and weighting can be found in the ATUS User's Guide.24
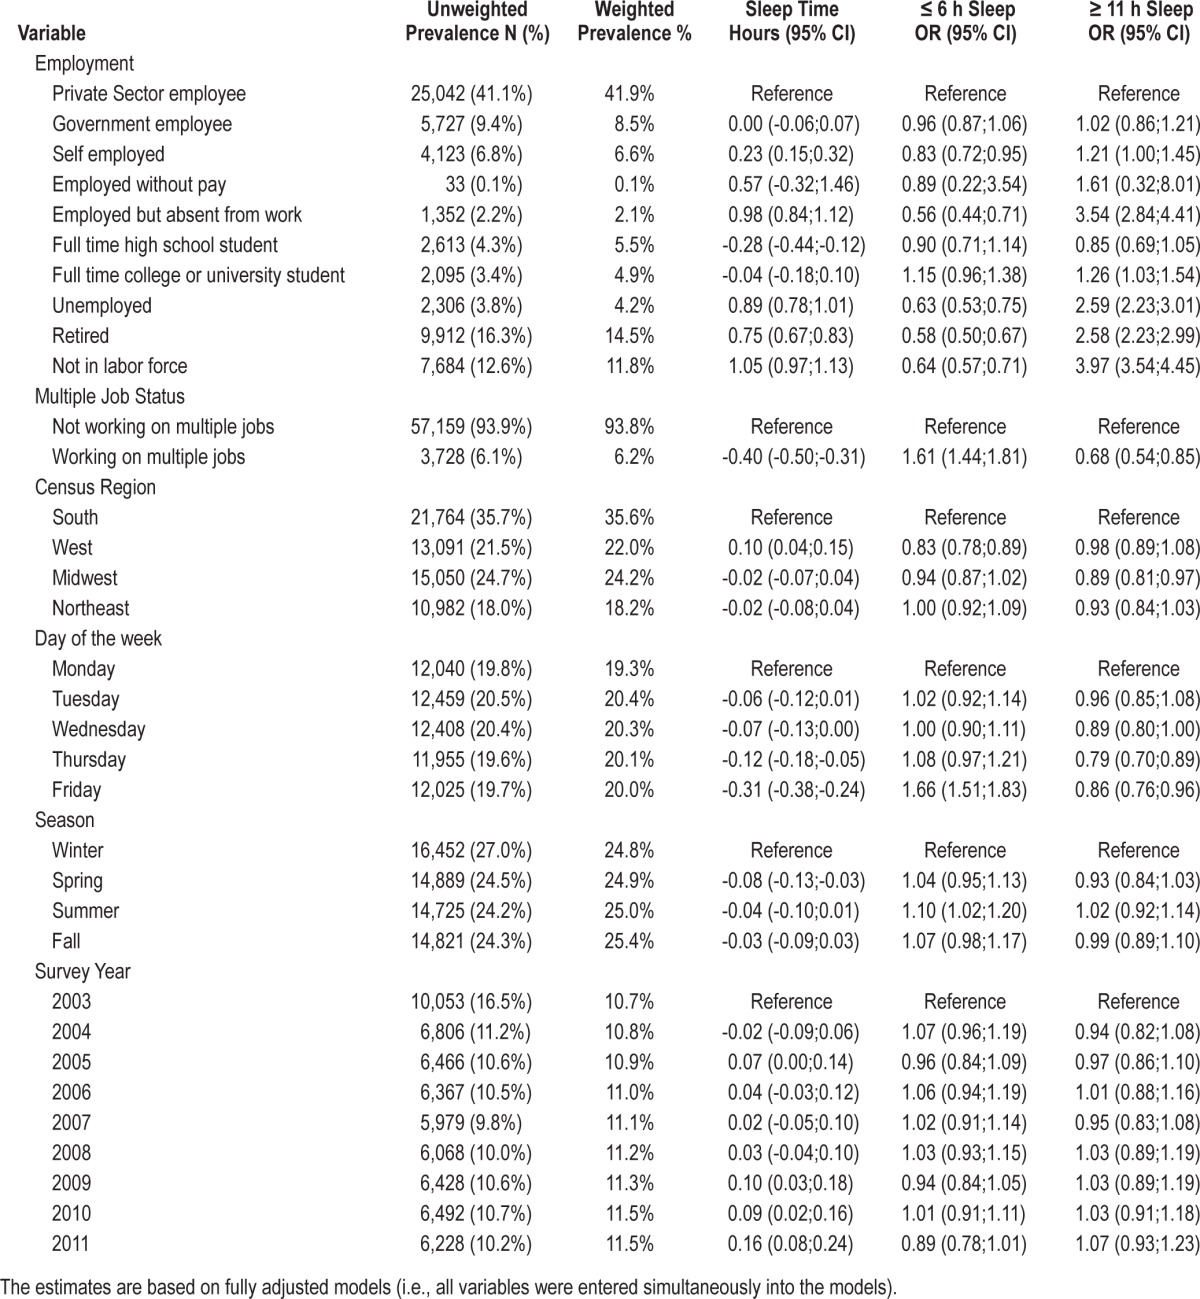
Table 2.
Moderators of sleep time, short sleep duration, and long sleep duration on weekdays (N = 60,887).

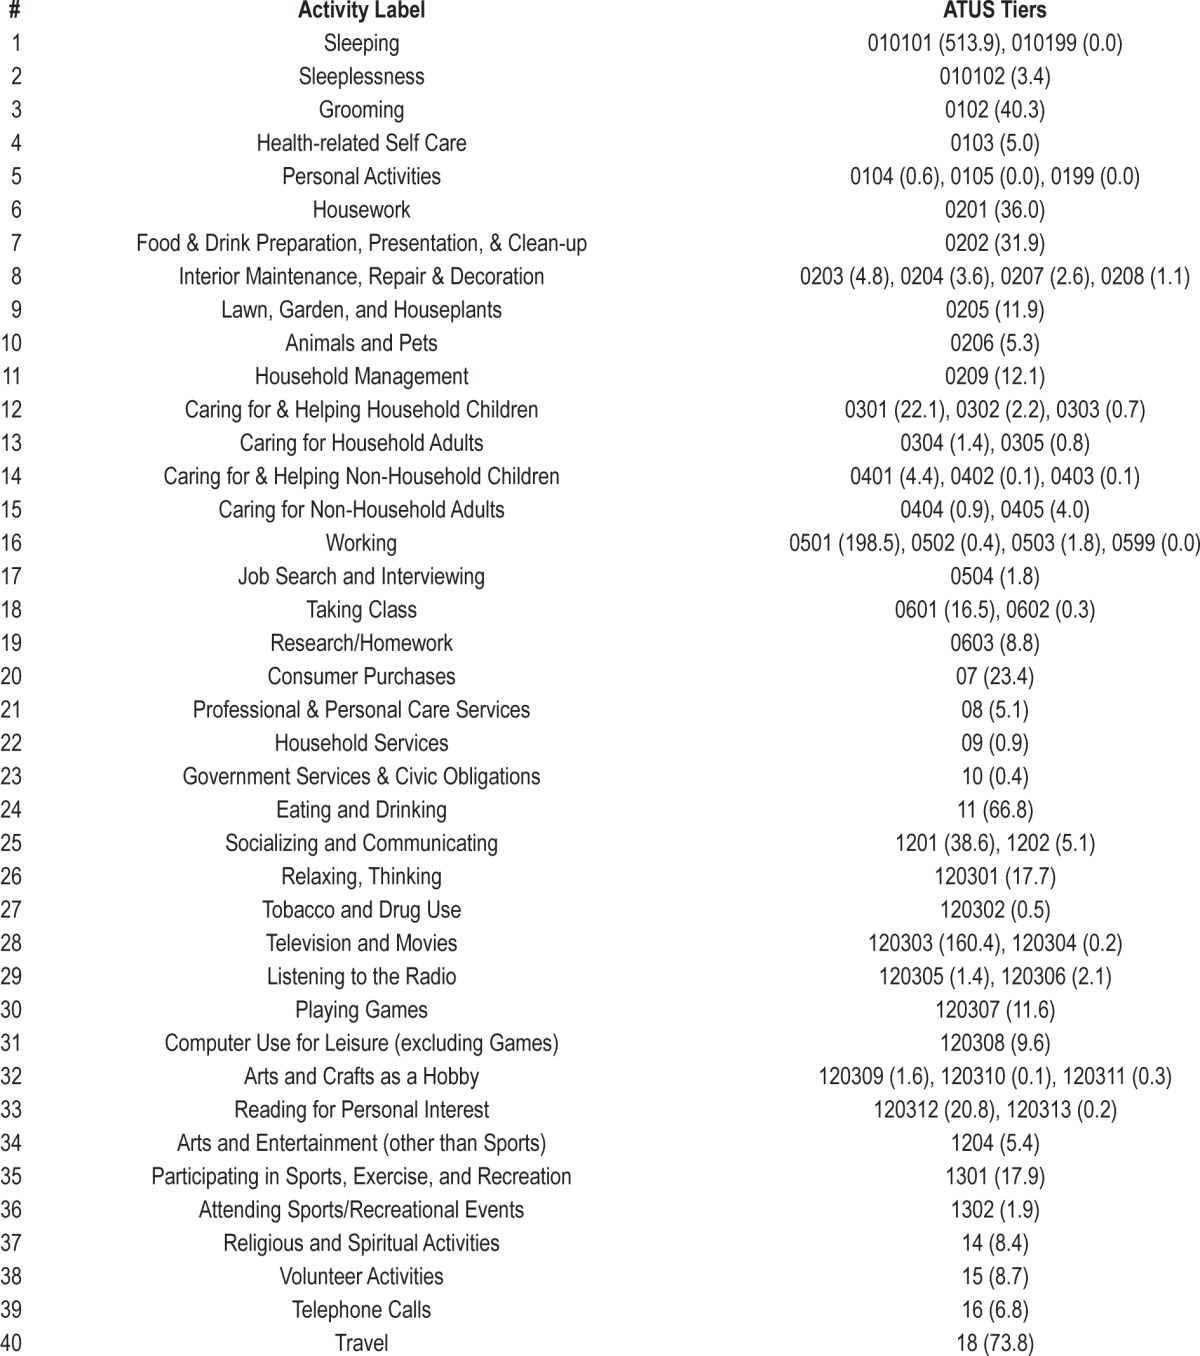
The analyses presented in this manuscript are based on 124,517 respondents from survey years 2003-2011. We used the combined 2003-2011 dataset provided online at http://www.bls.gov/tus by the BLS for analysis purposes. These data are coded based on the 2003-2011 ATUS Coding Lexicon (http://www.bls.gov/tus/lexiconnoex0311.pdf). Responses are coded using a 3-tiered activity classification system, with 17 major, or first-tier, categories, each having 2 additional levels (tiers) of detail. By combining activities at first-, second-, or third-tier level, we generated 40 distinct activities that captured 99.1% of the 24-h day (Table 1).
Table 1.
Activity labels and ATUS tiers for 40 activity categories. Average time (in minutes) spent in each activity is provided for each tier in parenthesis.
Data Analysis
For all analyses presented in this manuscript, ATUS weights and replicate weights were used in SAS (version 9.3, SAS Institute, Carey, NC) to calculate representative estimates. Weights are provided by the BLS to account for the complex survey design and for calculating estimates that correct for oversampling and differing response rates for certain demographic groups and days of the week. For all analyses presented in this manuscript, these weights (variable TUFNWGTP) were used in the procedures SURVEYFREQ, SURVEYMEANS, SURVEYREG, or SURVEYLOGISTIC (SAS 9.3, SAS Institute, Carey, NC) to calculate estimates representative for the U.S. population ≥ 15 years. Facilitating the 160 replicate weights provided by the BLS, SAS's balanced repeated replication method was used for variance estimations. Standard error estimates were multiplied by 2 to reflect the specific calculation of ATUS weights (the ATUS variance formula includes a factor of 4).
ATUS sleep time estimates are not directly comparable with those derived in epidemiologic studies where respondents are usually asked how much sleep they get on an average weekday/ workday or weekend night.25 In ATUS, the following examples are provided in the coding lexicon for the sleep category (coded as tier 010101): sleeping, falling asleep, dozing off, napping, getting up, waking up, dreaming, catnapping, getting some shut eye, dozing. Some of these examples describe rest or transitions in or out of sleep rather than sleep itself. Also, the ATUS sleep category covers 24-h sleep, not nighttime sleep or, in case of subjects working the night shift, the dominant sleep period. Thus, ATUS sleep time estimates are not directly comparable with (and likely overestimate) sleep time estimates from epidemiologic studies, which themselves have been shown to overestimate physiological sleep.26,27 A comparison of ATUS sleep time estimates with self-reported sleep time data for weekdays/ workdays from the 2005-2008 National Health and Nutrition Examination Survey (NHANES)20 indicates that ATUS sleep time overestimates self-reported sleep time by approximately 1 h on average. Importantly, a category “sleeplessness” (see category 2 in Table 1) does exist, and thus trying but not being able to fall asleep is not counted as sleep.
For the logistic regression models, short (≤ 6 h), normal (> 6 h and < 11 h), and long sleepers (≥ 11 h) were defined based on the weighted distribution of sleep times in the ATUS sample. The 3 groups represented 10.6% (short sleep), 78.4% (normal sleep), and 11.0% (long sleep), respectively. In agreement with suggestions of Bin et al.,28 we chose this distribution-based approach rather than using more common definitions for long sleep. Had we defined long sleep as ≥ 9 h, 34.6% of the population would have been represented in this group, which does not qualify as “not normal.”
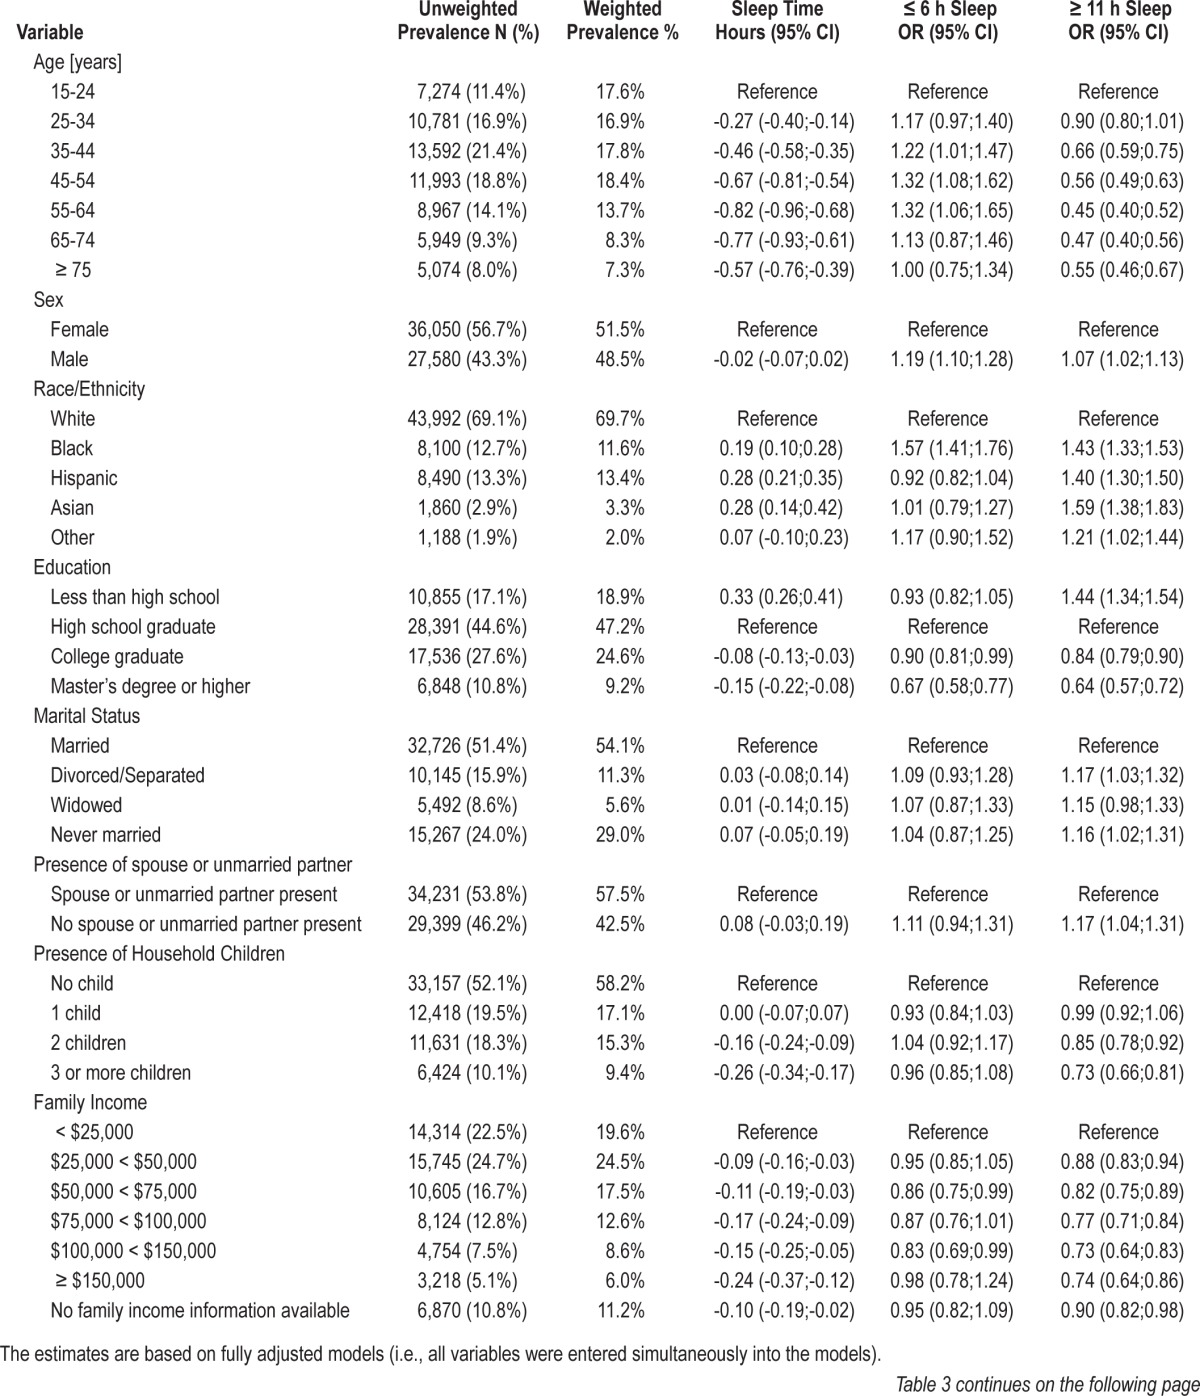
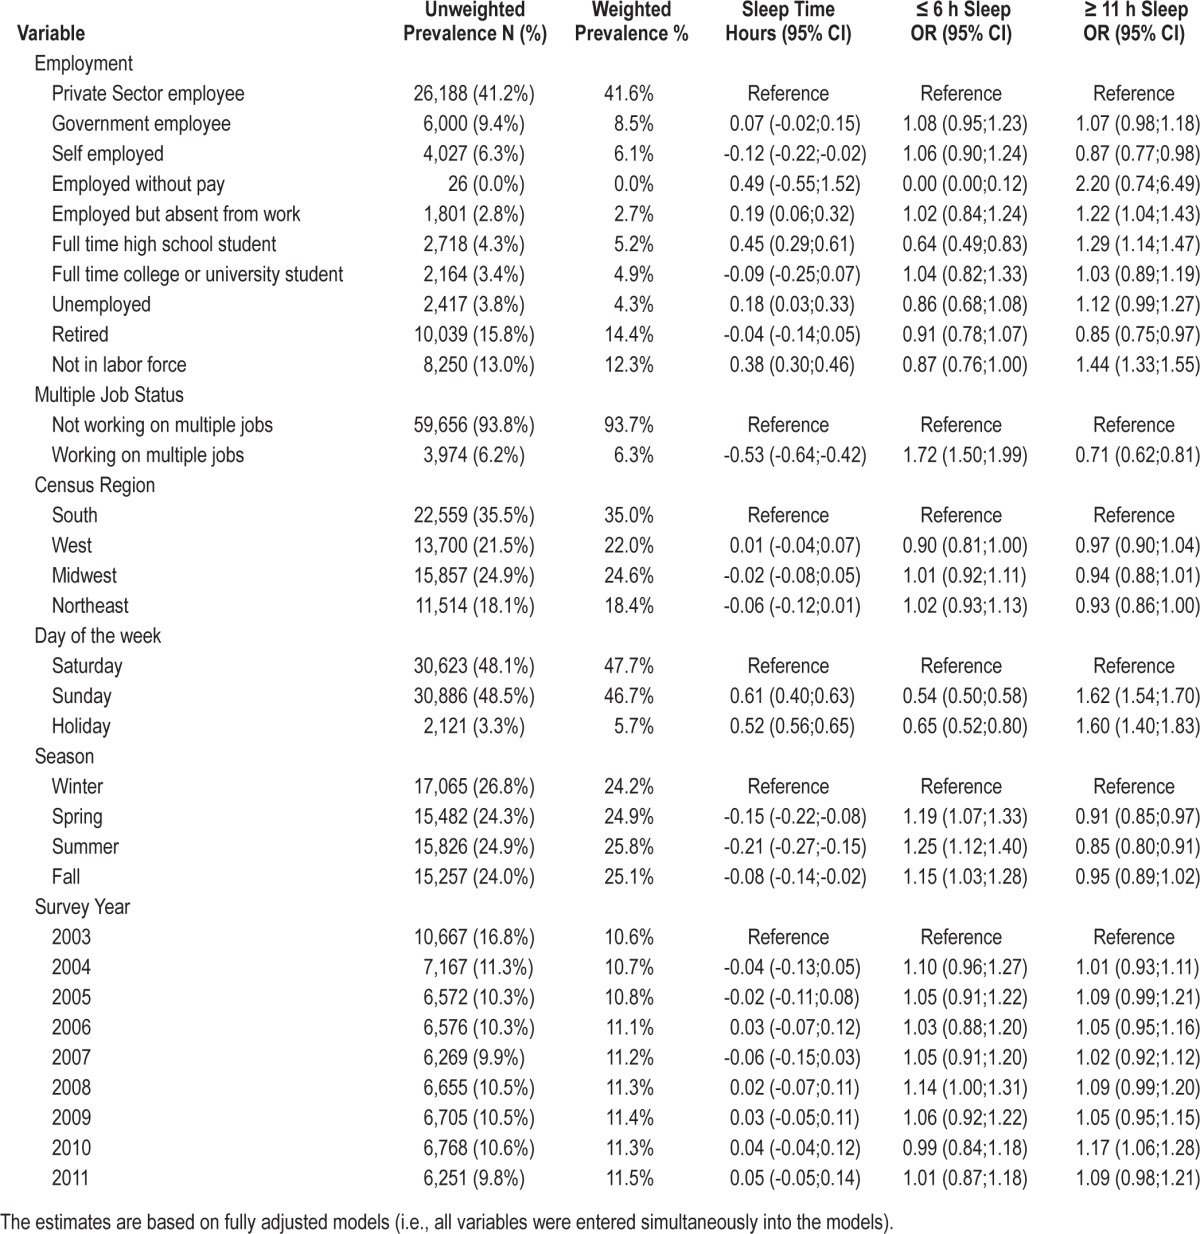
We ran linear and logistic regression models to calculate average sleep time and odds ratios for being a short or long sleeper for sociodemographic variables (age, sex, race/ethnicity, educational attainment, marital status, presence of spouse and household children, family income, employment status, and multiple job status) and variables related to survey region and time (census region, day of the week, season, and survey year). To account for nonlinear relationships, all variables were entered categorically into the model. The category with the highest weighted prevalence was chosen as the reference category. If weighted prevalences were similar across categories, the category representing the lowest value was chosen as reference (e.g., age 15-24 years). Fully adjusted model (Tables 2 and 3) and unadjusted model (Table S1, supplemental material) results are provided.
Table 3.
Moderators of sleep time, short sleep duration, and long sleep duration on weekends and holidays (N = 63,630).
We were also interested in whether associations with short and long sleep in one sociodemographic category (e.g., age 15-24 years) were consistent across other sociodemographic categories (e.g., 15- to 24-year-old males, 15- to 24-year-old females, 15- to 24-year-old whites, 15- to 24-year-old blacks). For each combination of sociodemographic categories that contained ≥ 200 respondents in the overall survey, logistic regression models, adjusted for census region, day of the week, season, and survey year, were run with short or long sleep as outcome variables and an indicator variable set to 0 or 1 (1 = respondents who fall into both sociodemographic categories, 0 = for all others). The results are presented in Figure 2 for short sleep on weekdays and Figures S3–S5 (supplemental material) for short sleep on weekends/holidays and long sleep.
Figure 2.

LogOdds for being a short sleeper (≤ 6 h) on weekdays are given for combinations of sociodemographic categories. Each cell represents a combination of 2 categories (e.g., being 15-24 years old and white). These two categories are then contrasted to all other respondents not belonging two both categories (e.g., all non-whites ≥ 25 years). The colors code for the logOdds of being a short sleeper: logOdds < 0 (green colors) reflect a lower odds for short sleep and logOdds > 0 (red colors) reflect a higher odds for short sleep for respondents belonging to both categories compared to those who do not. All models have been adjusted for census region, day of the week, season, and survey year. Models were not run for category combinations that contained < 200 respondents in the overall survey (white cells).
To investigate the role of the timing of sleep and waking activities in short and long sleep, the 24-h day was divided into 48 thirty-min periods (00:00-00:29, 00:30-00:59, etc.). For each of the sociodemographic and survey region/time categories and for each of the 48 thirty-min periods, separate linear regression models were run with an indicator variable set to 1 if a respondent belonged to a specific stratum (e.g., age 15-24 years) and set to 0 otherwise (e.g., age ≥ 25 years). This way, respondents belonging to one stratum of a given characteristic (e.g., age, sex, race/ethnicity) were contrasted to the remaining respondents in all other strata of the characteristic. The difference in time spent sleeping within a given 30-min period was color-coded, and the results are presented in Figure 1 for week-days and Figure S1 (supplemental material) for weekends/holidays. Furthermore, for each of the 48 periods, separate linear regression models were run with time spent sleeping and in 5 waking activities often exchanged for sleep (work, travel, socializing, grooming, and watching TV) as the outcome variables and short and long sleep as the only predictor variables. The results are shown in Figure 3.
Figure 1.

Sleep lost or gained by time of day on weekdays for several sociodemographic categories (N = 60,887). Each cell represents a 30-min time window and the amount of sleep lost or gained compared to all other respondents within a given category. The color indicates the amount of sleep lost (red) or gained (green). For example, 15- to 24-year-old respondents slept 3.3 min less than ≥ 25-year-old respondents in the 0:00-0:29 time window on weekdays. The numbers in the column labeled “Min” show how many minutes of sleep are lost or gained per 24 h compared to all other respondents within a given category. All analyses are based on unadjusted linear regression models (i.e., separate models were run for each category).
Figure 3.

Minutes spent sleeping, working, traveling, socializing and communicating, grooming, and watching TV are compared between short, normal, and long sleepers for 48 thirty-minute periods on both weekdays and weekends/holidays (unadjusted models).
To identify waking activities predominantly exchanged for more or less sleep in short and long sleepers compared to normal sleepers, linear regression models, adjusting for age, gender, and race/ethnicity, with indicator variables for short and long sleep were run for each of the waking activities defined in Table 1. The waking activities were then sorted in descending order by excess activity time in short sleepers. The results are presented in Figure 4 for weekdays and Figure S6 (supplemental material) for weekends/holidays. A stratified analysis was performed to investigate whether these findings generalize to individual sociodemographic and survey region/ time strata (e.g., for respondents 15 to 24 years old). For each stratum (e.g., 15-24 year old) and each of the 39 waking activities defined in Table 1, a separate linear regression model with indicator variables for short and long sleep as the only predictors was run. These results are presented in Figure 5 for short sleep on weekdays and Figures S7–S9 (supplemental material) for short sleep on weekends/holidays and long sleep.
Figure 4.

Average time (± 95% confidence interval) that short sleepers (≤ 6 h) and long sleepers (≥ 11 h) spent more or less in waking activities relative to normal sleepers (> 6 h and < 11 h) on weekdays (N = 60,887). Categories are listed in descending order based on short sleepers. For each activity, a linear regression model adjusting for age, gender, and race/ethnicity was run.
Figure 5.

Waking activities that short sleepers (≤ 6 h) spend more time on compared to normal sleepers (> 6 h and < 11 h) across sociodemographic categories and on weekdays. Rank #1 is the activity with the largest increase in time. Activities are coded with the numbers from Table 1. Six waking activities are color coded instead. For each stratum (e.g., 15 to 24 years old) and each of the 39 waking activities defined in Table 1 a separate linear regression model with indicator variables for short and long sleep as the only predictors was run.
To investigate the effect of work and school start times on sleep duration, we identified work and school start times between 04:00 and 10:00 in those who reported working and between 04:00 and 11:00 in those who reported taking class. If a respondent reported both activities, the activity with the earlier start time was identified and the subject was only included in the analysis for this activity. Two separate linear regressions were performed to estimate sleep time based on 5 work start time categories (≤ 06:00, N = 6,294; 06:00-07:00, N = 7,401; 07:00-08:00, N = 10,743, reference; 08:00-09:00, N = 7,504, 09:00-10:00, N = 3,315) and on 5 school start time categories (≤ 07:00, N = 298; 07:00-08:00, N = 1,557, reference; 08:00-09:00, N = 807; 09:00-10:00, N = 512, 10:00-11:00, N = 204). The findings are presented in Figure 6. These analyses were repeated stratifying by 3 age categories (work start time) or by full-time high school student and full-time university student (school start time, Figure S10, supplemental material). Finally, for each survey year, we calculated unadjusted averages for the unemployment rate (Figure S2, supplemental material), the time spent sleeping per 24 h and the time spent working per 24 h, and performed a Pearson correlation between the sleep and work time in all respondents as well as in only employed respondents (Figure S11, supplemental material).
Figure 6.
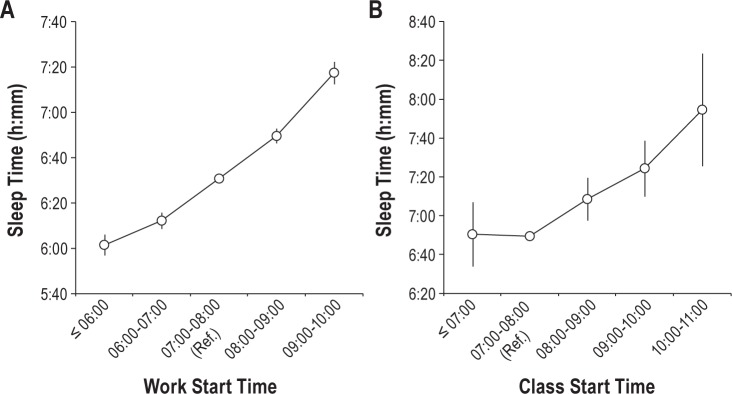
The effect of work start time (left panel, N = 35,257) and class start time (right panel, N = 3,378) on average sleep time. Errors bars represent 95% confidence intervals.
RESULTS
Duration and Timing of Sleep
Results regarding the duration and timing of sleep can be found in Tables 2 and 3 (fully adjusted models for weekdays and weekends/holidays) and Table S1 (unadjusted models), as well as in Figures 1, 2, S1, and S3–S5.
Age
In general, 15-24 year old respondents obtained the most sleep per 24 h compared to older subjects (42.5 additional min on weekdays and 56.0 additional min on weekends/holidays). Although 15-24 year old respondents went to bed considerably later than older subjects (individuals > 24 years), they slept significantly more from 06:00 to 12:00 (Figures 1 and S1). The 15-24 age bracket is a period associated with relevant changes both biologically (e.g., sleep drive, continued maturation of the prefrontal cortex29) and socially (e.g., first employment). Figure S12 (supplemental material) shows a massive change in the prevalence of being a student or being employed across this 10-year period. The prevalence of employment exceeded that of being a full-time student from age 21 onward. However, average sleep time was similar for both groups independent of age (Figure S12B). In contrast, average sleep time was more than one hour longer in those who did not work or attend school/college/university (Figure S12B).
With increasing age, bedtime gradually shifted to earlier times, especially on weekends/holidays (Figures 1 and S1). Respondents in the 35-64 year age bracket exhibited the lowest amount of 24 h sleep and were at significantly increased odds for being short sleepers; this was due to less sleep in early hours of the morning (05:00 to 08:00) compared to both younger and older respondents. Surprisingly, ≥ 75-year-old respondents obtained the most sleep per 24 h on weekdays (Table 2). Most of this extra sleep was acquired during the early morning hours (06:00 to 09:00) and through afternoon naps, which only became noticeable in this age bracket (Figures 1 and S1). The difference between weekday and weekend/holiday 24-h sleep time decreased substantially with age.
Sex
On average and across the whole age range, males slept 9.1 min and 3.0 min less than females on weekdays and weekends/holidays, and were more likely to be short sleepers and long sleepers (Tables 2 and 3). Males lost most of this sleep by getting up earlier in the morning, especially on weekdays (Figures 1 and S1).
Race/Ethnicity
Black, Hispanic, and Asian respondents slept on average significantly longer than white respondents and were also significantly more likely to be long sleepers (Tables 2 and 3). Only black respondents were also more likely to be short sleepers than white respondents, while Hispanic and Asian respondents were less likely to be short sleepers, indicating some degree of heterogeneity in black respondents. Hispanic respondents tended to exhibit an earlier bedtime than other ethnic groups. In comparison to white respondents, other races/ethnicities spent more time sleeping during the morning and daytime, especially on weekends/holidays.
Education
Sleep duration was negatively correlated with educational attainment, with college graduates or those with a higher degree obtaining on average significantly less sleep than high school graduates on both weekdays and weekends/holidays (Tables 2 and 3). However, higher educational attainment was also associated with lower odds of being a short or long sleeper, suggesting less variability in sleep duration in those with higher education compared to high school graduates. Individuals with higher education slept less in early morning hours (Figures 1 and S1). In contrast, respondents with less than a high school degree slept significantly longer than those with high school degree, were less likely to be a short sleeper and more likely to be a long sleeper (Tables 2 and 3). This increased sleep duration occurred during morning and evening hours (Figures 1 and S1).
Family Structure
Divorced/separated, widowed, or never married respondents did not differ significantly from married respondents in terms of average sleep duration. However, widowed subjects were significantly more likely to be short sleepers on weekdays, while those never married were more likely to be long sleepers on both weekdays and weekends/holidays compared to married respondents (Tables 2 and 3). Married respondents obtained less sleep during the morning but more sleep during the late evening until about 03:00, especially compared to those never married (Figures 1 and S1).
Although average sleep time did not differ between interview days whether a spouse or unmarried partner was present or not, respondents without a partner present were more likely to be long sleepers on both weekdays and weekends/holidays (Tables 2 and 3). Respondents without a partner were less likely to report sleeping between 21:00 and 03:00 and more likely to report sleeping during the morning (Figures 1 and S1).
Respondents with ≥ 2 household children obtained less sleep and were significantly less likely to be long sleepers than childless respondents on both weekdays and weekends/holidays (Tables 2 and 3). Respondents with ≥ 3 children were significantly more likely to be short sleepers on weekdays than those without children (Table 2). Respondents with ≥ 2 children went to bed earlier compared to those with 1 child or without children, but were more likely to be awake in the early morning (Figures 1 and S1).
Family Income
Family income and sleep duration were negatively correlated, and the odds of being a short sleeper increased while the odds of being a long sleeper decreased with increasing family income, the former on weekdays only (Tables 2 and 3). During weekdays, respondents in the higher income categories were less likely to sleep in the morning between 06:00 and 10:00 and also in the evening between 21:00 and 23:00 compared to the lower income categories. Those in the lowest income category (< $25,000) were more likely to obtain sleep during the day compared to those making $25,000 or more (Figures 1 and S1).
Employment
Private sector employees represented the largest group of respondents (weighted prevalence 41.9%). Sleep time and the odds of being a short or long sleeper did not differ between private sector and government employees on both weekdays and weekends/holidays (Tables 2 and 3). In contrast, self-employed respondents obtained significantly more sleep, had significantly lower odds of being a short sleeper and also higher odds of being a long sleeper compared to private sector employees on weekdays (Table 2). Interestingly, this pattern was reversed on weekends/holidays (Table 3). Self-employed respondents were more likely to sleep between 04:00 and 07:00 on weekdays and less likely to sleep between 07:00 and 11:00 on weekends/holidays compared to the other respondents (Figures 1 and S1). On weekdays, self-employed respondents woke up 19.3 min (95% CI 12.5-26.1 min) later in the morning compared to government and private sector employees. Relative to private sector employees, full-time high school students obtained significantly less sleep (−0.28 h) on weekdays, but obtained significantly more sleep (+0.45 h) on weekends/holidays (Tables 2 and 3). Full-time high school students were more likely to sleep during morning hours, particularly on weekends/holidays (Figures 1 and S1). Full-time college or university students were more likely to be long sleepers on weekdays, but did otherwise not differ from private sector employees (Tables 2 and 3). Compared to all other respondents, college/university students were more likely to sleep between 04:00 and 12:00 and less likely to sleep between 21:00 and 02:00 on weekdays (Figure 1). Those employed but absent from work obtained almost 1 additional hour of sleep, were significantly less likely to be short sleepers, and more likely to be long sleepers on weekdays (Table 2). Compared to all other respondents, employed individuals absent from work were more likely to sleep between 05:00 and 09:00 on weekdays (Figure 1). Respondents who were unemployed, retired, or not in the labor force obtained significantly more sleep, were less likely to be short sleepers, more likely to be long sleepers (Table 2), and also more likely to sleep during morning hours on weekdays (Figure 1). On weekends/holidays, retired respondents did not differ from private sector employees in sleep duration, but retirees were less likely to be long sleepers (Table 3) and were less likely to sleep in the morning compared to the other respondents (Figure S1). Relative to those not working multiple jobs, those who did obtained significantly less sleep, were more likely to be short sleepers, and less likely to be long sleepers on both weekdays and weekends/holidays (Tables 2 and 3). Individuals working multiple jobs were less likely to sleep during late evening and early morning hours compared to all other respondents (Figures 1 and S1).
Survey Time and Location
Respondents in the western census region averaged the longest sleep time and were significantly less likely to be short sleepers on weekdays only than respondents in the southern census region, who represented 35.6% of the US population (and was thus chosen as the reference region). Respondents in the western census region were more likely to obtain sleep during late evening hours relative to all other respondents on weekdays and weekends/holidays (Figures 1 and S1).
There was a trend of decreasing sleep time during the work week and sleep time averaged 0.31 h less on Fridays compared to Mondays (Table 2). On Friday sleep was lower from 22:00 to 01:00 than on other days of the week (Figure 1). On weekends, subjects slept on average 0.61 h longer on Sundays than Saturdays, primarily due to increased sleep from 21:00 to 02:00 (Table 3, Figure S1).
Seasonal differences in average sleep time amounted to < 5 min on weekdays but were more pronounced on weekends/holidays, with significantly more sleep obtained during the winter months compared to the other months (Table 3). In the summer, sleep time was reduced during late evening hours (Figures 1 and S1).
The maximal difference in average sleep time between survey years was relatively small (11 min). However, average sleep time on weekdays was significantly longer during years 2009-2011 compared to 2003 (Table 2). In-depth analyses showed that unemployment rates were highest in years 2009-2011 (Figure S2), and that there was a significant negative correlation between average sleep time and average work time across survey years (Figure S11; Pearson rho = −0.77, P = 0.0147). If this analysis was restricted to employed respondents, the strength of this correlation decreased and was no longer statistically significant (Pearson rho = −0.21, P = 0.5930).
Stratified Analyses
In stratified analyses we investigated whether the odds of being a short or long sleeper generalized across a wide range of sociodemographic categories, or whether they were driven by specific combinations of sociodemographic characteristics. The characteristics most consistently associated with short sleep on both weekdays and weekends/holidays across sociodemographic strata were working multiple jobs and those in the black or “other race/ethnicity” category (Figures 2 and S3). Black respondents or those in the “other race/ethnicity” category were also consistently more likely to be long sleepers on weekdays and weekends/holidays, whereas respondents working multiple jobs were consistently less likely to be long sleepers (Figures S4 and S5). Weekends/holidays were associated with consistently higher odds for long sleep in 15- to 24-year olds, those with less than a high school degree, those never married or with no spouse or partner present, and full time high school students.
Sleep Time and Waking Activities
Relative to normal sleepers, short sleepers spent less time sleeping from 21:00 to 09:00, while long sleepers added sleep time by retiring earlier in the evening, getting up later in the morning, and sleeping more during the day (Figure 3).
We analyzed which waking activities were predominantly exchanged for less (short sleepers) or more sleep (long sleepers) compared to normal duration sleepers (> 6 h and < 11 h). The predominant activity exchanged for less sleep was work, on both weekdays and weekends/holidays (Figures 4 and S6), and across practically all sociodemographic categories (Figures 5 and S7-S9). In depth analyses showed that, compared to normal sleepers, short sleepers worked more hours, started working earlier, and stopped working later, while long sleepers worked significantly less during the day than normal sleepers (Figure 3). As time spent working had such a profound impact on sleep duration, we investigated how work start times in the morning affected average sleep time (Figure 6A). Sleep time increased in a linear fashion with later work start times. On average, respondents slept only 6.02 h when starting work before or at 06:00 and slept 7.29 h when starting work between 09:00-10:00. These findings were unaffected by the age of the respondent (Figure S10A). The above analysis was repeated for class start times (Figure 6B); although there was no difference in average sleep time when class start times occurred either before 07:00 or between 07:00 and 08:00 (6.84 h vs. 6.82 h, P = 0.908), average sleep time increased in a linear fashion for class start times after 08:00. Stratified analyses showed that college/university students averaged shorter sleep times for class start time before 08:00 compared to high school students, but that both groups did not differ for class start times after 08:00 (Figure S10B).
In terms of waking activities exchanged for less sleep, working was closely followed by travel time. Short sleepers traveled more, started traveling earlier in the morning, and stopped later in the evening (Figure 3) than normal sleepers. Among short and normal sleepers, the biphasic pattern during weekdays with peaks at 07:00 and 17:00 strongly suggests that the majority of travel time is associated with commuting to and from work or school. Long sleepers did not show this biphasic pattern and spent less time traveling in general. Other waking activities consistently exchanged for less sleep were socializing and communicating, sleeplessness, and grooming. Compared to normal sleepers, short sleepers spent more time socializing, particularly during late evening and early nighttime hours, whereas long sleepers were less likely to socialize during late afternoon and evening hours on weekends/holidays. Short sleepers spent more time grooming and started grooming earlier in the morning compared to normal sleepers during the week and on weekends/holidays, whereas long sleepers started grooming much later in the morning and overall spent less time in this activity.
The role of watching TV in short and long sleep was less straightforward, as both short and long sleepers watched more TV than normal sleepers. Compared to when normal sleepers watched TV, long sleepers were more likely to watch during the day (09:00 to 20:00) and less likely to watch during late evening hours, whereas short sleepers were less likely to watch during the day, but more likely during times usually spent sleeping (22:00 to 09:00). Importantly, the extent to which watching TV was exchanged for less sleep varied greatly depending on sociodemographic characteristics. It was more likely in those ≥ 45 years (Figure S13, supplemental material), in females, in black respondents, in those with lower educational attainment, in respondents without a partner, in those with family income < $25,000, and in respondents without work (Figures 5 and S7). Watching videos and movies on a computer, smart phone, or tablet device were all classified as “watching TV or movies” in ATUS, which we simply call “watching TV” throughout this manuscript.
DISCUSSION
Based on a large representative US time use survey, we identified several demographic, family structure, and socioeconomic variables that were associated with short sleep and/or long sleep. Importantly, we also identified waking activities that were exchanged for more or less sleep, and how the timing of sleep and several key waking activities differed between short (< 6 h), normal (≥ 6 h and ≤ 11 h), and long sleepers (> 11 h). Given the high prevalence of chronic partial sleep restriction in the US population and the associated negative consequences for performance, safety, and health, our primary objective was to identify both individual characteristics and behaviors that predispose to short sleep and could thus be targeted in intervention studies.
Overwhelmingly, our analyses point to work as the dominant waking activity that is performed instead of sleep in short sleepers (1.55 h more on weekdays and 1.86 h more on weekends/holidays compared to normal sleepers), while long sleepers spent much less time working compared to normal sleepers (2.66 h less on weekdays and 0.90 h less on weekends/holidays). Working ranked as the primary waking activity that was performed instead of sleep across all sociodemographic strata, with the exception of respondents retired, unemployed, or otherwise not in the labor force. Furthermore, age 25-64 years, male sex, high income, and employment per se (i.e., sociodemographic characteristics usually associated with paid work) were also consistently associated with short sleep. Working multiple jobs was associated with the highest observed odds ratio for being a short sleeper (adjusted OR 1.61 on weekdays and OR 1.72 on weekends/holidays) compared to all other sociodemographic characteristics. The fact that working multiple jobs was associated with high odds for short sleep was true across virtually all sociodemographic strata. The timing of work in short sleepers compared to normal sleepers suggests that short sleepers stop working later at night and start working earlier in the morning, which directly impacts their ability to obtain sufficient amounts of sleep.
The association between long work hours and short sleep has been identified in earlier research.25,30 Knutson et al. found a significant increase in the odds of short sleep between 1975 and 2006 for full-time workers only.31 Our own analyses show that between 2003 and 2011, sleep time and work time were significantly negatively correlated.25 The longest sleep times were observed in the economic crisis years 2009, 2010, and 2011, that were characterized by layoffs and a decrease in average work time. Prior research also suggests that respondents working long hours get up earlier in the morning than those not working or working fewer hours, but that these groups do not differ in bedtime.32 For individuals who need to work long hours, going to bed at an earlier time rather than engaging in other activities (e.g., socializing or watching television) would thus be one way to prolong sleep duration.32
In terms of intervention strategies, it may be difficult to reduce work time in order to increase sleep time. However, making the work start time more flexible may help increase sleep time; even if total time spent working is kept constant. This is supported by our finding that self-employed respondents, who typically experience more flexibility in the placement of their work period, obtained significantly more sleep and were less likely to be short sleepers on weekdays compared to private sector or government employees. On weekends, self-employed respondents slept 0.12 h less than private sector employees and were significantly less likely to be long sleepers. The difference between weekdays and weekends could either be explained by less social jet lag (i.e., the reduced need of self-employed respondents to recuperate sleep lost during the work week on the weekends) or by differences in hours worked (self-employed respondents worked 0.4 h less on weekdays and 0.5 h more on weekends/holidays than private sector employees). A recent prospective study reported that an increase in perceived control over work time was associated with more sleep and lower levels of fatigue and depressive symptoms.33 We also found that, with every hour work or class started later in the morning, sleep time increased by approximately 20 minutes (for class after 08:00 only). Other studies have shown that later class start times may increase students' sleep time, attention, and cognitive performance,34,35 and decrease teen automobile-crash rates,36 although one study in college students showed that taking later classes was associated with increased alcohol consumption and lower academic performance.37 More flexible work (and class) start times may be possible without decreasing work time and productivity, and would also accommodate individuals with late circadian preference who cannot fall asleep early but have to get up before their biological wake time to meet social demands (a condition coined “social jet lag”).38
The finding that respondents working multiple jobs are at increased odds of being a short sleeper is not surprising but still worrisome. Sleep restriction and high workload associated with working multiple jobs are known risk factors for increased levels of fatigue that may not only affect job performance but also affect safety both on the job and during the commute. This is extremely troubling in subjects working jobs that immediately affect other people's lives, like medical doctors (so-called moonlighting39) or bus drivers. Oftentimes, employers do not know about other jobs of their employees, and even if work hour regulations for the primary job are not violated, they would be if the other job were taken into account. The fact that approximately 1 of 10 respondents (9.8%) with employment worked more than one job, presumably to generate sufficient income, is a societal problem. Our data suggest that reducing the number of those who work multiple jobs could have a profound impact on the amount of sleep obtained.
Another mechanism by which work affects sleep duration is the time it takes to commute to and from work. Living far away from work or school necessitates long commutes that may further postpone sleep onset or advance wake-up times. Christian found an average daily commute time of 62 minutes among US working age individuals.40 Assuming 250 work days, a one-hour commute to and from work accumulates to 500 hours (approximately 21 days) annually that could be used to increase time spent sleeping or in other waking activities. Many factors influence the decision where to rent or buy a home, including neighborhood aspects and living expenses. A short commute is a factor that should be valued and considered, as it will likely contribute to decreasing the prevalence of short sleep and thus indirectly improving health. Reliable and fast public transport and less congested highways are also critical for shorter commute times and may reduce the prevalence of short sleep.
Two other waking activities observed more frequently in short sleepers and less frequently in long sleepers were grooming and socializing and communicating. These activities are typically performed late at night or early in the morning and thus directly “compete” with sleep for time. In an analysis that concentrated on 2-hour periods pre and post bed, grooming accounted for 6.5% of the two hours spent before going to bed in the evening and for 20.2% of the two hours after getting out of bed in the morning.32 Although a certain level of body hygiene is important for social and physical well-being, excessive time spent in these activities may reduce sleep time at both ends of the sleep period.
Although it is often assumed that watching TV is the primary waking activity exchanged for less sleep; our results demonstrate that watching TV only ranked in 9th position of the activities exchanged for less sleep in short sleepers. However, watching TV in the pre-bed hours was a very prevalent behavior in short, normal, and long sleepers. We previously found that more than half of the nation watches TV in the 30 minutes prior to individual bedtimes, and 55.6 minutes are spent watching TV in the 2 hours pre-bedtime.32 In the current in-depth analysis, we showed that, although short sleepers only watched an average of 4 minutes more TV than normal sleepers, they started and stopped watching TV much later at night than normal—especially long sleepers. This high prevalence of watching TV late at night in short sleepers suggests that considerable amounts of sleep could be gained by turning the TV off earlier at night. Turning off the TV and other electronic devices may also have the added benefit of reducing exposure to bright light during late evening hours, which has been shown to suppress melatonin excretion and delay melatonin onset, and may even delay circadian phase and thus aggravate social jetlag.41,42
Several studies have shown that black respondents are more likely to report short sleep and sometimes also long sleep than white respondents.9,22,31,43–46 This was corroborated in our study in multivariate analyses adjusted for a host of other demographic, family structure, and socioeconomic variables. In addition, we showed that the high odds for short sleep in black respondents persisted across nearly all other sociodemographic strata. Finally, our analyses also show that black respondents are more heterogeneous than other racial groups. Compared to white respondents, black respondents reported longer average sleep durations and were more likely to be both short sleepers and long sleepers. Future studies are needed in order to identify in detail what characteristics and behaviors predispose black respondents to become short or long sleepers, and to what extent these behaviors are driven by beliefs about the value of sleep.
The finding that weekday sleep time starts to increase again in ≥ 65-year-old respondents is somewhat at odds with the findings of a meta-analysis of quantitative sleep parameters across the human lifespan, which reported continuously decreasing total sleep time with increasing age.47 However, this meta-analysis concentrated on polysomnographically measured sleep during the main sleep period, often recorded in laboratory contexts. Our analyses suggest that once the obligation to arrive at work in the morning is no longer present during retirement, older subjects begin to sleep more, both in the morning and in the afternoon. However, due to the nature of ATUS, it is unclear how much of this time represents real sleep and not merely rest or transitions in or out of sleep. Nevertheless, our data strongly support the concept of social jetlag during the years of employment, and its reversibility during retirement.38
Limitations
The cross-sectional nature of the American Time Use Survey, the average response rate of 55.8%, and the fact that information on secondary activities (performed at the same time as the primary activity) was not collected, are limitations of this study.24 We had no detailed information on the respondents' health status or on the content of some behaviors (e.g., which type and how much alcohol, caffeine, or drugs were consumed) that may act as confounders and influence sleep time. As health status is not measured in ATUS (or the CPS), our analyses cannot directly show whether and how sleep patterns contribute to health disparities. However, our analyses point to several sociodemographic variables associated with short or long sleep that may also be associated with poor health status. As discussed in the methods section, the ATUS definition of sleep includes rest or transitions in or out of sleep, and it covers sleep during a 24-hour period, and not only the dominant sleep period. Thus, ATUS sleep time estimates are not directly comparable with (and likely overestimate) sleep time estimates from epidemiologic studies and physiological sleep. Finally, the findings reflect associations, and therefore the effectiveness of intervention strategies addressing specific behaviors in the identified risk groups still needs to be demonstrated.
CONCLUSIONS
In a large representative sample of Americans 15 years and older we identified sociodemographic characteristics and behaviors associated with short and long sleep time. Our findings suggest that interventions to increase sleep time should concentrate on postponing work and class start times (or making them more flexible), on reducing the prevalence of multiple jobs, and on shortening morning and evening commute times. Although some factors that determine whether somebody is not getting enough sleep on a chronic basis are driven externally and thus out of the control of the individual, others—like watching TV late at night or spending prolonged periods of time in the bathroom grooming each morning—are not (or to a much lesser degree). Raising awareness for the importance of sufficient sleep for health and safety may be necessary to reduce the prevalence of short sleep, especially since experiments manipulating sleep duration have shown that subjects adapt quickly to feeling sleepy early during chronic sleep restriction, even though cognitive performance continuous to decline.48 At the same time, public health messages about the importance of ensuring adequate sleep should recognize natural biological variation in sleep need.
DISCLOSURE STATEMENT
This was not an industry supported study. Support for this study was provided by NIH NR004281 and by the National Space Biomedical Research Institute through NASA NCC 9-58. The work was performed at the Division of Sleep and Chronobiology, Department of Psychiatry, University of Pennsylvania, Perelman School of Medicine, Philadelphia, PA. Dr. Dinges is compensated for serving on a scientific advisory council for Mars, Inc. and is compensated by the Associated Professional Sleep Societies, LLC, for serving as Editor in Chief of SLEEP. Dr. Basner is a Deputy Editor for SLEEP. Dr. Basner and Dr. Dinges recuse themselves from all decisions related to SLEEP manuscripts on which they have a conflict of interest. Drs. Basner and Spaeth have indicated no financial conflicts of interest.
ACKNOWLEDGMENTS
Supported by NIH NR004281 and by the National Space Biomedical Research Institute through NASA NCC 9-58. The American Time Use Survey was sponsored by the Bureau of Labor Statistics and conducted by the U.S. Census Bureau.
Footnotes
A commentary on this article appears in this issue on page 1879.
SUPPLEMENTAL MATERIAL
Unadjusted models: Moderators of sleep time, short sleep duration, and long sleep duration on weekdays (N = 60,887) and weekends/holidays (N = 63,630). Separate models were run for each category.
Sleep lost or gained by time of day on weekends and holidays for several sociodemographic categories (N = 63,630). Each cell represents a 30-min time window and the amount of sleep lost or gained compared to all other respondents within a given category. The color indicates the amount of sleep lost (red) or gained (green). For example, 15- to 24-year-old respondents slept > 4 minutes less than ≥ 25-year-old respondents in the 0:00-0:29 time window on weekends/holidays. The numbers in the column labeled “Min” show how many minutes of sleep are lost or gained per 24 h compared to all other respondents within a given category. All analyses are based on unadjusted linear regression models (i.e., separate models were run for each category).
Unemployment rates for the survey years 2003 to 2011 (N = 124,517). For calculating the unemployment rates, the proportion of respondents with ATUS variable TELFS = 3 (unemployed - on layoff) and TELFS = 4 (unemployed - looking) was calculated. Error bars represent standard errors.
LogOdds for being a short sleeper (≤ 6 h) on weekends and holidays are given for combinations of sociodemographic categories (N = 63,630). All logistic regression models were adjusted for census region, day of the week, season, and survey year. Models were not run for category combinations that contained < 200 respondents in the overall survey (white cells).
LogOdds for being a long sleeper (≥ 11 h) on weekdays are given for combinations of sociodemographic categories (N = 60,887). All models were adjusted for census region, day of the week, season, and survey year. Models were not run for category combinations that contained < 200 respondents in the overall survey (white cells).
LogOdds for being a long sleeper (≥ 11 h) on weekends and holidays are given for combinations of sociodemographic categories (N = 63,630). All models were adjusted for census region, day of the week, season, and survey year. Models were not run for category combinations that contained < 200 respondents in the overall survey (white cells).
Average time (± 95% confidence interval) that short sleepers (≤ 6 h) and long sleepers (≥ 11 h) spent more or less in waking activities relative to normal sleepers (> 6 h and < 11 h) on weekends or holidays (N = 63,630). Categories are listed in descending order based on short sleepers. For each activity, a linear regression model adjusting for age, gender, and race/ethnicity was run.
Waking activities short sleepers (≤ 6 h) spend more time on compared to normal sleepers (> 6 h and < 11 h) across sociodemographic categories and on weekends and holidays (N = 63,630). Rank #1 is the activity with the largest increase in time. Activities are coded with the category numbers from Table 1. Six waking activities are color coded instead. All For each stratum (e.g., 15 to 24 years old) and each of the 39 waking activities defined in Table 1, a separate linear regression model with indicator variables for short and long sleep as the only predictors was run.
Waking activities long sleepers (≥ 11 h) spend less time on compared to normal sleepers (> 6 h and < 11 h) across sociodemographic categories and on weekdays (N = 60,887). Rank #1 is the activity with the largest decrease in time. Activities are coded with the category numbers from Table 1. Six waking activities are color coded instead. For each stratum (e.g., 15 to 24 years old) and each of the 39 waking activities defined in Table 1, a separate linear regression model with indicator variables for short and long sleep as the only predictors was run.
Waking activities long sleepers (≥ 11 h) spend less time on compared to normal sleepers (> 6 h and < 11 h) across sociodemographic categories and on weekends and holidays (N = 63,630). Rank #1 is the activity with the largest decrease in time. Activities are coded with the category numbers from Table 1. Six waking activities are color coded instead. For each stratum (e.g., 15 to 24 years old) and each of the 39 waking activities defined in Table 1, a separate linear regression model with indicator variables for short and long sleep as the only predictors was run.
(A) The effect of work start time on sleep time stratified by age: 15-34 years (N = 9,252), 35-54 years (N = 19,199), and ≥ 55 years (N = 6,806). (B) The effect of class start time on sleep time stratified by full-time high school student (N = 2,032) and full-time college/university student (N = 625). Error bars represent standard errors.
Relationship between average work time (ordinate) and average sleep time (abscissa) for the survey years 2003 to 2011. The analysis was restricted to weekdays (N = 60,887). The left panel shows an analysis based on all respondents, while the right panel shows an analysis restricted to respondents with employment.
(A) Prevalence of being a full-time student, employed, or neither a full-time student nor employed (other) depending on age. The prevalence of employment was similar to the prevalence of being a full-time student between 19 and 21, but exceeded the latter for ages 22 and above. (B) Average sleep time is shown for full-time students, employed respondents, or respondents who were neither a full-time student or employed. Sleep time decreased with age, with a more prominent decline for subjects 20 and older. Average sleep time was similar between full-time students and workers across all age groups. Those who did not work or attend school/college/university averaged more sleep. Both figures show unadjusted results based on weekday data.
Time spent in six different leisure activities depending on age (A) and survey year (B). Watching TV was the dominant activity across all ages. Time spent watching TV and reading increased steadily for > 45-year-old respondents. The time spent in the different leisure activities remained relatively stable across survey years. Although it increased slightly in the period 2009-2011, computer use for purposes other than playing games accounted for less than 30 min per 24 hours on average. Both figures show unadjusted results based on weekday data.
REFERENCES
- 1.Banks S, Dinges DF. Behavioral and physiological consequences of sleep restriction. J Clin Sleep Med. 2007;3:519–28. [PMC free article] [PubMed] [Google Scholar]
- 2.Diekelmann S, Born J. The memory function of sleep. Nat Rev Neurosci. 2010;11:114–26. doi: 10.1038/nrn2762. [DOI] [PubMed] [Google Scholar]
- 3. Traffic Safety Stats - Drowsy Driving, 2011. Report No.: DOT HS 811449.
- 4.Patel SR, Hu FB. Short sleep duration and weight gain: a systematic review. Obesity (Silver Spring) 2008;16:643–53. doi: 10.1038/oby.2007.118. [DOI] [PMC free article] [PubMed] [Google Scholar]
- 5.Knutson KL, Van Cauter E. Associations between sleep loss and increased risk of obesity and diabetes. Ann N Y Acad Sci. 2008;1129:287–304. doi: 10.1196/annals.1417.033. [DOI] [PMC free article] [PubMed] [Google Scholar]
- 6.Beihl DA, Liese AD, Haffner SM. Sleep duration as a risk factor for incident type 2 diabetes in a multiethnic cohort. Ann Epidemiol. 2009;19:351–7. doi: 10.1016/j.annepidem.2008.12.001. [DOI] [PubMed] [Google Scholar]
- 7.Holliday EG, Magee CA, Kritharides L, Banks E, Attia J. Short sleep duration is associated with risk of future diabetes but not cardiovascular disease: a prospective study and meta-analysis. PLoS One. 2013;8:e82305. doi: 10.1371/journal.pone.0082305. [DOI] [PMC free article] [PubMed] [Google Scholar]
- 8.Wang Q, Xi B, Liu M, Zhang Y, Fu M. Short sleep duration is associated with hypertension risk among adults: a systematic review and meta-analysis. Hypertens Res. 2012;35:1012–8. doi: 10.1038/hr.2012.91. [DOI] [PubMed] [Google Scholar]
- 9.Grandner MA, Chakravorty S, Perlis ML, Oliver L, Gurubhagavatula I. Habitual sleep duration associated with self-reported and objectively determined cardiometabolic risk factors. Sleep Med. 2014;15:42–50. doi: 10.1016/j.sleep.2013.09.012. [DOI] [PMC free article] [PubMed] [Google Scholar]
- 10.Shankar A, Koh WP, Yuan JM, Lee HP, Yu MC. Sleep duration and coronary heart disease mortality among Chinese adults in Singapore: a population-based cohort study. Am J Epidemiol. 2008;168:1367–73. doi: 10.1093/aje/kwn281. [DOI] [PMC free article] [PubMed] [Google Scholar]
- 11.Ferrie JE, Shipley MJ, Akbaraly TN, Marmot MG, Kivimaki M, Singh-Manoux A. Change in sleep duration and cognitive function: findings from the Whitehall II Study. Sleep. 2011;34:565–73. doi: 10.1093/sleep/34.5.565. [DOI] [PMC free article] [PubMed] [Google Scholar]
- 12.Gallicchio L, Kalesan B. Sleep duration and mortality: a systematic review and meta-analysis. J Sleep Res. 2009;18:148–58. doi: 10.1111/j.1365-2869.2008.00732.x. [DOI] [PubMed] [Google Scholar]
- 13.Cappuccio FP, D'Elia L, Strazzullo P, Miller MA. Sleep duration and all-cause mortality: a systematic review and meta-analysis of prospective studies. Sleep. 2010;33:585–92. doi: 10.1093/sleep/33.5.585. [DOI] [PMC free article] [PubMed] [Google Scholar]
- 14.Buxton OM, Cain SW, O'Connor SP, et al. Adverse metabolic consequences in humans of prolonged sleep restriction combined with circadian disruption. Sci Transl Med. 2012;4:129ra43. doi: 10.1126/scitranslmed.3003200. [DOI] [PMC free article] [PubMed] [Google Scholar]
- 15.Buxton OM, Pavlova M, Reid EW, Wang W, Simonson DC, Adler GK. Sleep restriction for 1 week reduces insulin sensitivity in healthy men. Diabetes. 2010;59:2126–33. doi: 10.2337/db09-0699. [DOI] [PMC free article] [PubMed] [Google Scholar]
- 16.Taheri S, Lin L, Austin D, Young T, Mignot E. Short sleep duration is associated with reduced leptin, elevated ghrelin, and increased body mass index. PLoS Med. 2004;1:e62. doi: 10.1371/journal.pmed.0010062. [DOI] [PMC free article] [PubMed] [Google Scholar]
- 17.Prather AA, Hall M, Fury JM, et al. Sleep and antibody response to hepatitis B vaccination. Sleep. 2012;35:1063–9. doi: 10.5665/sleep.1990. [DOI] [PMC free article] [PubMed] [Google Scholar]
- 18.Dettoni JL, Consolim-Colombo FM, Drager LF, et al. Cardiovascular effects of partial sleep deprivation in healthy volunteers. J Appl Physiol. 2012;113:232–6. doi: 10.1152/japplphysiol.01604.2011. [DOI] [PubMed] [Google Scholar]
- 19.Colten HR, Altevogt BM, editors. Institute of Medicine (US) Committee on Sleep Medicine and Research. Sleep Disorders and Sleep Deprivation: An Unmet Public Health Problem. Washington, DC: National Academies Press; 2006. Available from: http://www.ncbi.nlm.nih.gov/books/NBK19960/ [PubMed] [Google Scholar]
- 20.Centers for Disease Control and Prevention (CDC) Effect of short sleep duration on daily activities--United States, 2005-2008. MMWR Morb Mortal Wkly Rep. 2011;60:239–42. [PubMed] [Google Scholar]
- 21.Knutson KL. Sociodemographic and cultural determinants of sleep deficiency: implications for cardiometabolic disease risk. Soc Sci Med. 2013;79:7–15. doi: 10.1016/j.socscimed.2012.05.002. [DOI] [PMC free article] [PubMed] [Google Scholar]
- 22.Hale L, Do DP. Racial differences in self-reports of sleep duration in a population-based study. Sleep. 2007;30:1096–103. doi: 10.1093/sleep/30.9.1096. [DOI] [PMC free article] [PubMed] [Google Scholar]
- 23.Krueger PM, Friedman EM. Sleep duration in the United States: a cross-sectional population-based study. Am J Epidemiol. 2009;169:1052–63. doi: 10.1093/aje/kwp023. [DOI] [PMC free article] [PubMed] [Google Scholar]
- 24.American Time Use Survey User's Guide - Understanding ATUS 2003 to 2011: U.S. Bureau of Labor Statistics and U.S. Census Bureau. 2012. Report No.: Accessed through http://www.bls.gov/tus/atususersguide.pdf on 10/28/2012.
- 25.Basner M, Fomberstein KM, Razavi FM, et al. American time use survey: sleep time and its relationship to waking activities. Sleep. 2007;30:1085–95. doi: 10.1093/sleep/30.9.1085. [DOI] [PMC free article] [PubMed] [Google Scholar]
- 26.Silva GE, Goodwin JL, Sherrill DL, et al. Relationship between reported and measured sleep times: The Sleep Heart Health Study (SHHS) J Clin Sleep Med. 2007;3:622–30. [PMC free article] [PubMed] [Google Scholar]
- 27.Lauderdale DS, Knutson KL, Yan LL, Liu K, Rathouz PJ. Self-reported and measured sleep duration: how similar are they? Epidemiology. 2008;19:838–45. doi: 10.1097/EDE.0b013e318187a7b0. [DOI] [PMC free article] [PubMed] [Google Scholar]
- 28.Bin YS, Marshall NS, Glozier N. Sleeping at the limits: the changing prevalence of short and long sleep durations in 10 countries. Am J Epidemiol. 2013;177:826–33. doi: 10.1093/aje/kws308. [DOI] [PubMed] [Google Scholar]
- 29.Satterthwaite TD, Wolf DH, Erus G, et al. Functional maturation of the executive system during adolescence. J Neurosci. 2013;33:16249–61. doi: 10.1523/JNEUROSCI.2345-13.2013. [DOI] [PMC free article] [PubMed] [Google Scholar]
- 30.Biddle JE, Hamermesh DS. Sleep and the allocation of time. J Political Econ. 1990;98:922–43. [Google Scholar]
- 31.Knutson KL, Van Cauter E, Rathouz PJ, DeLeire T, Lauderdale DS. Trends in the prevalence of short sleepers in the USA: 1975-2006. Sleep. 2010;33:37–45. doi: 10.1093/sleep/33.1.37. [DOI] [PMC free article] [PubMed] [Google Scholar]
- 32.Basner M, Dinges DF. Dubious bargain: trading sleep for Leno and Letterman. Sleep. 2009;32:747–52. doi: 10.1093/sleep/32.6.747. [DOI] [PMC free article] [PubMed] [Google Scholar]
- 33.Takahashi M, Iwasaki K, Sasaki T, Kubo T, Mori I, Otsuka Y. Sleep, fatigue, recovery, and depression after change in work time control: a one-year follow-up study. J Occup Environ Med. 2012;54:1078–85. doi: 10.1097/JOM.0b013e31826230b7. [DOI] [PubMed] [Google Scholar]
- 34.Lufi D, Tzischinsky O, Hadar S. Delaying school starting time by one hour: some effects on attention levels in adolescents. J Clin Sleep Med. 2011;7:137–43. [PMC free article] [PubMed] [Google Scholar]
- 35.Boergers J, Gable CJ, Owens JA. Later school start time is associated with improved sleep and daytime functioning in adolescents. J Dev Behav Pediatr. 2014;35:11–7. doi: 10.1097/DBP.0000000000000018. [DOI] [PubMed] [Google Scholar]
- 36.Vorona RD, Szklo-Coxe M, Wu A, Dubik M, Zhao Y, Ware JC. Dissimilar teen crash rates in two neighboring southeastern Virginia cities with different high school start times. J Clin Sleep Med. 2011;7:145–51. [PMC free article] [PubMed] [Google Scholar]
- 37.Onyper SV, Thacher PV, Gilbert JW, Gradess SG. Class start times, sleep, and academic performance in college: a path analysis. Chronobiol Int. 2012;29:318–35. doi: 10.3109/07420528.2012.655868. [DOI] [PubMed] [Google Scholar]
- 38.Wittmann M, Dinich J, Merrow M, Roenneberg T. Social jetlag: misalignment of biological and social time. Chronobiol Int. 2006;23:497–509. doi: 10.1080/07420520500545979. [DOI] [PubMed] [Google Scholar]
- 39.McNeeley MF, Monroe EJ, Prabhu SJ, Iyer RS. Internal versus external moonlighting by radiology trainees: differences in roles and responsibilities. Acad Radiol. 2014;21:546–53. doi: 10.1016/j.acra.2013.08.025. [DOI] [PubMed] [Google Scholar]
- 40.Christian TJ. Trade-offs between commuting time and health-related activities. J Urban Health. 2012;89:746–57. doi: 10.1007/s11524-012-9678-6. [DOI] [PMC free article] [PubMed] [Google Scholar]
- 41.Burgess HJ. Evening ambient light exposure can reduce circadian phase advances to morning light independent of sleep deprivation. J Sleep Res. 2013;22:83–8. doi: 10.1111/j.1365-2869.2012.01042.x. [DOI] [PMC free article] [PubMed] [Google Scholar]
- 42.Gooley JJ, Chamberlain K, Smith KA, et al. Exposure to room light before bedtime suppresses melatonin onset and shortens melatonin duration in humans. J Clin Endocrinol Metab. 2011;96:E463–72. doi: 10.1210/jc.2010-2098. [DOI] [PMC free article] [PubMed] [Google Scholar]
- 43.Maslowsky J, Ozer EJ. Developmental trends in sleep duration in adolescence and young adulthood: evidence from a national United States sample. J Adolesc Health. 2014;54:691–7. doi: 10.1016/j.jadohealth.2013.10.201. [DOI] [PMC free article] [PubMed] [Google Scholar]
- 44.Jackson CL, Redline S, Kawachi I, Williams MA, Hu FB. Racial disparities in short sleep duration by occupation and industry. Am J Epidemiol. 2013;178:1442–51. doi: 10.1093/aje/kwt159. [DOI] [PMC free article] [PubMed] [Google Scholar]
- 45.Adenekan B, Pandey A, McKenzie S, Zizi F, Casimir GJ, Jean-Louis G. Sleep in America: role of racial/ethnic differences. Sleep Med Rev. 2013;17:255–62. doi: 10.1016/j.smrv.2012.07.002. [DOI] [PMC free article] [PubMed] [Google Scholar]
- 46.Stamatakis KA, Kaplan GA, Roberts RE. Short sleep duration across income, education, and Race/Ethnic groups: population prevalence and growing disparities during 34 years of follow-up. Ann Epidemiol. 2007;17:948–55. doi: 10.1016/j.annepidem.2007.07.096. [DOI] [PMC free article] [PubMed] [Google Scholar]
- 47.Ohayon MM, Carskadon MA, Guilleminault C, Vitiello MV. Meta-analysis of quantitative sleep parameters from childhood to old age in healthy individuals: developing normative sleep values across the human lifespan. Sleep. 2004;27:1255–73. doi: 10.1093/sleep/27.7.1255. [DOI] [PubMed] [Google Scholar]
- 48.Van Dongen HP, Maislin G, Mullington JM, Dinges DF. The cumulative cost of additional wakefulness: dose-response effects on neurobehavioral functions and sleep physiology from chronic sleep restriction and total sleep deprivation. Sleep. 2003;26:117–26. doi: 10.1093/sleep/26.2.117. [DOI] [PubMed] [Google Scholar]
Associated Data
This section collects any data citations, data availability statements, or supplementary materials included in this article.
Supplementary Materials
Unadjusted models: Moderators of sleep time, short sleep duration, and long sleep duration on weekdays (N = 60,887) and weekends/holidays (N = 63,630). Separate models were run for each category.
Sleep lost or gained by time of day on weekends and holidays for several sociodemographic categories (N = 63,630). Each cell represents a 30-min time window and the amount of sleep lost or gained compared to all other respondents within a given category. The color indicates the amount of sleep lost (red) or gained (green). For example, 15- to 24-year-old respondents slept > 4 minutes less than ≥ 25-year-old respondents in the 0:00-0:29 time window on weekends/holidays. The numbers in the column labeled “Min” show how many minutes of sleep are lost or gained per 24 h compared to all other respondents within a given category. All analyses are based on unadjusted linear regression models (i.e., separate models were run for each category).
Unemployment rates for the survey years 2003 to 2011 (N = 124,517). For calculating the unemployment rates, the proportion of respondents with ATUS variable TELFS = 3 (unemployed - on layoff) and TELFS = 4 (unemployed - looking) was calculated. Error bars represent standard errors.
LogOdds for being a short sleeper (≤ 6 h) on weekends and holidays are given for combinations of sociodemographic categories (N = 63,630). All logistic regression models were adjusted for census region, day of the week, season, and survey year. Models were not run for category combinations that contained < 200 respondents in the overall survey (white cells).
LogOdds for being a long sleeper (≥ 11 h) on weekdays are given for combinations of sociodemographic categories (N = 60,887). All models were adjusted for census region, day of the week, season, and survey year. Models were not run for category combinations that contained < 200 respondents in the overall survey (white cells).
LogOdds for being a long sleeper (≥ 11 h) on weekends and holidays are given for combinations of sociodemographic categories (N = 63,630). All models were adjusted for census region, day of the week, season, and survey year. Models were not run for category combinations that contained < 200 respondents in the overall survey (white cells).
Average time (± 95% confidence interval) that short sleepers (≤ 6 h) and long sleepers (≥ 11 h) spent more or less in waking activities relative to normal sleepers (> 6 h and < 11 h) on weekends or holidays (N = 63,630). Categories are listed in descending order based on short sleepers. For each activity, a linear regression model adjusting for age, gender, and race/ethnicity was run.
Waking activities short sleepers (≤ 6 h) spend more time on compared to normal sleepers (> 6 h and < 11 h) across sociodemographic categories and on weekends and holidays (N = 63,630). Rank #1 is the activity with the largest increase in time. Activities are coded with the category numbers from Table 1. Six waking activities are color coded instead. All For each stratum (e.g., 15 to 24 years old) and each of the 39 waking activities defined in Table 1, a separate linear regression model with indicator variables for short and long sleep as the only predictors was run.
Waking activities long sleepers (≥ 11 h) spend less time on compared to normal sleepers (> 6 h and < 11 h) across sociodemographic categories and on weekdays (N = 60,887). Rank #1 is the activity with the largest decrease in time. Activities are coded with the category numbers from Table 1. Six waking activities are color coded instead. For each stratum (e.g., 15 to 24 years old) and each of the 39 waking activities defined in Table 1, a separate linear regression model with indicator variables for short and long sleep as the only predictors was run.
Waking activities long sleepers (≥ 11 h) spend less time on compared to normal sleepers (> 6 h and < 11 h) across sociodemographic categories and on weekends and holidays (N = 63,630). Rank #1 is the activity with the largest decrease in time. Activities are coded with the category numbers from Table 1. Six waking activities are color coded instead. For each stratum (e.g., 15 to 24 years old) and each of the 39 waking activities defined in Table 1, a separate linear regression model with indicator variables for short and long sleep as the only predictors was run.
(A) The effect of work start time on sleep time stratified by age: 15-34 years (N = 9,252), 35-54 years (N = 19,199), and ≥ 55 years (N = 6,806). (B) The effect of class start time on sleep time stratified by full-time high school student (N = 2,032) and full-time college/university student (N = 625). Error bars represent standard errors.
Relationship between average work time (ordinate) and average sleep time (abscissa) for the survey years 2003 to 2011. The analysis was restricted to weekdays (N = 60,887). The left panel shows an analysis based on all respondents, while the right panel shows an analysis restricted to respondents with employment.
(A) Prevalence of being a full-time student, employed, or neither a full-time student nor employed (other) depending on age. The prevalence of employment was similar to the prevalence of being a full-time student between 19 and 21, but exceeded the latter for ages 22 and above. (B) Average sleep time is shown for full-time students, employed respondents, or respondents who were neither a full-time student or employed. Sleep time decreased with age, with a more prominent decline for subjects 20 and older. Average sleep time was similar between full-time students and workers across all age groups. Those who did not work or attend school/college/university averaged more sleep. Both figures show unadjusted results based on weekday data.
Time spent in six different leisure activities depending on age (A) and survey year (B). Watching TV was the dominant activity across all ages. Time spent watching TV and reading increased steadily for > 45-year-old respondents. The time spent in the different leisure activities remained relatively stable across survey years. Although it increased slightly in the period 2009-2011, computer use for purposes other than playing games accounted for less than 30 min per 24 hours on average. Both figures show unadjusted results based on weekday data.