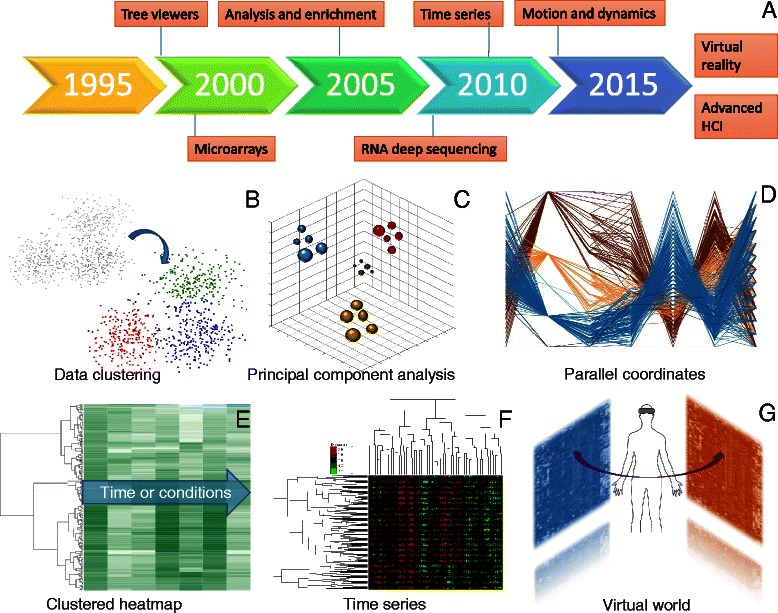
Fig. 5.

Multivariate analyses and visualization. a Timeline of the emergence of relevant technologies and concepts. b Visualization of k-means partitional clustering algorithm. c 3D visualization of a principal component analysis. d Visualization of gene-expression measures across time using parallel coordinates. e Visualization of gene-expression clustering across time. f 2D hierarchical clustering to visualize gene expressions against several time points or conditions. g Hypothetical integration of analyses and expression heatmaps and the control of objects by VR devices
