

Abstract
Background
Influenza disease is a vaccine-preventable cause of morbidity and mortality. The Pan American Health Organization (PAHO) region has invested in influenza vaccines, but few estimates of influenza burden exist to justify these investments. We estimated influenza-associated deaths for 35 PAHO countries during 2002–2008.
Methods
Annually, PAHO countries report registered deaths. We used respiratory and circulatory (R&C) codes from seven countries with distinct influenza seasonality and high-quality mortality data to estimate influenza-associated mortality rates by age group (0–64, 65–74, and ≥75 years) with a Serfling regression model or a negative binomial model. We calculated the percent of all R&C deaths attributable to influenza by age group in these countries (etiologic fraction) and applied it to the age-specific mortality in 13 countries with good mortality data but poorly defined seasonality. Lastly, we grouped the remaining 15 countries into WHO mortality strata and applied the age and mortality stratum-specific rate of influenza mortality calculated from the 20 countries. We summed each country’s estimate to arrive at an average total annual number and rate of influenza deaths in the Americas.
Results
For the 35 PAHO countries, we estimated an annual mean influenza-associated mortality rate of 2·1/100 000 among <65-year olds, 31·9/100 000 among those 65–74 years, and 161·8/100 000 among those ≥75 years. We estimated that annually between 40 880 and 160 270 persons (mean, 85 100) die of influenza illness in the PAHO region.
Conclusion
Influenza remains an important cause of mortality in the Americas.
Keywords: Americas, influenza, model, mortality
Introduction
Seasonal influenza infection is a major cause of morbidity and mortality worldwide.1–3 Persons most at the risk of complications from influenza infection are the young,2,4 the elderly,5 and those with certain preexisting health conditions.6,7
Cumulative evidence of the burden of influenza and risk groups, largely from higher income temperate countries, has led to adoption of influenza vaccination programs by many nations. As of 2010, of the 35 countries in the Americas [Pan American Health Organization (PAHO) region], 16 have influenza vaccination recommendations, and coverage levels for high-risk groups such as the elderly reached between 21% and 100%.8 The large majority of vaccination programs in Latin America, however, have been implemented without clear local evidence of the burden of influenza.
Influenza vaccination is complicated by the need for annual administration, possible poor match of vaccine strains to circulating strains, waning of vaccine-induced immunity, and less than ideal immunogenicity of traditional inactivated influenza vaccine in the elderly.9 Moreover, accounting properly for bias in observational studies has challenged the generation of robust evidence of the impact of influenza vaccination in preventing mortality.10 Mortality estimates in the Americas, both for the region and by country, are a key piece of evidence to allow continued investments by countries and through the PAHO Revolving Fund for influenza vaccination,11 to improve coverage in countries and inclusion of different risk groups. Moreover, such estimates will help public health authorities consider newer vaccines such as high-dose and intradermal vaccines that have higher immunogenicity in the elderly, among whom the highest burden of influenza lies.12
One factor for the limited influenza burden estimates in the region has been the historically poor quality of mortality data. In addition, there are methodological difficulties in estimating influenza burden in tropical countries without clearly defined influenza seasonality. Since 2000, however, PAHO has routinely collected vital statistical data, and recent efforts have improved the quality and completeness of these data.13 We used these data and developed an approach to circumvent the traditional challenges in estimating influenza burden in tropical countries where seasonality is not apparent, to generate an estimate of influenza-associated deaths for all 35 PAHO countries during 2002–2008.
Methods
Mortality data sources and study period
Every year, countries in the Americas report death certificate data to PAHO’s regional mortality database. The data include underlying cause of death [coded using the International Statistical Classification of Diseases and Related Health Problems, 10th revision (ICD-10) system], age, and date of death among other variables.
We assessed the quality of mortality data reported to PAHO during 2002–2010 for completeness, coverage, and the frequency of so-called ill-defined or garbage codes.14,15 Seven temperate countries (southern Brazil is considered as a country here) were identified to have data with identifiable seasonality of pneumonia and influenza (P&I)-coded data as a proxy for influenza activity and <20% ill-defined deaths15,16: Argentina, Chile, Mexico, Paraguay, southern Brazil (states of São Paulo, Paraná, Santa Catarina, and Rio Grande do Sul), the United States, and Uruguay. Data were extracted for Argentina, Chile, Paraguay, and southern Brazil for the years 2002–2009, for Mexico for the period June 2002 to June 2010, and for Uruguay, 2004 and 2007–2009 (2005–2006 data were unreported). For the United States, national mortality data were obtained from the National Center for Health Statistics for the years 2002–2010. An additional 13 countries and northern Brazil were identified to have data with poorly defined P&I seasonality and <20% ill-defined deaths: Barbados, Colombia, Costa Rica, Cuba, Ecuador, El Salvador, Guatemala, Guyana, Nicaragua, Panama, Peru, St. Lucia, and Venezuela; for these countries, the available data were extracted for the period 2002–2008. We adjusted the number of deaths by the proportion of underreporting estimated by PAHO for each country.13
Although we analyzed all available data as part of the time series, we limited the data presented here to that from 2002 to 2008 because we were primarily interested in estimating seasonal rather than pandemic influenza-associated mortality. We grouped underlying cause of death into three categories for analysis: P&I deaths (ICD-10 codes J10–J18), respiratory deaths (ICD-10 codes J00–J99), and circulatory deaths (ICD-10 codes I00–I99).
For all countries except Brazil, age-stratified annual population estimates for 2002–2010 were obtained from the US Census Bureau Domestic and International Data Base, Population Division.17 For the southern states of Brazil, population data were obtained from the Instituto Brasileiro de Geografia e Estatística.18
Respiratory and circulatory mortality
We applied the midyear age-group-specific population to the time series data and applied a Serfling regression model to weekly (Chile, Mexico, Paraguay, Uruguay) or monthly (Argentina and southern Brazil) respiratory and circulatory mortality rate data, stratified by three age categories (<65, 65–74, and ≥75 years) (see Supporting Information). Using off-season data, the model estimated the expected baseline respiratory and circulatory mortality rates during the influenza season, with 95% confidence intervals (CIs). The seasonal baseline represents the expected number of deaths in the absence of influenza virus circulation. For Uruguay, data from the 2004 time series were added directly to the 2007–2009 series to provide a 4-year time series for analysis.
For the United States, influenza-associated deaths were estimated using negative binomial regression models as previously described.5,19
Defining the influenza epidemic period
To arrive at influenza-associated deaths, we defined annual periods of influenza circulation. Excess mortality in any one season was defined as the number of deaths occurring above the baseline during the influenza epidemic periods. The influenza period was defined in two different ways depending on the country.
Pneumonia and influenza deaths
For Argentina, Chile, Mexico, southern Brazil, and Uruguay, viral data were so sparse that we used P&I activity as a proxy for influenza seasonality, as performed in other studies.20,21 We applied a Serfling regression model to weekly (Chile, Paraguay, Uruguay) or monthly (Argentina and southern Brazil) P&I mortality rates. The model estimated the expected P&I baseline as well as an epidemic threshold (the upper 95% CI of the baseline). We defined influenza epidemic periods as the weeks or months in which the observed P&I mortality was greater than the epidemic threshold.
Influenza viral data
For Paraguay and the United States, the virology data were of sufficient quality to use to define the epidemic period. For Paraguay, we calculated the weekly percent of respiratory samples testing positive for influenza reported to FluNet during the study period.22 The start of the annual influenza epidemic period was defined as the first week when the percent positivity exceeded and remained above the mean percent positivity (threshold) for at least 3 weeks. The end of the influenza epidemic period was defined as the first week after an epidemic when the percent positivity remained below the threshold for at least three consecutive weeks.
For the United States, we used viral data collected at the Centers for Disease Control and Prevention (CDC)23 to include the percent positivity for influenza by type and subtype as covariates in negative binomial models as described before.5
Extrapolation of seasonal influenza estimates from selected countries to the region
For PAHO countries that lie within the tropical belt, there is scant virology information before 2008, and influenza activity is often unpredictable and may occur year-round, complicating the application of traditional regression models to estimate influenza-associated mortality. We hypothesized that although the influenza seasonality and all-cause respiratory or circulatory mortality may vary annually among countries, over time, the proportion of all respiratory or circulatory deaths (or etiologic fraction) attributable to influenza would be consistent throughout these countries.
Therefore, for each of the seven countries with influenza-associated estimates, we estimated the proportion of respiratory deaths attributable to influenza by year and age group by dividing the estimated rate of influenza-associated deaths by the total rate of reported respiratory deaths for each year and age group. We then built a representative triangular probability distribution of the percent of respiratory deaths attributable to influenza for each year and age category, setting the median percent positive equal to the point estimate and the minimum and maximum of the triangular distribution set to 5% and 95% of the CI. We then sampled each triangular distribution 100 000 times to build the final probability distribution of the mean proportion (and 5th–95th percentile) of influenza-associated deaths by age group in the seven countries. This process was repeated for circulatory deaths associated with influenza.
Estimates of annual influenza-associated deaths for countries with mortality data
To estimate annual influenza-associated mortality for the 13 other PAHO-region countries and northern Brazil, which had mortality data with poorly defined seasonality but <20% ill-defined deaths, we applied the age-group-specific base proportion derived from the seven countries (and their 5th and 95th percentiles) to the average of the age-group-specific number of respiratory or circulatory deaths in a particular country during the study period (2002–2008) to give the annual influenza-associated mortality in that country.
Estimates of annual influenza-associated deaths for PAHO countries without mortality data
We grouped the remaining 15 PAHO countries with limited mortality data and ill-defined influenza seasonality by World Health Organization (WHO) mortality strata24 and into age groups. We used the mean age-specific influenza mortality rates from countries with estimated influenza-associated rates (N = 20) that lie in the same mortality stratum and multiplied them by the stratum-specific population of countries without data to generate age-specific estimates of the number of respiratory and circulatory influenza-associated deaths in those countries.
Sensitivity analyses
Impact of the different model choices for the US data
To fully benefit from the additional viral data available from the United States, we opted to use a negative binomial model to estimate influenza-associated mortality. Negative binomial models use influenza activity as a covariate and better accounts for the variability in weekly influenza activity than the traditional Serfling model.5 To ensure this was a reasonable approach, we compared our estimated influenza-associated mortality for the United States through both negative binomial and Serfling regression models.
Impact and stability of the chosen methodological approaches
To determine the impact of the regression model and the two extrapolation methods on influenza-associated mortality estimates, we generated Mexico estimates through the 2nd and the 3rd group of countries extrapolation methods. We then compared the estimated influenza-associated mortality for Mexico generated through all three approaches (i.e. the regression model and the two extrapolation methods).
Comparison of the estimates from this study with those from the literature
We compared our estimates with those from the literature including countries (such as Argentina, South Brazil, Canada, Costa Rica, and Mexico) and Americas region.
Results
Rates of influenza-associated respiratory and circulatory mortality for the seven baseline countries
Influenza-associated mortality rates rose sharply and significantly with increasing age (Table1). The annual mean influenza-associated respiratory mortality rates between countries ranged from 0·5 to 2·4 per 100 000 person-years for persons aged <65 years, 12–41 for persons aged 65–74 years, and 52–197 for persons aged ≥75 years. The annual mean influenza-associated circulatory mortality rates between countries during the study period ranged from 0·5 to 2·4 per 100 000 person-years for persons aged <65 years, 8–39 for persons aged 65–74 years, and 60–218 for persons aged ≥75 years. The annual mean influenza-associated death rate due to both respiratory and circulatory causes ranged from 1 to 4 per 100 000 person-years for persons aged <65 years, 19–71 for persons aged 65–74 years, and 112–386 for persons aged ≥75 years. Substantial variation of the mean respiratory and circulatory rates existed between countries: Argentina and Uruguay tended to have the highest rates. The CIs of the country-specific means for any one age group overlapped substantially between countries, however, suggesting that burden estimates between years were more variable than between countries. Total burden of both respiratory and circulatory causes for all ages ranged from eight deaths per 100 000 person-years in Mexico to 32 deaths per 100 000 person-years in Uruguay.
Table 1.
Mean influenza-associated mortality rates (95% confidence interval) per 100 000 person-years for seven baseline countries/regions, 2002–2008
| Country | Respiratory | Circulatory | Respiratory and circulatory | |||||||
|---|---|---|---|---|---|---|---|---|---|---|
| <65 | 65–74 | ≥75 | <65 | 65–74 | ≥75 | <65 | 65–74 | ≥75 | All | |
| Argentina | 2·4 (1·7–3·2) | 31·6 (20·4–43·0) | 168 (112·8–224·6) | 1·5 (0·3–3·0) | 38·9 (18·8–61·4) | 217·9 (125·7–311·9) | 3·9 (2·0–6·2) | 70·5 (39·2–104·4) | 385·9 (238·5–536·5) | 24·8 (14·7–35·6) |
| South Brazil | 1 (0·2–2·5) | 15·9 (3·9–17·4) | 70 (15·0–187·5) | 1·1 (0·2–3·0) | 22·3 (5·0–62·9) | 91·4 (19·5–257·4) | 2·1 (0·4–5·5) | 38·2 (8·9–102·3) | 161·4 (34·5–444·9) | 8·0 (2·4–14·5) |
| Chile | 0·5 (0·0–1·4) | 17·4 (2·8–40·2) | 93·9 (35·2–164·4) | 0·5 (0·1–1·1) | 14·5 (5·4–26·2) | 100·8 (59·6–143·8) | 1 (0·2–2·5) | 31·9 (8·2–66·4) | 194·7 (94·8–308·3) | 8·9 (3·6–15·6) |
| Mexico | 1·3 (0·5–2·1) | 12·9 (2·8–30·4) | 101·7 (41·7–170·2) | 1·5 (0·7–2·2) | 20·4 (8·9–32·5) | 78·4 (40·0–120·5) | 2·8 (1·3–4·3) | 33·3 (11·7–62·9) | 180·1 (81·7–290·7) | 7·9 (3·4–13·0) |
| Paraguay | 0·9 (0·2–2·1) | 11·6 (2·2–30·5) | 65·1 (24·1–131·7) | n.d. | n.d. | n.d. | n.d. | n.d. | n.d. | n.d. |
| Uruguay | 1·5 (0·1–4·8) | 40·6 (7·6–95·5) | 196·9 (58·7–351·4) | 2·4 (0·6–4·5) | 29·3 (9·3–54·1) | 172·1 (96·4–253·0) | 3·9 (0·7–9·3) | 69·9 (16·9–149·6) | 369 (155·1–604·4) | 31·6 (11·5–56·9) |
| United States | 0·7 (0·5–1·0) | 10·8 (8·9–15·6) | 52 (47·4–62·1) | 0·6 (0·4–1·2) | 8·2 (6·0–16·0) | 59·7 (51·8–77·9) | 1·3 (0·9–2·2) | 19 (14·9–31·6) | 111·7 (99·3–140·1) | 9·1 (7·8–12·4) |
n.d., not determined.
Influenza-associated deaths in the region
We first calculated the proportion of all respiratory and circulatory deaths due to influenza using the influenza-associated death rate in Table1 divided by the crude respiratory or circulatory death rate (Table S1). Figure1 shows these data stratified by country. For respiratory deaths, the proportions ranged from 3% to 15% for persons aged <65 years, 3–13% for persons aged 65–74 years, and 4–16% for persons aged ≥75 years. For circulatory deaths, the proportions ranged from 1% to 4% for persons aged <65 years, 1–5% for persons aged 65–74 years, and 2–7% for persons aged >75 years. The mean baseline proportion of respiratory deaths in the seven countries due to influenza was 7% across the three age groups. The mean of the seven-country baseline proportion of circulatory deaths was 2·2% for persons aged <65 years, 2·6% for persons aged 65–74 years, and 3·5% for persons aged ≥75 years (Table S1).
Figure 1.
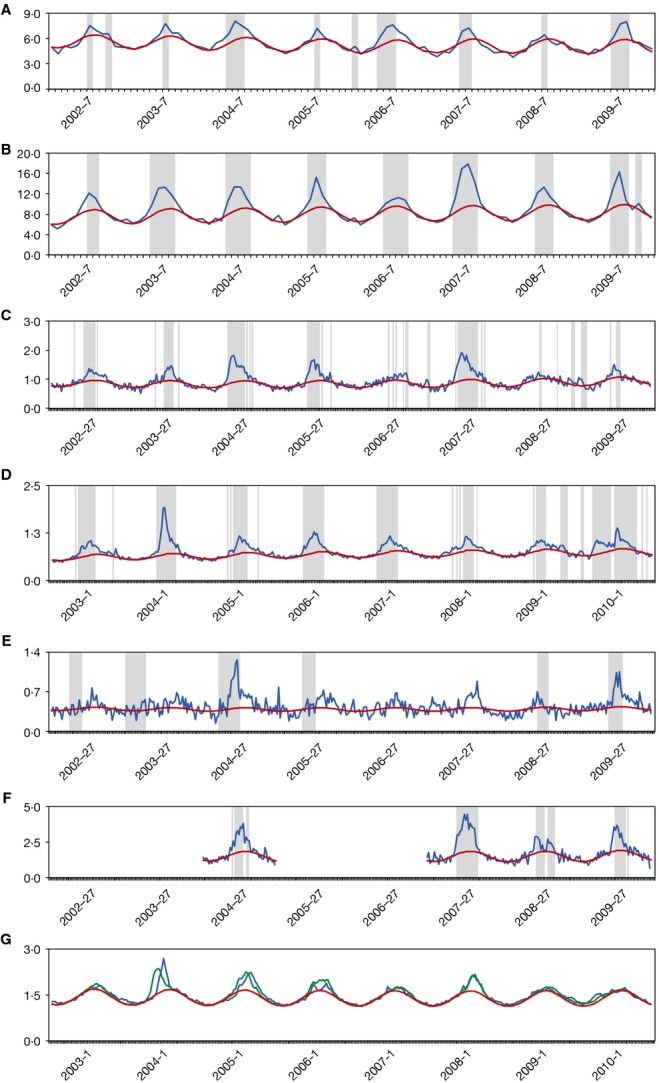
(A–G) Time series of monthly (A, B) or weekly (C–G) mortality rates coded as respiratory and circulatory causes from January 2002 through December 2009 (July 2002 through June 2010 for Mexico and United States). Blue line: observed mortality rates; red line: baseline rates predicted by a regression model; green line: predicted mortality rates. Periods highlighted in purple mark seasonal influenza epidemic periods. Y-axis: death rate (100 000 per person-years). (A) Argentina; (B) southern Brazil; (C) Chile; (D) Mexico; (E) Paraguay; (F) Uruguay; (G) United States.
Applying the proportions of respiratory and circulatory deaths to the crude number of respiratory and circulatory deaths in 13 tropical countries and north Brazil with robust mortality data but poorly defined seasonality, we estimated a mean of 11 460 (range: 1320–29 494) influenza-associated respiratory deaths and 12 322 (range 1677–32 944) influenza-associated circulatory deaths per year (Table2).
Table 2.
Imputed number of influenza deaths for 13 countries/regions* with no defined seasonality mortality data, 2002–2008
| Age group | Respiratory | Circulatory | ||||||||||||
|---|---|---|---|---|---|---|---|---|---|---|---|---|---|---|
| All-cause deaths (N) | Base proportion | Influenza deaths | All-cause deaths (N) | Base proportion | Influenza deaths | |||||||||
| Mean | 5% | 95% | Mean | 5% | 95% | Mean | 5% | 95% | Mean | 5% | 95% | |||
| <65 | 48 468 | 7·4 | 0·7 | 18·3 | 3587 | 339 | 8870 | 123 817 | 2·2 | 0·3 | 5·7 | 2724 | 371 | 7058 |
| 65–74 | 26 390 | 7·2 | 1·0 | 18·1 | 1900 | 264 | 4777 | 92 358 | 2·6 | 0·3 | 7·1 | 2401 | 277 | 6557 |
| ≥75 | 79 638 | 7·5 | 0·9 | 19·9 | 5973 | 717 | 15 848 | 205 625 | 3·5 | 0·5 | 9·4 | 7197 | 1028 | 19 329 |
| Total | 154 495 | n.a. | n.a. | n.a. | 11 460 | 1320 | 29 494 | 421 799 | n.a. | n.a. | n.a. | 12 322 | 1677 | 32 944 |
Countries/regions include Barbados, north Brazil, Colombia, Costa Rica, Ecuador, El Salvador, Guatemala, Guyana, Nicaragua, Panama, Peru, Saint Lucia, and Venezuela.
The 15 remaining PAHO countries comprised <8% of the total population of the PAHO region and fell into three WHO mortality categories: A (N = 1), B (N = 12), and D (N = 2). Of the 20 countries with calculated influenza mortality rates, Canada (N = 1) fell into mortality stratum A, Antigua and Barbuda, Bahamas, Belize, Dominica, Dominican Republic, Grenada, Honduras, Jamaica, Saint Kitts and Nevis, Saint Vincent and Grenadines, Suriname, Trinidad and Tobago (N = 12) in stratum B, and Bolivia and Haiti (N = 2) in stratum D, respectively. Applying the age-specific respiratory and circulatory (R&C) death rates in countries with estimates in each stratum to those without these, we estimated an extra 533 influenza-associated R&C deaths among persons aged 0–64 years in stratum A, 477 in stratum B, and 498 in stratum C. Among persons aged 65–74 years, we estimated an additional 672 influenza-associated R&C deaths in stratum A, 303 in stratum B, and 207 in stratum C countries. Finally, in the ≥75-year age group, we estimated 3518 additional influenza deaths in stratum A, 1037 in stratum B, and 572 in stratum D countries (Table S2).
Influenza-associated mortality in the PAHO region
We summed the average number of influenza-associated respiratory and circulatory deaths in each age stratum calculated for each country by year from 2002 to 2008, either via modeling, etiologic fraction applied to mortality data, or extrapolation. On average, a mean (95% CI) of 16 755 (5822–34 797) influenza deaths occurred in persons 0–64 years, 13 541 in persons 65–74 years (5512–27 837), and 54 804 (29 547–97 636) in persons aged ≥75 years. An estimated total 85 100 (40 880–160 270) persons died every year as a result of influenza in the PAHO region, for a rate of 10 influenza deaths per 100 000 person-years (Table3). The mean annual influenza mortality in PAHO region by country (2002–2008) is shown in Figure2.
Table 3.
Influenza-associated deaths and death rates for the region
| Age group | Influenza deaths | Influenza death rates | ||||
|---|---|---|---|---|---|---|
| Mean | 5% | 95% | Mean | 5% | 95% | |
| <65 | 16 755 | 5822 | 34 797 | 2·1 | 0·7 | 4·3 |
| 65–74 | 13 541 | 5512 | 27 837 | 31·9 | 13·0 | 65·7 |
| ≥75 | 54 804 | 29 547 | 97 636 | 161·8 | 87·2 | 288·3 |
| Total | 85 100 | 40 880 | 160 270 | 9·6 | 4·6 | 18·1 |
Figure 2.
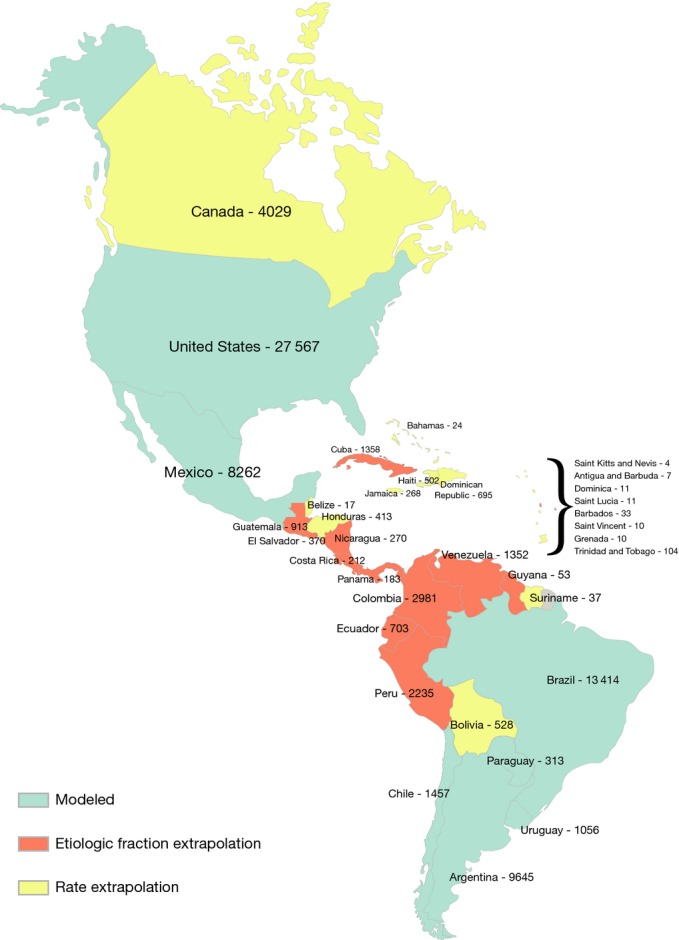
Mean annual influenza mortality in Pan American Health Organization (PAHO) region, 2002–2008.
Sensitivity analyses
The influenza-associated mortality estimated through the negative binomial and Serfling models were similar for the United States, especially for the older age group (Table S3).
The influenza-associated mortality estimated through modeling and extrapolation methods were also similar (Table S4), although the extrapolation approaches did generate influenza-associated rates with wider 95% CI.
Discussion
We attempted to estimate the number of annual influenza deaths in the Americas via a novel method: calculating excess mortality from countries with robust vital statistic data and applying the average etiologic fraction to the remaining countries in the region where influenza-specific estimates could not be obtained, either because of lack of clear seasonality, absence of viral data, or absence of mortality data. We estimate that annually between 40 880 and 160 270 persons (mean 85 100) died due to influenza in the PAHO region during 2002–2008 and that 81% of all deaths occurred among persons aged ≥65 years, of which the majority occurred among the ≥75-year age group, who experience the highest rate of influenza mortality, almost five times that of the 65–74 age group. Forty thousand influenza deaths were respiratory-related and 45 000 deaths were circulatory-related.
We also found that year-to-year variability in excess influenza mortality was larger than differences between countries. In any one calendar year, the influenza-specific mortality estimates generated using traditional techniques correlated very poorly between the seven countries with available data. Other than Paraguay and Mexico, which implemented influenza vaccination in 2004 and 2005, respectively, the remaining five countries used vaccine throughout the study period.25 Moreover, vaccine coverage cannot explain the differences between countries. For instance, both Argentina and Chile report vaccination coverage of >95% among the elderly, yet we estimate quite different influenza-associated mortality rates, although these were not statistically different. Baseline levels of respiratory and circulatory mortality between country, health system, and availability of treatment may be more important in explaining differences between countries.
Our findings were comparable with influenza mortality estimates from previous publications (Table S5). Indeed, our estimates obtained through regression models were comparable to those generated through extrapolation (Table S4).
Our analysis is subject to several limitations. First, we assumed that the etiologic fraction of R&C deaths attributable to influenza from seven temperate countries was applicable to other countries, including tropical countries. This approach assumes that as R&C mortality varies for reasons such as income level and healthcare access, and as these reasons apply equally to other causes of R&C mortality the proportion attributable to influenza stays constant. We used a similar approach to estimate pandemic mortality in 2009.26 One violation of this assumption would be vaccination. In addition to being of higher income, our base countries generally had more established vaccination programs than did the tropical countries. All of the seven countries had introduced vaccination among the elderly, with coverage rates of 29–93% in the study period. However, most PAHO countries had introduced influenza vaccination by 2010;8 therefore, although the application of an etiologic fraction from a more vaccinated population such as in the seven-country baseline may lead to an underestimate of the burden in the study period, our method may be more representative of burden in the future as vaccination coverage increases. Conversely, in some countries there may have been a secular decreasing trend of respiratory and circulatory mortality since 2002, and because our influenza estimate relies on this denominator, we may have overestimated influenza burden in the future. However, this trend is most marked in young children, and not adults.
Second, the relatively short period of mortality data analyzed from our seven baseline countries may not accurately reflect influenza activity in all countries over time. Influenza activity and strain circulation are often highly variable between countries. Much of the variation found may have been due to an imbalance of high or low mortality in any one country. For instance, H3N2 subtypes are reported to cause 2·7 times more mortality than other strains.27 However, we found substantial year-to-year variation of influenza mortality in the seven countries, as well as country-to-country differences. The combination of year-on-year difference in circulation and intercountry variation in baseline respiratory mortality rates likely captures much of the variation in the PAHO region. Third, our regression model was challenged by the absence of viral data, so we turned to pneumonia and influenza mortality seasonal increases as a proxy for influenza activity. This approach has been used in other studies,21,28 but assumes that the patterns of influenza viral data were similar to those of P&I death data. Fourth, we attribute all the excess mortality that occurred during the influenza epidemic periods to the influenza virus and some deaths are likely misattributed to influenza rather than respiratory syncytial virus (RSV), which may co-circulate. Although RSV causes most disease in young children and therefore would not have much impact on this estimate, some studies have suggested that RSV may cause substantial mortality in the elderly.29 Fifth, the assumption that the under-registered deaths were evenly distributed among ICD codes may not be true.
Influenza remains a major cause of mortality among persons of all ages in the PAHO region, but especially the elderly. Continued seasonal vaccination remains a reasonable strategy to mitigate this burden, with focus on increasing coverage especially in the ≥75-year-old group at more risk, and exploring new – and possibly more effective – vaccines, such as those with higher antigen content or delivered intradermally. Most countries should enhance virologic surveillance to better understand influenza circulation and seasonality to determine best timing of vaccination with the most updated vaccine formulation as recommended by WHO. This applies especially to countries that may have year-round circulation, which may even consider year-round vaccination. Further research is needed to assess the full burden of influenza on mortality, hospitalization, and economic burden of influenza, as well as the impact of different schedules and vaccines in the region.
Acknowledgments
We would like to acknowledge the contribution, support, and encouragement of Alba María Ropero, Regilo de Souza, Jose Escamilla, Antonio Sanheusa, Patrick Glew, and David Shay. In memory of Alexander Klimov, friend and mentor, March 25, 1943–February 5, 2013.
CDC disclaimer
The opinions expressed by authors contributing to this journal do not necessarily reflect the opinions of the Centers for Disease Control and Prevention or the institutions with which the authors are affiliated.
Author contributions
PYC, RP, EAB, and MAW all contributed to the study design. RP, OO, and MFMS collected and provided the data used for the analysis. PYC, RP, and EAB did the data analysis. PYC, RP, EAB, DI, APA, MFMS, and MAW interpreted the data. PYC, RP, and EAB drafted the manuscript. All authors reviewed and approved the final version.
Conflict of interests
The authors have no conflict of interests to declare.
Supporting Information
Table S1. Proportion of crude respiratory and circulatory deaths due to influenza, 2002–2008.
Table S2. Imputed number of influenza deaths for countries without mortality data.
Table S3. Comparison of mean annual influenza-associated mortality rate (per 100 000 person-years) for the US by using two different models.
Table S4. Comparison of mean influenza-associated mortality rate (per 100 000 person-years) for Mexico from three approaches.
Table S5. Comparison of the estimates of influenza-associated mortality [rate (95% CI) per 100 000 person-years and deaths (95% CI)] from this study with those from the literature.
Data S1. Excess mortality models.
References
- Lozano R, Naghavi M, Foreman K, et al. Global and regional mortality from 235 causes of death for 20 age groups in 1990 and 2010: a systematic analysis for the Global Burden of Disease Study 2010. Lancet. 2012;380:2095–2128. doi: 10.1016/S0140-6736(12)61728-0. [DOI] [PMC free article] [PubMed] [Google Scholar]
- Nair H, Nokes DJ, Gessner BD, et al. Global burden of acute lower respiratory infections due to respiratory syncytial virus in young children: a systematic review and meta-analysis. Lancet. 2010;375:1545–1555. doi: 10.1016/S0140-6736(10)60206-1. [DOI] [PMC free article] [PubMed] [Google Scholar]
- World Health Organization. Influenza. Fact sheet N°2112013. Available at http://www.who.int/mediacentre/factsheets/fs211/en/ (Accessed 29 May 2015)
- Poehling KA, Edwards KM, Weinberg GA, et al. The underrecognized burden of influenza in young children. N Engl J Med. 2006;355:31–40. doi: 10.1056/NEJMoa054869. [DOI] [PubMed] [Google Scholar]
- Thompson WW, Shay DK, Weintraub E, et al. Mortality associated with influenza and respiratory syncytial virus in the United States. JAMA. 2003;289:179–186. doi: 10.1001/jama.289.2.179. [DOI] [PubMed] [Google Scholar]
- Glezen WP, Greenberg SB, Atmar RL, Piedra PA, Couch RB. Impact of respiratory virus infections on persons with chronic underlying conditions. JAMA. 2000;283:499–505. doi: 10.1001/jama.283.4.499. [DOI] [PubMed] [Google Scholar]
- Schanzer DL, Langley JM, Tam TW. Co-morbidities associated with influenza-attributed mortality, 1994–2000, Canada. Vaccine. 2008;26:4697–4703. doi: 10.1016/j.vaccine.2008.06.087. [DOI] [PubMed] [Google Scholar]
- Ropero-Alvarez AM, Kurtis HJ, Danovaro-Holliday MC, Ruiz-Matus C, Andrus JK. Expansion of seasonal influenza vaccination in the Americas. BMC Public Health. 2009;9:361. doi: 10.1186/1471-2458-9-361. [DOI] [PMC free article] [PubMed] [Google Scholar]
- 2012. Vaccine against influenza WHO position paper – November 2012. Available at http://www.who.int/wer/2012/wer8747.pdf?ua=1 (Accessed 29 May 2015)
- Kostova D, Reed C, Finelli L, et al. Influenza illness and hospitalizations averted by influenza vaccination in the United States, 2005–2011. PLoS ONE. 2013;8:e66312. doi: 10.1371/journal.pone.0066312. [DOI] [PMC free article] [PubMed] [Google Scholar]
- PAHO. PAHO Revolving Fund. Available at http://www.paho.org/hq/index.php?option=com_content&view=article&id=1864&Itemid=2234&lang=en (Accessed 29 May 2015)
- Centers for Disease Control and Prevention. 2013. High-dose fluzone results presented to ACIP meeting.
- PAHO. Mortality data for Health in the Americas 2012. Available at http://www.paho.org/hq/index.php?option=com_content&view=article&id=5605%3Amortality-data-health-americas-2012&catid=2391%3Arho-databases&Itemid=2392&lang=en (Accessed 29 May 2015)
- Mahapatra P, Chalapati Rao PV. Cause of death reporting systems in India: a performance analysis. Natl Med J India. 2001;14:154–162. [PubMed] [Google Scholar]
- Mathers CD, Fat DM, Inoue M, Rao C, Lopez AD. Counting the dead and what they died from: an assessment of the global status of cause of death data. Bull World Health Organ. 2005;83:171–177. [PMC free article] [PubMed] [Google Scholar]
- Azziz Baumgartner E, Dao CN, Nasreen S, et al. Seasonality, timing, and climate drivers of influenza activity worldwide. J Infect Dis. 2012;206:838–846. doi: 10.1093/infdis/jis467. [DOI] [PubMed] [Google Scholar]
- United States Census Bureau. 2013. Population estimates. Available at http://www.census.gov/popest/ (Accessed 18 October 2013)
- Instituto Brasileiro de Geografia e Estatistica. 2013. 2010 Population census. Available at http://www.ibge.gov.br/english/estatistica/populacao/censo2010/ (Accessed 29 May 2015)
- Thompson WW, Comanor L, Shay DK. Epidemiology of seasonal influenza: use of surveillance data and statistical models to estimate the burden of disease. J Infect Dis. 2006;194(Suppl 2):S82–S91. doi: 10.1086/507558. [DOI] [PubMed] [Google Scholar]
- Charu V, Chowell G, Palacio Mejia LS, et al. Mortality burden of the A/H1N1 pandemic in Mexico: a comparison of deaths and years of life lost to seasonal influenza. Clin Infect Dis. 2011;53:985–993. doi: 10.1093/cid/cir644. [DOI] [PMC free article] [PubMed] [Google Scholar]
- Cohen C, Simonsen L, Kang JW, et al. Elevated influenza-related excess mortality in South African elderly individuals, 1998–2005. Clin Infect Dis. 2010;51:1362–1369. doi: 10.1086/657314. [DOI] [PMC free article] [PubMed] [Google Scholar]
- WHO FluNet. 2013. WHO FluNet. Available at http://www.who.int/influenza/gisrs_laboratory/flunet/en/ (Accessed 29 May 2015)
- Centers for Disease Control and Prevention. 2013. FLUView. Available at: http://www.cdc.gov/flu/weekly/ (Accessed 29 May 2015)
- World Health Organization. 2013. List of member states by WHO region and mortality stratum. Available at http://www.who.int/choice/demography/mortality_strata/en/index.html (Accessed 29 May 2015)
- PAHO. 2013. Influenza vaccine composition and year of introduction. Available at http://www.paho.org/hq/index.php?option=com_docman&task=doc_view&gid=16018&Itemid=4318&lang=es (Accessed 29 May 2015)
- Dawood FS, Iuliano AD, Reed C, et al. Estimated global mortality associated with the first 12 months of 2009 pandemic influenza A H1N1 virus circulation: a modelling study. Lancet Infect Dis. 2012;12:687–695. doi: 10.1016/S1473-3099(12)70121-4. [DOI] [PubMed] [Google Scholar]
- Centers for Disease Control and Prevention. Estimates of deaths associated with seasonal influenza – United States, 1976–2007. MMWR Morb Mortal Wkly Rep. 2010;59:1057–1062. [PubMed] [Google Scholar]
- Clara W, Armero J, Rodriguez D, et al. Estimated incidence of influenza-virus-associated severe pneumonia in children in El Salvador, 2008–2010. Bull World Health Organ. 2012;90:756–763. doi: 10.2471/BLT.11.098202. [DOI] [PMC free article] [PubMed] [Google Scholar]
- van Asten L, van den Wijngaard C, van Pelt W, et al. Mortality attributable to 9 common infections: significant effect of influenza A, respiratory syncytial virus, influenza B, norovirus, and parainfluenza in elderly persons. J Infect Dis. 2012;206:628–639. doi: 10.1093/infdis/jis415. [DOI] [PubMed] [Google Scholar]
Associated Data
This section collects any data citations, data availability statements, or supplementary materials included in this article.
Supplementary Materials
Table S1. Proportion of crude respiratory and circulatory deaths due to influenza, 2002–2008.
Table S2. Imputed number of influenza deaths for countries without mortality data.
Table S3. Comparison of mean annual influenza-associated mortality rate (per 100 000 person-years) for the US by using two different models.
Table S4. Comparison of mean influenza-associated mortality rate (per 100 000 person-years) for Mexico from three approaches.
Table S5. Comparison of the estimates of influenza-associated mortality [rate (95% CI) per 100 000 person-years and deaths (95% CI)] from this study with those from the literature.
Data S1. Excess mortality models.