

Abstract
Introduction
Influenza is a major cause of morbidity and mortality in elderly persons. Fever is included in all standard definitions of influenza-like illness (ILI), yet older patients may have diminished febrile response to infection. Therefore, we examined the utility of various thresholds to define fever for case definitions of influenza in persons ≥65 years of age.
Methods
Data from two prospective surveillance studies for respiratory viral infection in adults hospitalized with acute cardiopulmonary illnesses with or without fever were examined. The highest temperature reported prior to admission or measured during the first 24 h after admission was recorded. The diagnosis of influenza was made by a combination of viral culture, reverse-transcription polymerase chain reaction, antigen testing, and serology.
Results
A total of 2410 subjects (66% ≥65 years of age) were enrolled; 281 had influenza (261 influenza A, 19 influenza B, and one mixed influenza A and B). The commonly used definition of ILI (fever ≥37·8°C and cough) resulted in 57% sensitivity and 71% specificity in older adults. Receiver operating characteristic curves examining the various temperature thresholds combined with cough and/or sore throat showed the optimal balance between sensitivity and specificity to be 37·9°C (AUC 0·71) and 37·3°C (AUC 0·66), in younger and older persons, respectively.
Conclusion
Clinical decision rules using the presence of cough and fever may be helpful when screening for influenza or empiric antiviral treatment when rapid influenza testing is not available; however, lower fever thresholds may be considered for elderly subjects.
Keywords: Clinical case definition, elderly, fever, influenza
Introduction
Influenza is a major cause of morbidity and mortality in all age groups, with elderly persons being at high risk for serious sequelae.1 The availability of rapid and very sensitive molecular tests has significantly improved the ability of clinicians and researchers to more accurately diagnose influenza.2 However, molecular testing is not available in all situations, particularly outpatient settings, and testing of every patient admitted to the hospital during the winter months is impractical. Thus, a clinical case definition of influenza is highly desirable. A clinical case definition could be used to select patients for definitive influenza testing as well as initiation of empiric antiviral treatment and for respiratory isolation in inpatient settings. In the research setting, case definitions have been used in epidemiologic studies to track influenza outbreaks and burden of disease, to determine vaccine effectiveness, and to select subjects in trials of antiviral agents.3
Traditionally, influenza-like illness (ILI) is defined by the US Centers for Disease Control and Prevention (CDC) as fever (≥37·8°C) and cough and/or sore throat.1 A number of published studies have examined the utility of clinical case definitions for influenza.4–14 However, subject age, severity of illness, definitions of fever, the diagnostic tests used to confirm influenza infection, and the prevalence of influenza vary widely in these studies. Some studies were designed primarily to evaluate vaccine or drug efficacy and almost all used symptom-based case definitions for testing, making interpretation of secondary analyses of clinical case definitions difficult. Using pooled data from several large antiviral trials, Monto et al.5 found that the presence of fever and cough yielded a positive predictive value (PPV) of 79% in young adults when influenza was prevalent in the community. The value of clinical case definitions, particularly those requiring fever, has been questioned for use in older adults due to poor sensitivity and specificity, and a threshold of 37·2°C has been suggested for use in this age group.15 Frail elderly patients may have diminished febrile responses, exacerbations of chronic medical conditions may dominate the clinical presentation, and cognitive deficits may impair the ability to communicate specific symptoms.
Therefore, we sought to examine the utility of various signs and symptoms in adults participating in two viral surveillance studies of hospitalized patients spanning 7 years. Inclusion criteria for participation were very broad and did not require the presence of fever, allowing examination of the impact of temperature on the clinical influenza case definition in persons <65 years of age, and in those aged 65 and older.
Methods
Study design
Data from two prospective surveillance studies for respiratory viral infection in adults hospitalized with acute cardiopulmonary illnesses were used for the current post hoc analysis.16,17 The studies encompassed seven winters (November 1 through May 30) in 1999–2003 and 2008–2011 and used very similar enrollment criteria and laboratory methods, with the minor differences outlined below.
Subjects
In study 1, adults over 65 years of age as well as younger adults with underlying cardiopulmonary diseases were enrolled. In study 2, all adults over 21 years were enrolled. In both studies, subjects were patients with acute cardiopulmonary illnesses who were admitted to Rochester General Hospital (RGH), in Rochester, NY, USA. RGH is a 528-bed general medical–surgical community hospital that provides care to a broad socioeconomic and ethnically diverse population. Persons with diagnoses or symptoms consistent with acute respiratory tract infection (community-acquired pneumonia, acute exacerbation of chronic obstructive pulmonary disease, acute bronchitis, asthma exacerbation, viral syndrome, influenza, respiratory failure and congestive heart failure, shortness of breath, fever) were eligible in both study 1 and study 2. Inclusion criteria were intended to be very broad and did not require fever, but excluded subjects if they were immunosuppressed, had witnessed aspiration events, or had cavitary lung disease. Patients were screened by reviewing the daily admission census, from 8 am to 6 pm Monday through Friday, and all subjects meeting study criteria were consecutively enrolled within 24 h of admission. Each subject or a legal guardian provided written informed consent. The studies were approved by the institutional review boards of the University of Rochester and RGH.
Illness evaluation
Demographic, clinical, and laboratory information was collected at enrollment. Symptom data were obtained by direct subject interview, caregiver interview, and review of the admitting provider’s note in the medical record. Vital signs were obtained from the medical record at enrollment. The highest temperature reported by the subject prior to admission or the highest measured temperature during the first 24 h after admission was recorded. Oral digital thermometers were used to record temperatures in the hospital. If a patient could not cooperate with an oral measurement, axillary readings were recorded. Nose and throat swabs in both studies and sputum in study 2 were collected for influenza testing, and sera were collected on admission and 4–6 weeks later for influenza serology.
Laboratory methods
Viral culture
Viral culture for influenza was performed in study 1. Nose and throat swabs were inoculated into tubes of rhesus monkey kidney cells within 4 h after collection and examined daily for cytopathic effects in the clinical microbiology laboratory. Viral growth was confirmed by indirect immunofluorescence using monoclonal antibodies specific for influenza virus A and B. Rapid antigen testing was performed using Directogen kits (Becton Dickinson, Franklin Lakes, NJ, USA).
Reverse-transcription polymerase chain reaction
The reverse-transcription polymerase chain reaction (RT-PCR) assay used in study 1 was a single-tube nested reaction with a gel electrophoresis readout, and study 2 utilized real-time RT-PCR.17,18 Both assays used primers from the conserved influenza A matrix gene and influenza B NS1 gene.
Serology
Enzyme immunoassay was used to measure serum immunoglobulin G responses to influenza A and B antigens using influenza virus-infected whole-cell lysates in the solid phase, as previously described.19 A rise of fourfold or more in viral-specific immunoglobulin G was considered evidence of infection.
Definition of influenza infection
Influenza infections were defined as illnesses with a positive viral culture, a positive RT-PCR assay, or a diagnostic serologic result.
Statistical analysis
Categorical and continuous distributions were compared using Fisher’s exact tests and Student’s t-tests, respectively. Receiver operating characteristic (ROC) curves relating temperature to influenza were computed using the trapezoidal approximation to estimate the area. Sensitivity, specificity, PPV, and negative predictive value (NPV) were calculated for various clinical case definitions.
Results
A total of 2410 subjects were enrolled: 1568 in study 1 and 842 in study 2 (Figure1 and Table1). Approximately two-thirds (66·4%) of the subjects were over 65 years of age with an age range of 21–96 years. There was a high rate of chronic medical conditions among subjects, including congestive heart failure (30%), chronic obstructive pulmonary disease (52%), and diabetes mellitus (31%). Two hundred and eighty-one patients were diagnosed with influenza (261 with influenza A, 19 with influenza B, and one with mixed influenza A and B). Of the documented influenza infections, 123 (44%) were culture positive, 179 (64%) were RT-PCR positive, and 177 (63%) were seropositive, with most subjects having more than one test positive. During the seven seasons of surveillance, influenza H3N2 dominated in two seasons, H1N1 dominated in four seasons, and one season was mixed. The mean highest temperature was significantly higher in H3N2-dominant seasons compared with H1N1-dominant seasons (38·2°C ± 1·1 versus 37·8°C ± 1·1, P = 0·008).
Figure 1.
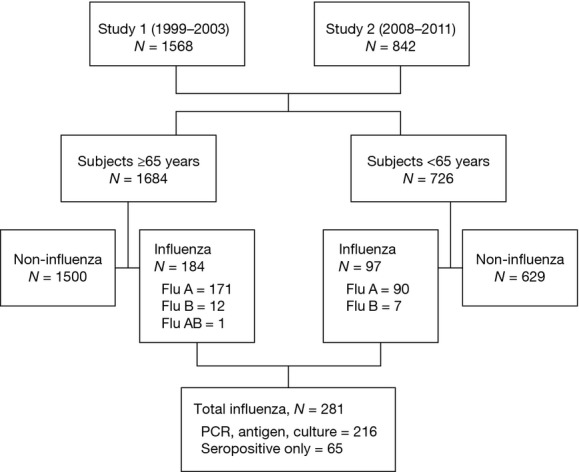
Study flow chart of subjects in studies 1 and 2.
Table 1.
Study population characteristics
| Characteristic | N = 2410 |
|---|---|
| Age (mean ± SD) | 72 ± 15 |
| Female, n (%) | 1325 (55) |
| Race/ethnicity, n (%) | |
| White | 1925 (81) |
| Black | 362 (15) |
| Hispanic | 169 (7) |
| Chronic medical conditions, n (%) | |
| Diabetes mellitus | 747 (31) |
| Congestive heart failure | 723 (30) |
| Lung disease | 1446 (60) |
| Active or past smoker, n (%) | 1783 (74) |
| Influenza vaccination, n (%) | 1832 (76) |
The presenting signs and symptoms of subjects younger and older than 65 years of age were compared and demonstrated several significant differences (Figure2). Older subjects less commonly complained of systemic symptoms (myalgias, fatigue, and feverishness) and more often had abnormal lung examinations than did younger subjects. However, the mean highest recorded temperature was identical in both groups (38·1°C) and the percentage of subjects with documented temperature of at least 37·8°C in the two groups were not significantly different. Older patients also had significantly lower oxygen saturation (88·9 ± 6·7% versus 91·0 ± 7·0%) and presented to the hospital earlier (5·0 ± 5·9 versus 7·0 ± 4·2 days) than did younger individuals. Of note, documented bacterial complications were similar in younger and older patients.
Figure 2.
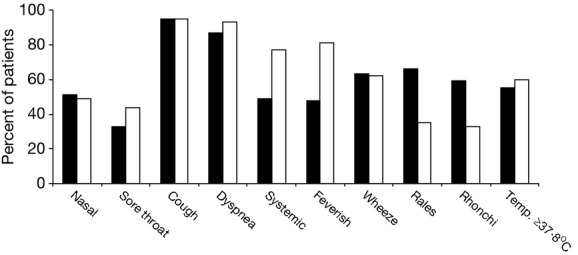
Clinical features of influenza in young and elderly subjects with documented influenza. Bars indicate the percentage of subjects with the findings: black bars, subjects ≥65 years of age; white bars, subjects <65 years of age.
A further analysis of the clinical characteristics of older patients by decade of life (ages 65–74, 75–84, and >85 years) showed a surprising trend toward increasing mean temperature (37·6°C ± 1·2, 38·0°C ± 1·1, and 38·2°C ± 1·0), respectively. The difference in mean temperature was significant when we compared the youngest and oldest decade, P = 0·006, with the only other clinical difference noted being that underlying chronic obstructive pulmonary disease was less common in patients over age 85 (64% versus 26%, P < 0·001).
The clinical features of older subjects were further examined by comparing subjects aged 65 years and older with documented influenza versus those with non-influenza illnesses (Table2). Those symptoms generally associated with influenza infection (nasal congestion, sore throat, cough, and constitutional symptoms) were all significantly more common among patients infected with influenza. Wheezing and rhonchi on physical examination were also more frequently seen in those with documented influenza. Multiple measures of fever, including a history of feverishness and various cut points for highest recorded temperature, were more common in patients infected with influenza. Using a cut point of ≥37·2 or ≥37·8°C to define fever yielded significant differences (P = 0·0001) between patients with influenza and patients with non-influenza illnesses. However, it should be noted that only 55% of patients infected with influenza had a temperature ≥37·8°C, whereas 78% had a temperature ≥37·2°C.
Table 2.
Clinical features of elderly adults hospitalized with influenza versus non-influenza illness
| Characteristic | Influenza N = 184 | Non-influenza N = 1500 | P-value |
|---|---|---|---|
| Nasal congestion, n (%) | 93 (51) | 604 (40) | 0·009 |
| Sore throat, n (%) | 60 (33) | 284 (19) | 0·0001 |
| Hoarse, n (%) | 48 (26) | 340 (23) | n.s. |
| Cough, n (%) | 176 (96) | 1283 (86) | 0·0001 |
| Sputum production, n (%) | 127 (69) | 975 (65) | n.s. |
| Dyspnea, n (%) | 160 (87) | 1408 (94) | n.s. |
| Constitutional symptoms, n (%) | 88 (48) | 507 (34) | 0·0002 |
| Feverish, n (%) | 118 (64) | 574 (38) | 0·0001 |
| Wheeze, n (%) | 115 (63) | 814 (54) | 0·03 |
| Rales, n (%) | 122 (66) | 971 (65) | n.s. |
| Rhonchi, n (%) | 108 (59) | 648 (43) | 0·0001 |
| No. of days ill, mean ± SD | 5·0 ± 5·9 | 5·9 ± 6·3 | n.s. |
| Temperature, mean ± SD | 38·1 ± 1·1 | 37·4 ± 1·0 | 0·0001 |
| Respiratory rate, mean ± SD | 27 ± 7 | 27 ± 8 | n.s. |
| Pulse, mean ± SD | 102 ± 21 | 102 ± 22 | n.s. |
| SaO2, mean ± SD | 88·9 ± 6·7 | 89·4 ± 7·6 | n.s. |
| Temp. ≥37·8°C, n (%) | 102 (55) | 475 (32) | 0·0001 |
| Temp. ≥37·2°C, n (%) | 144 (78) | 804 (54) | 0·0001 |
SaO2, arterial oxygen saturation; SD, standard deviation.
The predictive values of various symptoms and signs were then examined in all hospitalized subjects using different fever thresholds and ROC curves developed for each temperature level (Table3). The presence of fever ≥37·8°C alone demonstrated modest sensitivity and specificity. As expected, the sensitivity decreased and specificity increased as higher cut points are used to define fever. If a history of feverishness was accepted in addition to documented temperature, the sensitivity increased but specificity was negatively affected. The presence of cough or any respiratory symptom was nearly 100% sensitive but had very poor specificity (1%). However, the lack of fever or cough had excellent NPV (100%). The commonly used definition of ILI (fever of ≥37·8°C and cough) resulted in approximately 55% sensitivity and 73% specificity. The addition of sore throat to the symptom complex did not add diagnostic value in these hospitalized adults. Of note, when patients over 65 years of age were specifically evaluated, the overall sensitivity, specificity, PPV, and NPV did not change significantly (Table4).
Table 3.
Operating characteristics of different signs and symptoms for diagnosis of influenza for all subjects hospitalized with influenza
| Symptom | Sensitivity % (95% CI) | Specificity % (95% CI) | PPV % (95% CI) | NPV % (95% CI) |
|---|---|---|---|---|
| Temp. ≥37·8°C | 57 (51–63) | 71 (68–72) | 20 (18–23) | 93 (91–94) |
| Temp. >37·5°C | 68 (62–73) | 61 (58–63) | 19 (16–21) | 94 (92–93) |
| Temp. >37·2°C | 79 (74–84) | 48 (44–50) | 17 (15–19) | 95 (93–96) |
| Temp. ≥37·8°C + feverish | 79 (74–84) | 48 (46–50) | 17 (15–19) | 95 (93–96) |
| Temp. >37·5°C + feverish | 84 (79–88) | 42 (40–44) | 16 (14–18) | 95 (94–96) |
| Temp. >37·2°C + feverish | 90 (86–93) | 34 (32–36) | 15 (13–17) | 96 (94–97) |
| Cough | 95 (92–98) | 13 (12–14) | 13 (11–14) | 96 (92–98) |
| Any respiratory symptom | 100 (99–100) | 1 (0·8–2) | 12 (11–13) | 100 (86–100) |
| Temp. ≥37·8°C + cough | 55 (49–61) | 73 (71–75) | 21 (18–25) | 93 (91–94) |
| Temp. ≥37·8°C + cough or sore throat | 56 (50–61) | 73 (71–75) | 21 (18–24) | 93 (91–94) |
| Temp. ≥37·8°C or feverish + cough | 81 (76–86) | 51 (49–54) | 18 (16–20) | 95 (94–97) |
| Temp. >37·5°C or feverish + cough | 82 (77–86) | 47 (45–49) | 17 (15–19) | 95 (94–96) |
| Any systemic + any respiratory | 79 (74–84) | 44 (42–46) | 16 (14–18) | 94 (92–95) |
CI, confidence interval; NPV, negative predictive value; PPV, positive predictive value.
Table 4.
Operating characteristics of different signs and symptoms for diagnosis of influenza for subjects ≥65 years of age
| Symptom | Sensitivity % (95% CI) | Specificity % (95% CI) | PPV % (95% CI) | NPV % (95% CI) |
|---|---|---|---|---|
| Any respiratory symptom | 100 (98–100) | 1 (0·8–2·0) | 10 (8–10) | 100 (83–100) |
| Temp. ≥37·8°C + cough or sore throat | 54 (46–61) | 71 (69–73) | 19 (15–22) | 93 (91–94) |
| Temp. ≥37·8°C or feverish + cough | 76 (69–82) | 55 (52–57) | 17 (15–20) | 95 (93–96) |
| Temp. >37·5°C or feverish + cough | 78 (72–84) | 50 (48–53) | 16 (14–19) | 95 (93–96) |
CI, confidence interval; NPV, negative predictive value; PPV, positive predictive value.
The average duration of symptoms prior to hospitalization was 5 days, and it is possible that those diagnosed by serologic means alone represent a later stage of illness when fever may be a less meaningful criterion for clinical case definitions. The mean temperature for those having influenza defined by culture, antigen, or PCR was higher compared with those who were defined serologically (38·1°C ± 1·2 versus 37·7°C ± 1·0, P = 0·009). However, if this group were analyzed separately, the traditional ILI criteria of 37·8°C plus cough or sore throat resulted in same sensitivity, specificity, PPV, and NPV as the group as a whole.
Because the use of fever for the influenza case definition remains a specific concern in older adults, we constructed an ROC curve examining the diagnostic accuracy of temperature for influenza in individuals younger and older than 65 years of age with the presence of cough and/or sore throat (Figure3). This analysis shows that an optimal prediction threshold for persons aged 65 years and over is when fever is defined at a temperature ≥37·3°C. At this threshold, the sensitivity is 77% and the specificity is 49%. In this population, the ROC curve had an area under the curve (AUC) of 0·66. This is in contrast to the ROC curve for adults under 65 years of age, in which an optimal temperature threshold of ≥37·9°C is defined, resulting in a sensitivity of 57% and a specificity of 76%. The area under the ROC curve is modestly improved to 0·71 in this population.
Figure 3.
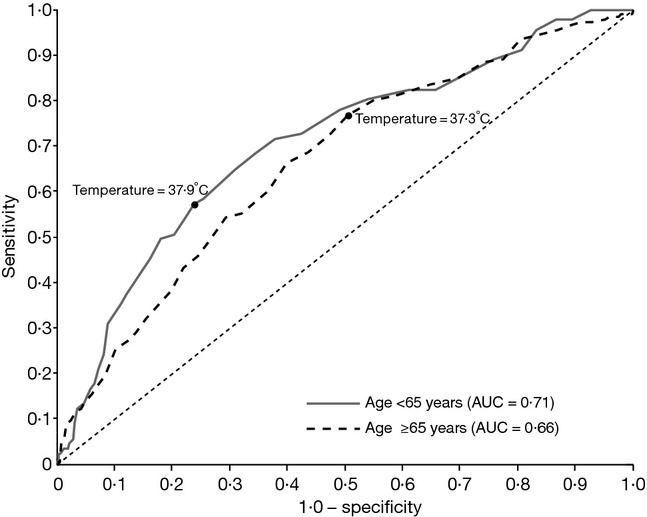
Receiver operating characteristic curves of classification of influenza using temperature in subjects <65 years of age (N = 660) and ≥65 years of age (N = 1456). AUC, area under the curve.
Discussion
Our data confirm previous studies demonstrating several differences in the presentation of influenza in young and older adults. Yet, these differences were relatively modest in hospitalized subjects. It was not unexpected that the young complained of systemic symptoms more often and that older patients more commonly had abnormal chest examinations. Although younger persons reported feeling feverish more often, the recorded highest temperatures were very similar in both groups. However, the temperatures used to define fever for purposes of ILI case definition that provided the best balance between sensitivity and specificity (i.e., maximal AUC) were different between younger and older hospitalized persons (≥37·9 and ≥37·3°C, respectively).
The presence of fever remained important in the elderly group to retain specificity for the diagnosis of influenza. While sensitivity could be increased from 57% to 79% by dropping the fever threshold from the traditional CDC value of 37·8–37·2°C, as suggested by Gravenstein et al.,15 specificity dropped from 71% to 48%. In either group, the lack of fever had a NPV of >90%. Interestingly, the sensitivity and specificity of fever plus cough or sore throat (57% and 71%) to predict influenza in the hospitalized elderly was nearly identical to what was reported by Monto et al.5 in young healthy adults (56% and 71%). However, there was a marked difference in the PPV and NPV values in our study (20% and 93%) compared with the study by Monto et al. (79% and 45%) due principally to the lower prevalence of influenza in the population under study. In a systematic review of 12 studies using clinical decision rules for the diagnosis of influenza, Ebell and Afonso found that fever and cough and acute onset had modest accuracy in adults with an ROC curve of 0·79, but summary estimates could not be determined because the studies were too heterogeneous.20 In addition, many studies required fever for inclusion, as well as considering fever among the variables to be evaluated.
The strengths of our study include the large sample size of more than 2400 hospitalized subjects, the use of multiple methods including RT-PCR to confirm the diagnosis of influenza, and not requiring fever as an inclusion criteria for the studies. However, our studies did use acute cardiopulmonary admission diagnoses to screen patients for testing, and therefore, the high prevalence of respiratory symptoms is likely biased. Thus, we cannot assess how many elderly patients may have presented with fever alone or other influenza-related syndromes such as confusion, falls, or gastrointestinal complaints. Very limited data are available using such wide inclusion criteria to prompt testing for influenza among hospitalized patients. To date, only two studies have been performed that screened all admitted patients for influenza regardless of symptoms for influenza. Babcock et al.21 evaluated 335 persons admitted to a general medical ward and tested nasal swabs for influenza by direct fluorescent antibody testing and viral culture. None of the patients were positive for influenza. Similarly, a Dutch study that tested all 246 patients, regardless of symptoms, admitted to a tertiary care hospital during peak influenza activity, found 9% to be positive by RT-PCR.12 Unfortunately, they did not report whether any patients had fever without respiratory symptoms or were asymptomatic. However, they noted that fever and cough only had a sensitivity of 35% and a PPV of 23%.
Our study has several limitations. As the original studies were designed as surveillance studies, this post hoc analysis could not address important issues such as the use of prior antipyretics or types of thermometers used to record temperatures in individual patients. In addition, the evaluation of fever in our study generally occurred after 5–6 days of symptoms at the time of presentation to the hospital. Evaluation at earlier time points may have yielded different results and may be important when considering empiric antiviral treatment. Finally, we cannot generalize our findings to outpatient settings.
Clearly, in any age group, clinical case definitions for influenza are relatively imprecise. Specific case definitions utilizing RT-PCR testing are likely to be required to answer questions of vaccine efficacy, with more sensitive definitions best for assessing overall disease burden.3 Given the lack of sensitivity for all clinical case definitions regardless of age, ideally all patients with acute respiratory illnesses – regardless of body temperature – requiring hospitalization during influenza season should undergo molecular laboratory testing for influenza. Clinical decision rules using the presence of cough and fever may be helpful regarding empiric antiviral treatment when rapid influenza testing is not available; however, lower fever thresholds might be considered for elderly subjects.
Conflict of interests
ARF has received research grants from Sanofi Pasteur, GlaxoSmithKline, ADMA Biologics, Inc., and AstraZeneca and consulting fees from Regeneron and Novavax. EEW serves as a consultant for Alios Pharmaceuticals and ClearPath, Inc. AB declares no competing interests.
References
- Fiore AE, Uyeki TM, Broder K, et al. Prevention and control of influenza with vaccines: recommendations of the Advisory Committee on Immunization Practices (ACIP), 2010. MMWR Recomm Rep. 2010;59:1–62. (RR-08): [PubMed] [Google Scholar]
- Mehlmann M, Bonner AB, Williams JV, et al. Comparison of the MChip to viral culture, reverse transcription-PCR, and the QuickVue influenza A+B test for rapid diagnosis of influenza. J Clin Microbiol. 2007;45:1234–1237. doi: 10.1128/JCM.02202-06. [DOI] [PMC free article] [PubMed] [Google Scholar]
- Nichol KL. Heterogeneity of influenza case definitions and implications for interpreting and comparing study results. Vaccine. 2006;24:6726–6728. doi: 10.1016/j.vaccine.2006.05.064. [DOI] [PubMed] [Google Scholar]
- Govaert TME, Dinant GJ, Aretz K, Knottnerus JA. The predictive value of influenza symptomatology in elderly people. Fam Pract. 1998;15:16–22. doi: 10.1093/fampra/15.1.16. [DOI] [PubMed] [Google Scholar]
- Monto AS, Gravenstein S, Elliott M, Colopy M, Schweinle J. Clinical signs and symptoms predicting influenza infection. Arch Intern Med. 2000;160:3243–3247. doi: 10.1001/archinte.160.21.3243. [DOI] [PubMed] [Google Scholar]
- Boivin G, Hardy I, Tellier G, Maziade J. Predicting influenza infections during epidemics with use of a clinical case definition. Clin Infect Dis. 2000;31:1166–1169. doi: 10.1086/317425. [DOI] [PubMed] [Google Scholar]
- Walsh EE, Cox C, Falsey AR. Clinical features of influenza A virus infection in older hospitalized persons. J Am Geriatr Soc. 2002;50:1498–1503. doi: 10.1046/j.1532-5415.2002.50404.x. [DOI] [PubMed] [Google Scholar]
- Babcock HM, Merz LR, Fraser VJ. Is influenza an influenza-like illness? Clinical presentation of influenza in hospitalized patients. Infect Control Hosp Epidemiol. 2006;27:266–270. doi: 10.1086/501539. [DOI] [PubMed] [Google Scholar]
- Smit OPM, Limper M, van Gorp ECM, Smits PHM, Beijnen JH, Brandjes DPM. Adult outpatient experience of the 2009 H1N1 pandemic: clinical course, pathogens, and evaluation of case definitions. J Infect. 2011;62:371–378. doi: 10.1016/j.jinf.2011.03.005. [DOI] [PMC free article] [PubMed] [Google Scholar]
- Carrat F, Tachet A, Rouzioux C, Housset B, Valleron AJ. Evaluation of clinical case definitions of influenza: detailed investigation of patients during the 1995–1996 epidemic in France. Clin Infect Dis. 1999;28:283–290. doi: 10.1086/515117. [DOI] [PubMed] [Google Scholar]
- Ohmit SE, Monto AS. Symptomatic predictors of influenza virus positivity in children during the influenza season. Clin Infect Dis. 2006;43:564–568. doi: 10.1086/506352. [DOI] [PubMed] [Google Scholar]
- van den Dool C, Hak E, Wallinga J, van Loon AM, Lammers JW, Bonten MJ. Symptoms of influenza virus infection in hospitalized patients. Infect Control Hosp Epidemiol. 2008;29:314–319. doi: 10.1086/529211. [DOI] [PubMed] [Google Scholar]
- van Elden LJ, van Essen GA, Boucher CA, et al. Clinical diagnosis of influenza virus infection: evaluation of diagnostic tools in general practice. Br J Gen Pract. 2001;51:630–634. [PMC free article] [PubMed] [Google Scholar]
- Zambon M, Hays J, Webster A, Newman R, Keene O. Diagnosis of influenza in the community: relationship of clinical diagnosis to confirmed virological, serologic, or molecular detection of influenza. Arch Intern Med. 2001;161:2116–2122. doi: 10.1001/archinte.161.17.2116. [DOI] [PubMed] [Google Scholar]
- Gravenstein S, Davidson HE. Current strategies for management of influenza in the elderly population. Clin Infect Dis. 2002;35:729–737. doi: 10.1086/341246. [DOI] [PubMed] [Google Scholar]
- Falsey AR, Becker KL, Swinburne AJ, et al. Bacterial complications of respiratory tract viral illness: a comprehensive evaluation. J Infect Dis. 2013;208:432–441. doi: 10.1093/infdis/jit190. [DOI] [PMC free article] [PubMed] [Google Scholar]
- Falsey AR, Hennessey PA, Formica MA, Cox C, Walsh EE. Respiratory syncytial virus infection in elderly and high-risk adults. N Engl J Med. 2005;352:1749–1759. doi: 10.1056/NEJMoa043951. [DOI] [PubMed] [Google Scholar]
- Falsey AR. Noninfluenza respiratory virus infection in long-term care facilities. Infect Control Hosp Epidemiol. 1991;12:602–608. doi: 10.1086/646249. [DOI] [PubMed] [Google Scholar]
- Falsey AR, Cunningham CK, Barker WH, et al. Respiratory syncytial virus and influenza A infections in the hospitalized elderly. J Infect Dis. 1995;172:389–394. doi: 10.1093/infdis/172.2.389. [DOI] [PubMed] [Google Scholar]
- Ebell MH, Afonso A. A systematic review of clinical decision rules for the diagnosis of influenza. Ann Fam Med. 2011;9:69–77. doi: 10.1370/afm.1192. [DOI] [PMC free article] [PubMed] [Google Scholar]
- Babcock HM, Merz LR, Dubberke ER, Fraser VJ. Case–control study of clinical features of influenza in hospitalized patients. Infect Control Hosp Epidemiol. 2008;29:921–926. doi: 10.1086/590663. [DOI] [PubMed] [Google Scholar]