Abstract
Introduction
Vaccination is an effective preventive strategy against influenza. However, current trivalent influenza vaccines (TIVs) contain only one of the two influenza B lineages that circulate each year. Vaccine mismatches are frequent because predicting which one will predominate is difficult. Recently licensed quadrivalent influenza vaccines (QIVs) containing the two B lineages should address this issue. Our study estimates their impact by assessing what would have been the US public health benefit of routinely vaccinating with QIV in 2000–2013.
Methods
We developed a dynamic compartmental model that accounts for interactions between influenza B lineages (natural or vaccine-induced) and simulates the multiyear influenza dynamics for 2000–2013. Age-structured population dynamics, vaccine efficacy (VE) per strain, and weekly ramp-up of vaccination coverage are modeled. Sensitivity analyses were performed on VE, duration of immunity, and levels of vaccine-induced cross-protection between B lineages.
Results
Assuming a cross-protection of 70% of the VE of the matched vaccine, the model predicts 16% more B lineage cases prevented by QIV. Elderly (≥65 years) and young seniors (50–64 years) benefit most from QIV, with 21% and 18% reductions in B lineage cases. Reducing cross-protection to 50%, 30%, and 0% of the VE of the matched vaccine improves the relative benefit of QIV to 25%, 30%, and 34% less B lineage cases.
Conclusion
Using a dynamic retrospective framework with real-life vaccine mismatch, our analysis shows that QIV routine vaccination in the United States has the potential to substantially reduce the number of influenza infections, even with relatively high estimates of TIV-induced cross-protection.
Keywords: Dynamic model, influenza, quadrivalent influenza vaccine, trivalent influenza vaccine, vaccine effectiveness, vaccines
Introduction
Controlling seasonal influenza epidemics is a challenge for public health authorities worldwide. Although vaccination has proved to be an effective strategy, the vaccine antigenic composition frequently does not match the circulating virus strains. Two influenza A subtypes (A/H1N1 and A/H3N2) and two influenza B lineages (B/Victoria and B/Yamagata) have been circulating in the United States and worldwide, whereas commercialized influenza vaccines are trivalent and include the two A subtypes but only one B lineage (either B/Victoria or B/Yamagata). Every year, the World Health Organization (WHO) issues recommendations on the composition of the next influenza vaccine based on analyses from its network of corresponding centers. But, past experiences have shown that those recommendations do not always correspond to influenza virus circulation of the following epidemic season.1 The resulting mismatched vaccine has an efficacy lower than expected and fails to prevent a significant proportion of influenza infection.2 New quadrivalent influenza vaccines (QIV) that contain both circulating B lineages have been approved for use in the United States since 2012. Their demonstrated efficacy in children and adults has the potential to overcome the drawbacks of wrongly predicting which B lineage will predominate in a given year.3–5 Quadrivalent influenza vaccines are expected to provide a significant public health and economic benefit, as shown by recent studies.6–9 However, none of these studies considered the dynamic nature of influenza infection. In addition, they did not assess the impact of introducing a new vaccine strain on the evolution of the population immunity status and its implications on the long-term dynamics of seasonal influenza epidemics. Another key factor in QIV evaluation, often overlooked, is the potential cross-protection against a mismatched B lineage conferred by the trivalent influenza vaccines (TIV), obviously limiting the added value of QIV over TIV.
The aim of our analysis was to retrospectively assess what would have been the potential benefit of QIV versus TIV in the United States during the period 2000–2013, taking into account the transmissible nature of influenza as well as multiyear immunity acquired by infection and interaction between B lineages due to natural or vaccine-induced cross-protection. Due to the comparative nature of our study, we mainly report differences on influenza B cases, but do show estimates and results for influenza A to provide the full perspective and enhance comparisons.
Methods
Influenza incidence
Circulation of strains in the United States is reported in the weekly influenza activity reports from the US Centers for Disease Control and Prevention (CDC). We used these data for the study period of interest from 2000 to 2013 (Table1), along with the influenza B lineage contained in the TIV vaccine used for a given year. To obtain weekly time series of influenza incidence by age and for each A subtype (H1N1, H3N2) and B lineage, we used the weekly age distribution of visits for influenza-like illness from the CDC’s US Outpatient Influenza-like Illness Surveillance Network (ILINet), applied to the WHO Collaborating Laboratories and the CDC’s National Respiratory and Enteric Virus Surveillance System (WHO/NREVSS) data regarding the proportions of influenza-positive tests. In doing so, we are making the assumptions that most tested patients had influenza-like symptoms. We then applied the yearly strains distribution published by the CDC to each age group’s time series of influenza cases.
Table 1.
Influenza strain circulation among cases
| Season | % of B among all cases | B/Yamagata (%) | B/Victoria (%) | % of A among all cases | H1N1 (%) | H3N2 (%) | B strain in vaccine |
|---|---|---|---|---|---|---|---|
| 2000–2001 | 46 | 100 | 0 | 53·6 | 97 | 3 | Yamagata |
| 2001–2002 | 13 | 23 | 77 | 87·5 | 2 | 98 | Yamagata |
| 2002–2003 | 43 | 0·40 | 99·6 | 57·4 | 75 | 25 | Victoria |
| 2003–2004 | 1 | 93 | 7 | 99·0 | 0 | 100 | Victoria |
| 2004–2005 | 25 | 74 | 26 | 75·4 | 0 | 100 | Yamagata |
| 2005–2006 | 19 | 22 | 78 | 80·9 | 8 | 92 | Yamagata |
| 2006–2007 | 21 | 23 | 77 | 79·2 | 62 | 38 | Victoria |
| 2007–2008 | 29 | 98 | 2 | 71·0 | 26 | 74 | Victoria |
| 2008–2009 | 34 | 17 | 83 | 66·5 | 89 | 11 | Yamagata |
| 2009–2010 | 1 | 12 | 88 | 99·0 | 95 | 5 | Victoria |
| 2010–2011 | 26 | 6 | 94 | 74·0 | 38 | 62 | Victoria |
| 2011–2012 | 18 | 48 | 52 | 82·0 | 25 | 75 | Victoria |
| 2012–2013 | 30 | 64 | 36 | 70 | 6 | 94 | Yamagata |
Source: US Centers for Disease Control and Prevention, weekly influenza activity. http://www.cdc.gov/flu/weekly.
Vaccine uptake and efficacy
Our analysis uses weekly age-based vaccination coverage from the CDC’s Behavioral Risk Factor Surveillance System and National Immunization Survey. We collected weekly influenza vaccination uptakes over the period 2000–2013 from CDC and collected separately vaccine efficacy (VE) by strain2 and by age (CDC, unpublished data). We then combined the two datasets, assuming the same relative efficacy by age between different strains (Table2). VE is considered to be against infection.
Table 2.
Model parameters
| Parameters | Base case | Range | Sources |
|---|---|---|---|
| Duration of latent period | 1 day | N/A | Carrat et al.16 |
| Duration of viral shedding | 4·8 days | N/A | Carrat et al.16 |
| Proportion of symptomatic infection | 66·9% | N/A | Carrat et al.16 |
| Duration of natural immunity against influenza A | 6 years* | 1–12 years | Vynnycky et al.17 |
| Duration of natural immunity against influenza B | 12 years* | 6–18 years | Vynnycky et al.17 |
| Duration of vaccine-induced immunity | 1 year* | N/A | Vynnycky et al.17 |
| Vaccine-induced cross-protection | 70% of VE | 0–75% | DiazGranados et al.2 |
| Naturally acquired cross-protection | 50% | N/A | Assumption |
| VE (matched B strain) by age group | |||
| 6–23 months | 61·0% | ±20% | CDC, unpublished data |
| 2–4 years | 61·0% | ||
| 5–10 years | 56·8% | ||
| 11–14 years | 49·2% | ||
| 15–18 years | 49·2% | ||
| 19–49 years | 50·0% | ||
| 50–64 years | 80·0% | ||
| ≥65 years | 60·0% | ||
| R0 A/H1N1 | 1·02–1·76 | N/A | Estimated |
| R0 A/H3N2 | 1·11–2·14 | ||
| R0 B/Victoria | 1·10–1·77 | ||
| R0 B/Yamagata | 1·02–1·86 | ||
CDC, US Centers for Disease Control and Prevention; VE, vaccine efficacy.
With exponential decay.
Cross-protection
We only consider in our model cross-protection between B lineage, because any potential heterosubtypic immunity between A/H1N1 and A/H3N2 would not impact the comparison between TIV and QIV. A recent review by DiazGranados et al.2 gives a VE point estimate of 71% against a matched strain and 49% against a non-matched B strain. In our model, we used the same ratio of decreased efficacy (49/71 = 70% of VE) to estimate the mismatched efficacy or cross-protection. To analyze its impact on our results, we varied this estimate from 75% to 0%, with intermediate steps.
Our assumption is in line with another study that assumed 66% of the matching VE,8 and conservative compared with another study that does not consider cross-protection at all.6 Following results from DiazGranados et al.,2 we assumed no loss of efficacy if the mismatch was on the strain but not on the subtype for A and lineage for B. The other main model inputs are given in Table2.
Epidemiological model
The model is structured in nine age groups: 0–6 months, 6–23 months, 2–4 years, 5–10 years, 11–14 years, 15–18 years, 19–49 years, 50–64 years, and ≥65 years. It is composed of two submodels that independently capture influenza A- and influenza B-type epidemics. The model for influenza A (Figure S1) is a variation of a compartmental SEIR model, where individuals can be either susceptible to infection (S), exposed but not infectious (E), infectious (I), or have acquired an immunity to the disease (recovered; R). In addition, we have added a vaccination compartment (V) to account for individuals effectively protected from infection by vaccination. To account for possible independent infection by influenza A/H1N1 and influenza A/H3N2, we have split the E, I, and R compartments. As both TIV and QIV systematically contain antigens of the two subtypes, it was not necessary to split the V compartment.
The model for influenza B, shown in Figure1, is built on the same initial principle as the model for influenza A. However, while no interaction is documented between A/H1N1 and A/H3N2, several studies have shown that both vaccine-induced and naturally acquired protection against a B lineage occur when a person is vaccinated against or infected by the other.2,10 The model accounts for such interactions by considering a second sequence of infection after each primary infection. Once individuals have been infected by one lineage, they shift to the R compartment corresponding to their infection. Then, they may be infected by the other lineage, but with a lower probability corresponding to the natural cross-protection they acquired with the primary infection. For vaccine-induced cross-protection, the process is similar: individuals protected against one lineage can be infected, with a lower probability, by the other lineage. In both cases, individuals will end up in a compartment where they will be immune to both kinds of infection for the duration of their naturally acquired immunity.
Figure 1.
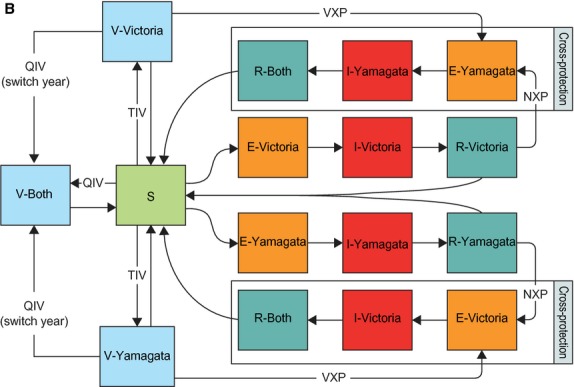
Diagram of the influenza B part of the dynamic model. E, exposed but not infectious; NXP, natural cross-protection; QIV, quadrivalent influenza vaccine; R, acquired an immunity to the disease (recovered); S, susceptible to infection; V, vaccination compartment; VXP, vaccine-induced cross-protection.
Both submodels are age-structured, with nine age groups (0–6 months, 6–23 months, 2–4 years, 5–10 years, 11–14 years, 15–18 years, 19–49 years, 50–64 years, and ≥65 years) and use a contact matrix to account for the heterogeneity of contacts between age groups. Due to the absence of published contact data in the United States, mainly available for European countries,11 we used mean daily time of exposure between age groups in the United States compiled by Zagheni et al.12 Equations of the model are given as supplementary material.
Calibration process
Probabilities of influenza infection – βv and βy, respectively – for B/Victoria and B/Yamagata are calibrated simultaneously. In addition, to replicate yearly variations in influenza peaks and dominance of one lineage over the other, we first calibrate βvi and βyi for the first year i = 2000. The final state of year i is the initial state of year i + 1. We then calibrate βvi + 1 and βyi + 1 for year i + 1, taking into account the population immune status acquired the previous years. Each year, the population is vaccinated with a TIV containing the B lineage which was used that year. We use a 10-year ‘burn-in’ period (between 1990 and 2000), with the same epidemic parameters, to let the model reach steady initial values for the first year of calibration (year 2000). We end up with a set of (βvi, βyi), containing one β per lineage and per year, each accounting for variations that could not be explained by the evolution of the population immunity (either vaccine or infection induced), but potentially by external factors (climate, strain pathogenicity, etc.).
In contrast to other approaches, mainly in static models, consisting of the computation of an expected probability of infection without vaccination,6 this process directly allows us to account for the impact of vaccination, as the estimates are computed under a given coverage, vaccine composition, and efficacy; TIV, in this case. The calibration uses a Nelder–Mead simplex algorithm13 with a least square fitness function. The model and calibration process are implemented in r14 and take approximately 4 hours to compute on a 2·6 GHz microprocessing core.
Figure2 shows the match obtained, after calibration, between weekly incidence time series computed by the model and weekly incidence observed over the period 2000–2013. Our calibration process allowed the model to achieve R2 of 95·4% and 93·0% for B/Victoria and B/Yamagata, respectively. Ranges of R0 yearly variations, classically computed15 with beta estimated by the model, are given in Table2 for B/Victoria, B/Yamagata, and for A/H1N1 and A/H3N2 (the absence of epidemic circulation of a particular strain in a given year yields an R0 < 1, which is not shown in the table).
Figure 2.
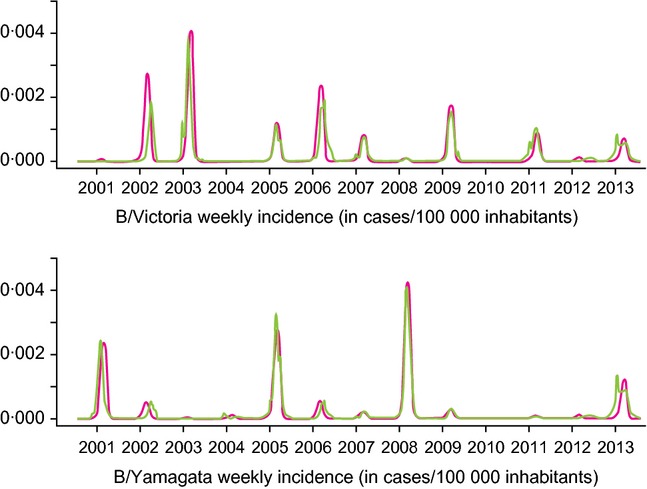
Comparison of weekly influenza incidence for B/Victoria and B/Yamagata predicted by the model versus the weekly incidence observed over the period 2000–2013. Green lines indicate the observed incidence and pink lines indicate the predicted incidence.
Scenarios and sensitivity analyses
Our analysis is focused on the assessment of the potential incremental differences of using QIV instead of TIV. Consequently, we systematically compare a TIV scenario with a QIV scenario regarding the number of cases due to influenza B strains. Because yearly incidences depend on the incidence of previous years, each yearly impact of a vaccine cannot be interpreted independently. Consequently, we could not easily estimate a confidence interval of ‘yearly vaccine impact’, and computed instead an impact range defined as the minimum and maximum of the moving average of the vaccine impact with window of 5 years.
Cross-protection plays a crucial role in the estimation of the benefits of a multistrain vaccine. We conservatively used a relatively high estimate of cross-protection as our base case, but chose to vary this estimate in a sensitivity analysis where values go from 0% to 75% of the VE against the matched strain.
For each scenario, the probabilities of infection were recalibrated using the process described earlier, as every change in cross-protection, duration of immunity, and vaccine effectiveness affects the dynamics of the epidemic and hence the potential effects of the vaccine. We did not define a dedicated sensitivity analysis on vaccine coverage; however, by design, coverage and efficacy play a similar role at the population level of our model. Consequently, the results we show on the sensitivity to efficacy variations can be directly interpreted as results on the sensitivity to coverage variations for a fixed efficacy.
Results
Assuming a cross-protection of 70% of the VE of a matching vaccine, the model predicts that QIV would have prevented on average 15·80% (10·37%; 22·7%) (min–max, moving average over 5 years) extra B lineage cases than TIV over the period 2000–2013. Figure3 and Table3 illustrate the multiyear incidence evolution of B/Victoria and B/Yamagata epidemics under TIV and QIV scenarios. The first point to notice is the relatively large variations in cases prevented by QIV, years with a mismatched TIV vaccine being mainly years with the highest impact of QIV. It appears that over the period 2000–2013, QIV would have prevented a cumulative number of more than 6·2 million cases. Two other situations can be highlighted. First, several years show a cocirculation of the two lineages, which allows QIV to be beneficial even during ‘vaccine match’ years. Second, with a QIV scenario, some years display a slightly higher incidence for one B lineage than a scenario with TIV alone. As shown in Table3, these correspond to years with TIV matching the circulating B lineage (2006–2007, 2009–2011), and more importantly, they follow a string of years combining TIV mismatch and medium to high B circulation, leading to large numbers of cases prevented by QIV (>1·6 million in 2004–2006 and >2·7 million in 2007–2009). Concerning elderly individuals (age ≥65 years) and young seniors (age 50–64 years), Figure4 shows that they benefit the most from QIV, with 21% and 18% reduction in B cases, respectively. Of note, the infant population (age 0–6 months), not (yet) vaccinated, benefits from QIV thanks to indirect protection of the other age groups.
Figure 3.
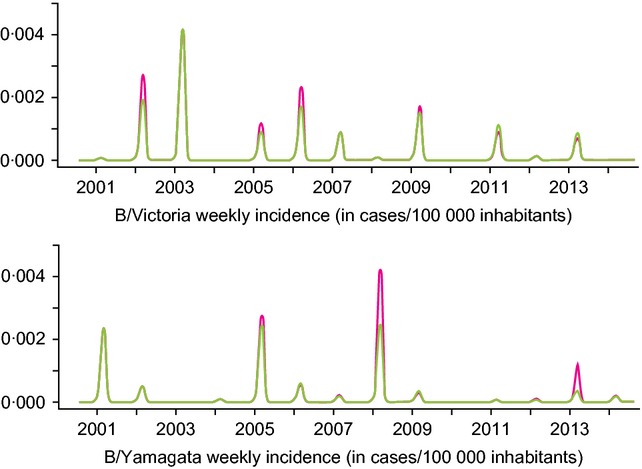
Base case comparison between trivalent influenza vaccine (TIV) and quadrivalent influenza vaccine (QIV). Top panel shows influenza B/Victoria weekly incidence time series. Bottom panel shows influenza B/Yamagata weekly incidence time series. Pink lines indicate the TIV scenario and green lines indicate the QIV scenario.
Table 3.
Difference in influenza symptomatic cases of a routine vaccination with QIV compared with one TIV over the period 2000–2013. Negative numbers indicate additional cases averted by QIV compared with TIV. The ‘relative difference with QIV’ columns give the relative difference between QIV and TIV for cases and susceptible population. The last columns give the TIV B antigens matching, a match being defined as ‘the vaccine strain represents more than 50% of the circulating B strains’, and a qualitative ranking of B virus circulation for the given year (low <10% medium <25% high)
| Season | Absolute difference | Relative difference with QIV (%) | TIV B antigens matching | B circulation | |||
|---|---|---|---|---|---|---|---|
| Cases (cumulative)* | Cases (yearly)* | Rate (per 100 000) | Cases | Susceptible population | |||
| 2000–2001 | −20 900 | −20 900 | −8 | −0·60 | 0·01 | Match | High |
| 2001–2002 | −701 500 | −680 600 | −250 | −20·60 | 0·19 | Mismatch | Medium |
| 2002–2003 | −897 300 | −195 800 | −72 | −4·20 | 0·45 | Match | High |
| 2003–2004 | −933 200 | −35 900 | −13 | −15·60 | 0·48 | Mismatch | Low |
| 2004–2005 | −1 876 100 | −942 900 | −340 | −14·70 | 0·70 | Match | High |
| 2005–2006 | −2 578 300 | −702 200 | −252 | −18 | 1·16 | Mismatch | Medium |
| 2006–2007 | −2 565 700 | 12 600 | 4 | 0·80 | 1·27 | Match | Medium |
| 2007–2008 | −5 108 700 | −2 543 000 | −901 | −38·90 | 1·83 | Mismatch | High |
| 2008–2009 | −5 311 400 | −202 700 | −71 | −6·70 | 2·70 | Mismatch | High |
| 2009–2010 | −5 310 000 | 1400 | 0 | 1·60 | 2·44 | Match | Low |
| 2010–2011 | −4 915 200 | 394 800 | 137 | 19 | 2·06 | Match | High |
| 2011–2012 | −4 991 100 | −75 900 | −26 | −14·80 | 1·71 | Match | Medium |
| 2012–2013 | −6 267 800 | −1 276 700 | −438 | −34 | 1·90 | Match | High |
| Average | −482 000 | −172 | 8/13 matches | 7 high seasons | |||
| Total | −6 267 800 | −2230 | −15·80 | ||||
QIV, quadrivalent influenza vaccine; TIV, trivalent influenza vaccine.
Absolute number of cases are computed on a population without international migration.
Figure 4.
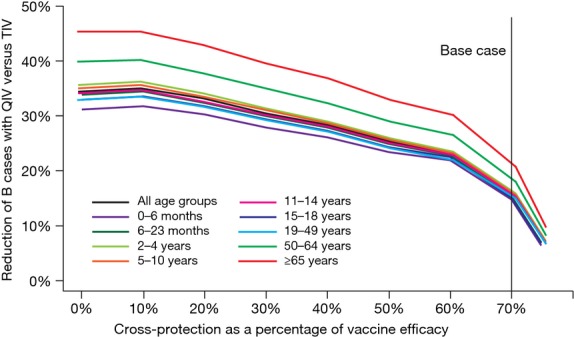
Cross-protection sensitivity analysis showing reduction in B cases with quadrivalent influenza vaccine (QIV) compared with trivalent influenza vaccine (TIV) over the period 2000–2013. The vertical line shows the base case scenario.
Sensitivity analyses
Figure4 also shows that reducing the cross-protection estimate to 50%, 30%, and 0% of the matched VE improves the relative benefit of QIV to 25%, 30%, and 34% fewer B cases in the United States for all age groups. In Figure5, we show the impact of varying VE across all age groups by −20% to +20%. Increasing VE tends to linearly increase the relative benefits of QIV. In addition, in our model, VE and vaccine coverage play a mutually exchangeable role at the population level, which means that variations invaccination coverage by ±20% would display the same results. Hence, an increase in vaccination coverage would also raise QIV-relative benefits.
Figure 5.
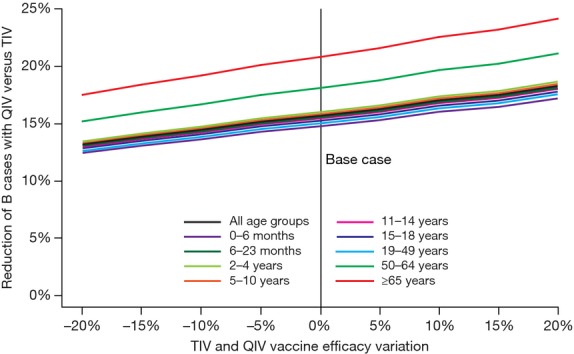
Vaccine efficacy sensitivity analysis. QIV, quadrivalent influenza vaccine; TIV, trivalent influenza vaccine.
Lastly, we varied duration of immunity acquired by infection from 6 to 18 years. Results displayed in Figure6 show that an increased duration of acquired immunity tends to decrease QIV impact. However, the relation seems to be asymptotic; increasing the duration from 12 to 18 years only reduces QIV impact by <1% (all age groups).
Figure 6.
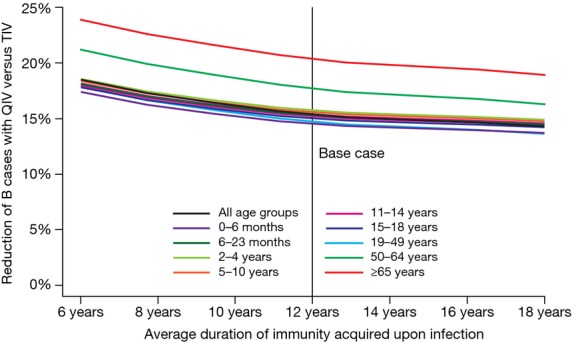
Sensitivity analysis of the duration of immunity acquired upon infection. QIV, quadrivalent influenza vaccine; TIV, trivalent influenza vaccine.
Our model is also able to simulate influenza A activity (Figure S1). Although QIV have no additional impact on A compared with TIV, it allows us to put QIV potential benefits in the perspective of a global reduction in influenza cases. Considering all influenza cases (A and B), our analysis predicts a maximum reduction of 11% symptomatic cases on year 2007–2008 and a total reduction on the entire 2000–2013 time period of 3·2% of cases.
Discussion
The complex dynamic of communicable diseases should not be underestimated when assessing preventive strategies. In the case of influenza, vaccines have the potential to change the dynamic of seasonal epidemics, mainly by changing the balance between immunity acquired by infection and by vaccination. Our results show that the benefit of QIV varies from 1 year to another. Quadrivalent influenza vaccine reduces the number of yearly cases during our study period (2000–2013) by a low of 20 900 in 2000 to a high of 2 543 000 cases in 2007. For some specific epidemic contexts of TIV matching the circulating B lineage and large QIV-induced reductions in cases preceding years, the total number of B cases can be larger with QIV than with TIV (1400–394 800 more cases). However, this increase is just a balancing effect due to even larger reductions in the number of cases during previous years. The reduction in the number of infections results in an increased number of individuals susceptible to new infection the following seasons (up to 2·7%, or approximately 4 million). This effect does not outweigh the public health benefit of QIV, as our model predicts an average of 172 cases prevented annually per 100 000 inhabitants in the United States (or 482 000 fewer cases per year). It also shows that the public health benefit of QIV may have to be evaluated over several years, which may reduce the economic effectiveness of the strategy due to the discounting of future benefits.
In addition, we notice in Figures6, displaying agewise QIV-relative public health benefits, that young seniors and the elderly benefited the most from the switch from TIV to QIV. This result may be explained by the higher vaccination coverage observed in those groups. Indeed, Figure5 can be interpreted as a sensitivity analysis on coverage and shows a linear positive correlation between coverage (or efficacy) QIV benefits. Hence, a higher coverage should allow QIV to prevent even more influenza cases than would TIV.
Our study shares similar objectives and perspectives with the analysis conducted by Reed et al.6 In addition to focusing on the US population and sharing most of the data sources, we simulated a hypothetical scenario where QIV would have been used in place of TIV for the past years, and compared the outcomes. This design allows us to assess under a realistic epidemiologic context the impact of the two vaccines. However, it limits our ability to describe potential long-term impact of some hypothetical scenarios, like a long duration of naturally acquired immunity (>12 years), but projecting the use of QIV in the future would have required additional assumptions about vaccine mismatch and B lineage circulations, which may have impaired our results. However, we also have fundamental differences: we used a dynamic model, we considered cross-protection, differences of VE, coverage, and contacts between age groups, and we took into account the epidemiological link between influenza seasons (population immunity of year N depends on year N−1). Hence, our results differ, as we show greater variations of yearly benefits and a greater average number of avoided cases (over the period 2001–2009, Reed et al. show 342 700 avoided cases by QIV, while we predict 661 600 for the same period). However, both sets of results are correlated, as lows and highs happen on the same years and remain around the same order of magnitude over the whole time period considered.
On the other hand, the study by Clements et al.,9 also set in the United States, predicts that QIV would only prevent on average 30 000 cases per year. This result corresponds in our analysis to the 2003–2004 context of TIV mismatch and low B circulation (Table3). They use similar estimates of incidence, VE, and cross-protection, but use a static model and only perform a single-year analysis. Given the yearly variations that we observe, and the correlations between years, their results may not give a complete and accurate estimate of the likely benefits of QIV over several years and various epidemiological contexts.
Although we believe that our analysis is more advanced than previous attempts, we must acknowledge some limits. To keep the model understandable and manageable, we had to make some simplifying assumptions. One of them concerns individuals recently infected and naturally immune against one strain, who may not be impacted by a vaccination with QIV, or with TIV containing the other strain. Accounting for that situation would have implied tracking too many combinations of remaining duration of immunity, which was not feasible under the current design. In addition, we considered that the simplification’s impact would be in disfavor of vaccination, giving us more conservative results. For the same reason, an infection by a strain, after vaccination against the other one, leads to immunity against the two strains for the duration of the naturally acquired immunity. This simplification gives an advantage to TIV, as it cannot happen with QIV, leading to more conservative QIV-relative benefits. Finally, as we decided not to take into account the growth of the population due to net immigration, we underestimate the real size of the population. However, at the central year of our simulation (2007), our population is 6% smaller than the census estimate. Consequently, our average results may be underestimated by the same amount.
As mentioned previously, QIV-relative benefits rise with VE and coverage, meaning that the increased influenza vaccine coverage in recent years, due to pediatric and universal indications, is likely to favor QIV public health impact in the future, but further studies are required to confirm this effect. In addition, we considered that cross-protection conferred by TIV does not vary with age; however, no study demonstrates that this assumption is correct.
Conclusion
Using a realistic retrospective framework, with real-life vaccine mismatch, our analysis shows that routine vaccination with QIV has the potential to substantially reduce the number of influenza infections. Although our base case scenario uses relatively conservative estimates of TIV-induced cross-protection, it still shows a 15·80% reduction in B cases over the period considered. Our analysis highlights the necessity of taking cross-protection into account and illustrates the potential public health impact over several years due to the variety of situations that may arise. Subsequent studies will have to assess the economic value of the potential impact of QIV vaccine strategies versus continuation of TIV.
Acknowledgments
The authors thank A. Chit and B. Macabeo from Sanofi Pasteur for their fruitful insights. The GII is supported by a grant from Sanofi Pasteur and managed by PAREXEL, the scientific secretariat for this program. We acknowledge the editorial assistance of PAREXEL, which was supported by Sanofi Pasteur. We are also most grateful to the GII members.
Conflict of interests
PC, MJP, and RP are members of the GII. PC and MJP have received consulting fees from Sanofi Pasteur. RP and PTdB have been involved with research funded by Sanofi Pasteur.
Supporting Information
Appendix S1. Differential equations of the influenza dynamic model.
Figure S1. Representation of the influenza A part of the dynamic model.
References
- Hannoun C. The evolving history of influenza viruses and influenza vaccines. Expert Rev Vaccines. 2013;12:1085–1094. doi: 10.1586/14760584.2013.824709. [DOI] [PubMed] [Google Scholar]
- DiazGranados CA, Denis M, Plotkin S. Seasonal influenza vaccine efficacy and its determinants in children and non-elderly adults: a systematic review with meta-analyses of controlled trials. Vaccine. 2012;31:49–57. doi: 10.1016/j.vaccine.2012.10.084. [DOI] [PubMed] [Google Scholar]
- Greenberg DP, Robertson CA, Noss MJ, Blatter MM, Biedenbender R, Decker MD. Safety and immunogenicity of a quadrivalent inactivated influenza vaccine compared to licensed trivalent inactivated influenza vaccines in adults. Vaccine. 2013;31:770–776. doi: 10.1016/j.vaccine.2012.11.074. [DOI] [PubMed] [Google Scholar]
- Greenberg DP, Robertson CA, Landolfi VA, Bhaumik A, Senders SD, Decker MD. Safety and immunogenicity of an inactivated quadrivalent influenza vaccine in children 6 months through 8 years of age. Pediatr Infect Dis J. 2014;33:630–636. doi: 10.1097/INF.0000000000000254. [DOI] [PubMed] [Google Scholar]
- Pépin S, Donazzolo Y, Jambrecina A, Salamand C, Saville M. Safety and immunogenicity of a quadrivalent inactivated influenza vaccine in adults. Vaccine. 2013;31:5572–5578. doi: 10.1016/j.vaccine.2013.08.069. [DOI] [PubMed] [Google Scholar]
- Reed C, Meltzer MI, Finelli L, Fiore A. Public health impact of including two lineages of influenza B in a quadrivalent seasonal influenza vaccine. Vaccine. 2012;30:1993–1998. doi: 10.1016/j.vaccine.2011.12.098. [DOI] [PubMed] [Google Scholar]
- Lee BY, Bartsch SM, Willig AM. The economic value of a quadrivalent versus trivalent influenza vaccine. Vaccine. 2012;30:7443–7446. doi: 10.1016/j.vaccine.2012.10.025. [DOI] [PMC free article] [PubMed] [Google Scholar]
- Van Bellinghen LA, Meier G, Van Vlaenderen I. The potential cost-effectiveness of quadrivalent versus trivalent influenza vaccine in elderly people and clinical risk groups in the UK: a lifetime multi-cohort model. PLoS ONE. 2014;9:e98437. doi: 10.1371/journal.pone.0098437. [DOI] [PMC free article] [PubMed] [Google Scholar]
- Clements KM, Meier G, McGarry LJ, Pruttivarasin N, Misurski DA. Cost-effectiveness analysis of universal influenza vaccination with quadrivalent inactivated vaccine in the United States. Hum Vaccine Immunother. 2014;10:1171–1180. doi: 10.4161/hv.28221. [DOI] [PMC free article] [PubMed] [Google Scholar]
- Tricco AC, Chit A, Soobiah C, et al. Comparing influenza vaccine efficacy against mismatched and matched strains: a systematic review and meta-analysis. BMC Med. 2013;11:153. doi: 10.1186/1741-7015-11-153. [DOI] [PMC free article] [PubMed] [Google Scholar]
- Mossong J, Hens N, Jit M, et al. Social contacts and mixing patterns relevant to the spread of infectious diseases. PLoS Med. 2008;5:e74. doi: 10.1371/journal.pmed.0050074. [DOI] [PMC free article] [PubMed] [Google Scholar]
- Zagheni E, Billari FC, Manfredi P, Melegaro A, Mossong J, Edmunds WJ. Using time-use data to parameterize models for the spread of close-contact infectious diseases. Am J Epidemiol. 2008;168:1082–1090. doi: 10.1093/aje/kwn220. [DOI] [PubMed] [Google Scholar]
- Nelder JA, Mead R. A simplex method for function minimization. Comput J. 1965;7:308–313. [Google Scholar]
- R Core Team. R: A Language and Environment for Statistical Computing. Vienna, Austria: R Foundation for Statistical Computing; 2014. [Google Scholar]
- Vynnycky E, White R. An Introduction to Infectious Disease Modelling. New York: Oxford University Press; 2010. [Google Scholar]
- Carrat F, Vergu E, Ferguson NM, et al. Time lines of infection and disease in human influenza: a review of volunteer challenge studies. Am J Epidemiol. 2008;167:775–785. doi: 10.1093/aje/kwm375. [DOI] [PubMed] [Google Scholar]
- Vynnycky E, Pitman R, Siddiqui R, Gay N, Edmunds WJ. Estimating the impact of childhood influenza vaccination programmes in England and Wales. Vaccine. 2008;26:5321–5330. doi: 10.1016/j.vaccine.2008.06.101. [DOI] [PubMed] [Google Scholar]
Associated Data
This section collects any data citations, data availability statements, or supplementary materials included in this article.
Supplementary Materials
Appendix S1. Differential equations of the influenza dynamic model.
Figure S1. Representation of the influenza A part of the dynamic model.


