

Abstract
Previously we have shown that morphine regulates adult neurogenesis by modulating miR-181a maturation and subsequent hippocampal neural progenitor cell (NPC) lineages. By using NPCs cultured from PKCε or β-arrestin2 knockout mice and the MEK inhibitor U0126, we demonstrate that regulation of NPC differentiation via the miR-181a/Prox1/Notch1 pathway exhibits ligand-dependent selectivity. In NPCs, morphine and fentanyl activate ERK via the PKCε- and β-arrestin-dependent pathways, respectively. After fentanyl exposure, the activated phospho-ERK translocates to the nucleus. Conversely, after morphine treatment phospho-ERK remains in the cytosol and is capable of phosphorylating TRBP, a cofactor of Dicer. This augments Dicer activity and promotes the maturation of miR-181a. Furthermore, by using NPCs transfected with wild type TRBP, SΔA and SΔD TRBP mutants, we confirmed the crucial role of TRBP phosphorylation in Dicer activity, miR-181a maturation, and finally the morphine-induced astrocyte-preferential differentiation of NPCs. Thus, morphine modulates the lineage-specific differentiation of NPCs by PKCε-dependent ERK activation with subsequent TRBP phosphorylation and miR-181a maturation.
Keywords: adult stem cells, cell signaling, signal transduction, MAPK, miRNA, neural differentiation, neural stem cell, progenitor cells
Introduction
During adult neurogenesis in the hippocampus, neural progenitor cells (NPCs) in the subgranular zone (SGZ) give rise to neuroblasts and immature neurons, which migrate a short distance into the granule cell (GC) layer of the dentate gyrus (DG) [1, 2]. The immature or mature neurons differentiated from neuroblast cells and NPCs then integrate into the existing hippocampal circuitry [3-6]. This process is regulated by a variety of factors [6, 7], including several addictive drugs such as morphine [8, 9], heroin [10, 11], methamphetamine [12, 13], cocaine [14, 15], alcohol [16] and cannabinoids [17]. In vivo and in vitro evidence suggests that agonists of opioid receptors are important regulators of adult neurogenesis, especially in cell fate specification. For example, chronic morphine treatment increased expression of glial fibrillary acidic protein (GFAP) in the hippocampus [18]. Chronic treatment of NPCs with antagonists of μ-opioid receptor (OPRM1) and δ-opioid receptor (OPRD1) increased neuronal differentiation while decreasing their differentiation into both astrocytes and oligodendrocytes [19].
Previously, we observed that morphine and fentanyl differentially regulated the activity of neurogenic differentiation 1 (NeuroD1), a basic helix-loop-helix transcription factor essential for the differentiation and maturation of newborn neurons [20], via their regulation of miR-190 [21]. This differential regulation results in divergent effects on neurogenesis, as morphine, but not fentanyl, attenuates neural differentiation and memory retention [22]. In addition, we also demonstrated that morphine, but not fentanyl, was capable of regulating adult neurogenesis by controlling miR-181a and subsequent NPC lineages. This effect was mediated by the Prox1/Notch1 pathway as demonstrated by an increase in Notch1 levels in the morphine- but not fentanyl-treated NPCs, and blocked by expression of Notch1 siRNA [23]. These studies suggest that morphine could modulate various stages of adult neurogenesis by its action on various miRs. However, the mechanism leading to the regulation of miR-181a levels and subsequently NPC fate determination remains unresolved.
MicroRNAs (miRNAs) are a class of small RNAs expressed in most somatic tissues. They negatively regulate gene expression in a variety of eukaryotic organisms by base-pairing with the 3′ untranslated region (UTR) of their target mRNAs [24, 25]. The miRNA genes are transcribed by RNA polymerase II (Pol II), thus generating the primary miRNA (pri-miRNA) with a local hairpin structure [25]. The pri-miRNA then undergoes nuclear processing initiated by a nuclear RNase III, Drosha, which cleaves the stem-loop to release a small hairpin-shaped RNA termed precursor miRNA (pre-miRNA) [26]. Pre-miRNA is exported to the cytosol, where Dicer, another RNase III, cleaves pre-miRNA near the terminal loop and liberates the mature miRNA [27]. During this process, Dicer is often regulated and accompanied by a double-strand RNA-binding protein (dsRBP) [28], such as the HIV TAR RNA-binding protein (TRBP) in humans [29]. Mature miRNAs then direct sequence-specific silencing of target mRNAs through effector complexes that contain Argonaute (AGO) family proteins [30]. It is widely accepted that miRNA maturation is a crucial step in modulating neurogenesis. For example, it was demonstrated that Drosha regulates neurogenesis by controlling expression of neurogenin 2 (Ngn2) and NeuroD1 [31]. Similarly, Dicer is required for regulating cortical stem cell multipotency [32] and limiting the time span of cortical neurogenesis [33]. As our previous studies indicate that morphine treatment does not alter the pri- and pre-miR-181a levels in NPCs [23], it is likely that morphine modulates the maturation of miR-181a by regulating Dicer and its cofactors.
TRBP was first identified as a cellular protein that facilitates the replication of human immunodeficiency virus and inhibits the activation of protein kinase R (PKR) [34, 35]. As a member of dsRBPs, TRBP also contributes to pre-miRNA processing as a cofactor of Dicer. The Dicer-TRBP complex is essential for both miRNA processing and assembly of the RNA-induced silencing complex (RISC), which is required for miRNA biogenesis and post-transcriptional gene silencing [29, 35, 36]. The activity of TRBP is regulated by ERK-mediated phosphorylation of its serine residues. TRBP phosphorylation stabilizes the miRNA-generating complex and up-regulates Dicer expression by stabilizing the Dicer protein, thus promoting the maturation of certain miRNAs such as miR-17 and miR-20a [37]. This has been demonstrated in transgenic mice, as apigenin, a flavonoid, impairs miR-103 maturation by inhibiting the ERK-TRBP phosphorylation cascade [38]. Agonist-selected signaling of OPRM1 by morphine and fentanyl results in distinct pathways of ERK activation [21, 39]. Since ERK-induced TRBP phosphorylation is involved in microRNA maturation, we therefore examined whether these ERK pathways are related to morphine and fentanyl's differential abilities in modulating miR-181a maturation and subsequent NPC lineages.
Materials and methods
Animals
Eight-week-old wild type C57BL/6 male mice were obtained from Charles River Laboratories, Inc. (Wilmington, MA) two weeks before experiments. β-arrestin2 KO mice (C57BL/6J background) were gifts from Dr. Robert Lefkowitz. PKCε KO mice bred from pairs of hybrid (50% C57BL/6, 50% 129S4) mice heterozygous for the mutant PKCε gene were gifts from Dr. George Wilcox [40, 41]. Animal maintenance and procedures were conducted in according to Institutional Animal Care and Use Committee (IAUCUC) policies at University of Minnesota.
Neural progenitor cell (NPC) expansion and differentiation
Primary cultures and differentiation of mouse hippocampal neurospheres were carried out as previously described [23]. For cell expansion, cells are cultured as neurospheres in proliferation medium containing 10 μg/ml EGF and 10 μg/ml FGF2. For cell differentiation, glass coverslips were coated with 1 mg/ml Matrigel for 2 h at room temperature. Neurospheres (less than 5 passages) were triturated to form a single-cell suspension and cultured in the complete differentiation medium for approximately 4 days. EGF and FGF2 were obtained from Sigma-Aldrich (St Louis, MO). NeuroCult™ NSC Medium for proliferation and differentiation, and the Enzymatic Dissociation Kit were purchased from STEMCELL Technologies (Vancouver, Canada). Matrigel was from BD Biosciences (San Jose, CA).
In vivo Morphine Treatment
Eight-week-old wild type (C57BL/6 male) mice, β-arrestin2 KO (C57BL/6J) mice and PKCε KO (50% C57BL/6, 50% 129S4) mice were administered morphine by subcutaneous implantation of one morphine pellet (75 mg free base per mouse) for 4 days. Control animals were implanted with placebo pellets. Mice were anesthetized lightly with isoflurane during the implantation process. The tablets for implantation were obtained from National Institute on Drug Abuse.
Immunoblotting
Immunoblotting was performed as described previously [39]. Briefly, chemifluorescence was detected by using the ECF Reagent (GE Healthcare, UK) and the fluorescence intensity was measured with Storm 860 Molecular Imager (GE Healthcare). The intensity of individual bands was determined with ImageQuant software (GE Healthcare). U0126 was purchased from Calbiochem (San Diego, CA). Antibodies are listed in supporting information Table S1.
Quantitative Reverse Transcription PCR (qRT-PCR)
The total RNAs were extracted and reverse transcribed with the miScript system (Qiagen, Germany). QRT-PCR was performed according to the instructions in the miScript system, which included a SYBR Green PCR kit (Qiagen). GAPDH was used as an internal control. Primer sets used in qRT-PCR assays are listed in supporting information Table S2.
DNA construct transfection
DNA constructs of wild type, SΔA and SΔD TRBP were sub-cloned into the pCLneo vector with 3×Flag tag at N terminal, and were gifts from Dr Qinghua Liu's lab [37]. The over-expression of wild type, SΔA and SΔD TRBP were performed by using Lipofectamine 2000 (Life technologies, CA) according to the manufacturer's instructions. Briefly, the DNA-lipid complex solution containing 7.5 μl transfection reagent and 2.5 μg DNA was added to each well of a 6-well plate. The cells were incubated in the transfection medium for 24 h before being used for subsequent experiments. Transfection efficiency was determined to be ≥ 60% by quantifying the number of GFP+ cells in transfection studies using a GFP expression vector.
Immunocytochemistry and cell quantification
Immunocytochemistry was performed as described previously [42]. Labeled cells were mounted on slides with DAPI Fluormount G (SouthernBiotech, Birmingham, AL) and visualized using an upright microscope (model DM5500 B; Leica, Germany) with a CCD camera. Cells were counted using ImageJ (NIH, MA). The total cell numbers were counted based on DAPI-positive particles and those of each cell type were counted according to indicated markers. Double positive cells were confirmed by overlapping color and counted manually by the “Cell Counter” plugin. The final data represent at least four individual experiments. For each single experiment, at least three individual fields of a single sample were selected randomly to reach a total number of at least 1,000 cells. Antibodies are listed in Table S1.
Data Analysis
All statistical and curve-fitting analyses were performed using GraphPad Prism 6.0 software. Data represent mean ± SEM of at least three separate experiments. Statistical significance was determined by one-way ANOVA followed by post hoc comparison using Dunnett's tests.
Results
Morphine and fentanyl activate ERK via differential pathways
We previously reported that morphine, but not fentanyl, modulates NPC lineages by up-regulating miR-181a levels [23]. However, the mechanism underlying this ligand-biased regulation has not been determined. It is likely that the reported pathway-selective ERK activation exhibited by morphine and fentanyl [21, 39] also exists in NPCs, and such pathway selectivity is the cause for the observed differential regulation of miR-181a processing. As shown in Fig. S1, although the maximal ERK activation induced by either agonist was observed at 10 min, their EC50 values are significantly different (3.1±1.2×10⁻⁸ M for morphine and 4.1±1.7×10⁻¹⁰ M for fentanyl). By using NPCs from β-arrestin2 (βArr2) and PKCε knockout (KO) mice, we found that 1 μM morphine did not activate ERK in NPC isolated from PKCε KO cells, but was retained in NPCs isolated from βArr2 KO mice. As such, morphine did not increase levels of phosphorylated PKC substrates in NPCs from PKCε KO mice (Fig. 1, A and B). Meanwhile, 10 nM fentanyl induced ERK phosphorylation in NPCs from PKCε KO but not those from βArr2 KO mice (Fig. 1, A and B). The siRNA-mediated knockdown of PKC subtypes indicated that PKCε, but not PKCα, mediated morphine-induced ERK activation. In contrast, knocking down of either subtype had no significant effect on fentanyl's ERK activation (Fig. 1, C-F). In addition, morphine- and fentanyl-activated ERK exhibited different cellular locations. Fentanyl-activated ERK showed significant nuclear translocation, whereas morphine-activated ERK mainly in the cytosol (Fig. S2). These results indicate distinct differences between ERK activation pathways activated by morphine and fentanyl in NPC, similar to our previous observations with other cell lines [39].
Figure 1. Morphine and fentanyl activate ERK via differential pathways.
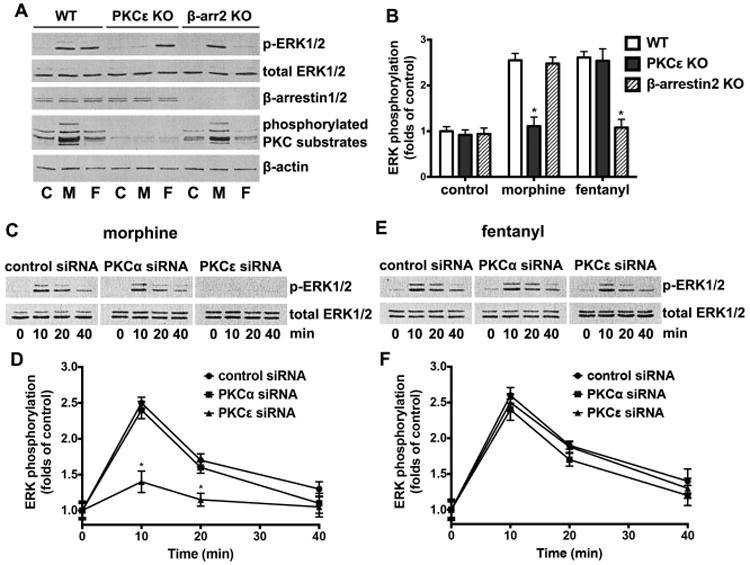
(A) ERK phosphorylation was tested in wild type, PKCε KO or β-arrestin2 KO NPCs cultured in differentiation media by immunoblotting after treatment of 1 μM morphine or 10 nM fentanyl for 10 min. PKC activities were determined with immunoblotting of PKC phosphorylated substrates. β-actin was used as the internal control. C: control; M: morphine; F: fentanyl.
(B) Quantification of ERK phosphorylation as shown in (A), calculated as folds of control. *, p<0.05 compared to wild type cells treated with the same agonist. Data are the mean ± SEM of four independent experiments.
(C) ERK phosphorylation was tested in NPCs transfected with control siRNA, PKCα siRNA and PKCε siRNA by immunoblotting after treatment of 1 μM morphine 10 min.
(D) Quantification of ERK phosphorylation as shown in (C), calculated as folds of control. *, p<0.05 compared to cells transfected with control siRNA. Data are the mean ± SEM of four independent experiments.
(E) ERK phosphorylation was tested in NPCs transfected with control siRNA, PKCα siRNA and PKCε siRNA by immunoblotting after treatment of 10 nM fentanyl for 10 min.
(F) Quantification of ERK phosphorylation as shown in (E), calculated as folds of control. Data are the mean ± SEM of four independent experiments.
Morphine promotes astrocyte-preferential differentiation via PKCε-mediated ERK phosphorylation
To confirm the roles of different ERK activation pathways on NPC differentiation, we examined whether they were related to the modulation of NPC lineages. Using βIII-tubulin (Tuj1), glial fibrillary acidic protein (GFAP) and O4 as markers for neurons, astrocytes and oligodendrocytes respectively, there were equal percentages of cells stained positive for these markers after differentiation of NPCs isolated from wild type, PKCε and β-Arr2 KO mice (Fig. 2, A and B). In wild type mice, morphine treatment resulted in a large percentage of GFAP+ cells (59.7±6.8%) but very few Tuj1+ neurons (5.3±2.2%), with no change in O4+ cells (35.0±5.1%). We observed similar results in in NPCs from β-Arr2 KO mice. However, this morphine effect was absent in NPCs isolated from PKCε KO mice, as reflected in non-preferential differentiation of the NPCs (Fig. 2, A and B). This suggests that PKCε activation is essential in morphine-induced astrocyte-preferential NPC differentiation.
Figure 2. Morphine promotes astrocyte-preferential differentiation via PKCε-mediated ERK phosphorylation.

(A) Hippocampal neural progenitor cells derived from wild type, PKCε knockout and β-arrestin2 knockout mice were cultured in complete differentiation medium for 4 d, with or without the treatment of 1 μM morphine. Cells were stained with markers for neurons (Tuj1), astrocytes (GFAP), oligodendrocytes (O4) and with DAPI. Images are representative four independent experiments with similar results. Scale bar, 25 μm. β-arr: β-arrestin.
(B) Quantification of cells stained with each marker in (A), calculated as the percentage of the total number of cells stained with DAPI. Red: Tuj1; Green: GFAP; Purple: O4. *, p<0.05; **, p<0.01 compared to the same marker in control group of the same cell line. #, p<0.05 compared to the same marker in the wild type control group. Data are the mean ± SEM of four independent experiments. WT: wild type; KO: knockout.
(C) Hippocampal neural progenitor cells were cultured in complete differentiation medium for 4 d, with or without the treatment of 1 μM morphine and pretreatment of 10 μM U0126 for 1 h. Cells were stained with Tuj1, GFAP and DAPI. Scale bar, 25 μm. Images are representative of four independent experiments with similar results.
(D) Quantification of cells stained with each marker in (C), calculated as the percentage of the total number of cells stained with DAPI. Red: Tuj1; Green: GFAP. *, p<0.05 compared to the same marker in morphine-treated group without U0126 pretreatment. #, p<0.05 compared to the same marker in the control group. Data are the mean ± SEM of four independent experiments.
As ERK is activated downstream of PKCε and β-arrestins, we then examined its role in morphine-modulated NPC differentiation. By using the MAPK/ERK kinase (MEK) inhibitor U0126, we were able to block ERK activation in NPCs. As shown in Fig. 2C and 2D, pretreatment with 10 μM U0126 for 1 h blocked the effect of morphine by decreasing the percentage of GFAP+ cells (from 57.3±7.2% to 36.3%±3.8%) and increasing that of Tuj1+ neurons (from 8.9±2.8% to 36.7±4.0%). The immunofluorescence results were further confirmed by examining lineage-specific markers, βIII-tubulin, GFAP and myelin basic protein (MBP, oligodendrocyte marker) using quantitative reverse transcription PCR (qRT-PCR) (Fig. S3). These results indicate that PKCε-mediated ERK phosphorylation plays a major role in morphine-induced astrocyte-preferential differentiation of NPCs.
Morphine promotes TRBP phosphorylation and Dicer expression via OPRM1
Previously, we reported that morphine's control of miR-181a levels occurs via OPRM1-mediated regulation of microRNA processing [23]. We examined whether the morphine effect is due to modulation of specific mRNA processing enzymes. The levels of Drosha, Dicer, TRBP and ERK in NPCs were determined after 1 μM morphine or 10 nM fentanyl treatment for 24 h, with or without pretreatment of 10 μM OPRM1-specific antagonist Cys2-Tyr3-Orn5-Pen7-amide (CTOP) for 1 h. As indicated in Fig. 3, morphine significantly increased both Dicer expression (2.10±0.12 folds) and TRBP phosphorylation (3.23±0.24 folds), but had no significant effect on the level of Drosha. Fentanyl, on the other hand, did not show any significant effect on the levels of all three proteins despite activating ERK. The effect of morphine was blocked in the presence of CTOP, indicating the involvement of OPRM1. On the other hand, the mRNA levels of TRBP and Dicer remained stable in the presence of both ligands (Fig. 3E), indicating an effect of protein stabilization but not transcriptional regulation. These results suggest that morphine regulates microRNA processing in NPCs by promoting both TRBP phosphorylation and Dicer expression at via OPRM1.
Figure 3. Morphine promotes TRBP phosphorylation and Dicer expression via OPRM1.

(A) Adult hippocampus-derived neural progenitor cells were cultured in complete differentiation medium for 24 h, with or without the treatment of 1 μM morphine or 10 nM fentanyl, and pretreatment of 10 μM CTOP for 1 h. The protein levels of Drosha, Dicer, TRBP and ERK1/2 were determined by western blot. β-actin was used as the internal control.
(B-D) Quantification of protein levels of Drosha (B), Dicer (C) and phospho-TRBP (D) as shown in (A), calculated as folds of control. *, p<0.05 compared to control. Data are the mean ± SEM of four independent experiments.
(E) The expression of TRBP and Dicer mRNAs were determined by qRT-PCR after 24 h of differentiation with indicated treatments. The results were normalized against those of GAPDH. All data represent mean ± SEM of four independent experiments.
Morphine promotes TRBP phosphorylation and Dicer expression via PKCε-mediated ERK activation
We have shown that morphine activates ERK via PKCε (Fig. 1) and promotes TRBP phosphorylation and Dicer expression (Fig. 3) in NPCs. Since it was reported that TRBP phosphorylation and Dicer expression are ERK mediated, we thus hypothezise that morphine-induced regulation of TRBP and Dicer is mediated by the PKCε-ERK pathway. We first examined the effect of 1 μM morphine or 10 nM fentanyl treatment on the protein levels of TRBP and Dicer in NPCs isolated from wild type, PKCε knockout and β-arrestin2 knockout mice. Whereas the ability of morphine to increase TRBP phosphorylation (from 3.34±0.21 folds to 0.95±0.23 folds) and Dicer expression (from 2.38±0.24 folds to 1.13±0.29 folds) was eliminated in NPCs isolated from PKCε knockout mice, it remained unaffected in those isolated from β-arrestin2 knockout mice (Fig. 4, A and B). Similarly, when the NPCs were pretreated with 10 μM U0126 for 1 h in order to block ERK phosphorylation, the ability of morphine to regulate TRBP phosphorylation (from 3.36±0.25 folds to 1.36±0.16 folds) and Dicer expression (from 2.10±0.12 folds to 1.23±0.13 folds) was also eliminated (Fig. 4, C and D). Fentanyl, on the other hand, did not exhibit any significant effects on the NPCs isolated from either the wild type or the knockout mice. Thus, morphine promotes TRBP phosphorylation and Dicer expression via PKCε-mediated ERK activation.
Figure 4. Morphine promotes TRBP phosphorylation and Dicer expression via PKCε and ERK activation.
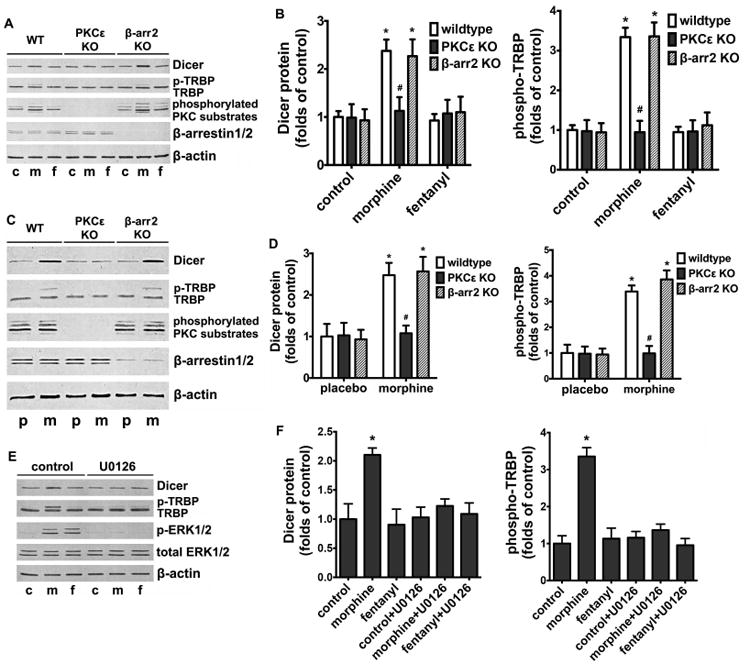
(A) NPCs derived from wild type, PKCε knockout and β-arrestin2 knockout mice were cultured in complete differentiation medium for 24 h, with or without the treatment of 1 μM morphine or 10 nM fentanyl. The protein levels of Dicer, TRBP, phosphorylated PKC substrates and β-arrestin1/2 were determined by western blot. β-actin was used as the internal control. c: control; m: morphine; f: fentanyl.
(B) Quantification of protein levels of Dicer and phospho-TRBP as shown in (A), calculated as folds of control. *, p<0.05 compared to control group of the same cell line. #, p<0.05 compared to wild type cells with the same agonist treatment. Data are the mean ± SEM of four independent experiments.
(C) Wild type, PKCε knockout and β-arrestin2 knockout mice were treated by subcutaneous implantation of one morphine pellet (75 mg free base per mouse) or placebo pellets for 4 days. The hippocampi of treated mice were collected and the protein levels of Dicer, TRBP, phosphorylated PKC substrates and β-arrestin1/2 were determined by western blot. β-actin was used as the internal control. p: placebo; m: morphine.
(D) Quantification of protein levels of Dicer and phospho-TRBP as shown in (C), calculated as folds of control. *, p<0.05 compared to placebo of the same animal group. #, p<0.05 compared to wild type with the same treatment. Data are the mean ± SEM of eight independent experiments.
(E) NPCs were cultured in complete differentiation medium for 24 h, with or without the treatment of 1 μM morphine or 10 nM fentanyl, and pretreatment of 10 μM U0126 for 1 h. The protein levels of Dicer, TRBP and ERK were determined by western blot. β-actin was used as the internal control. c: control; m: morphine; f: fentanyl.
(F) Quantification of protein levels of Dicer and phospho-TRBP as shown in (E), calculated as folds of control. *, p<0.05 compared to control. Data are the mean ± SEM of four independent experiments.
TRBP phosphorylation mediates Dicer expression and activation of the miR-181a/Prox1/Notch1 cascade
As TRBP phosphorylation has been shown to stabilize the miRNA-generating complex [37], we next investigated the functionality of phospho-TRBP on Dicer expression and the miR-181a pathway in NPCs. NPCs were transiently transfected with wild type, phospho-mutant (serine-to-alanine, SΔA) and phospho-mimic (serine-to-aspartate, SΔD) TRBP DNA constructs. All cells were treated with 1 μM morphine or 10 nM fentanyl for 24 h and both mRNA and protein levels of Dicer and TRBP were examined. Although all cell lines expressed similar levels of Dicer and TRBP mRNAs (Fig. 5A), the expression of Dicer protein was inhibited when TRBP phosphorylation was blocked in SΔA cells (Fig. 5, B and C). The capability of morphine to increase Dicer protein was eliminated in SΔA cells (from 2.07±0.24 folds in wild type cells to 0.80±0.19 folds), showing the same level as those in control and fentanyl-treated groups. In SΔD cells, however, TRBP phosphorylation was enhanced in control and fentanyl-treated groups, but not in morphine-treated cells (Fig. 5, B and C). Meanwhile, Dicer expression was also increased in control and fentanyl-treated cells, with levels similar to those observed in morphine-treated cells. These results suggest that morphine-induced increase in Dicer expression is mediated by TRBP phosphorylation.
Figure 5. TRBP phosphorylation mediates Dicer expression and activation of the miR-181a/Prox1/Notch1 cascade.
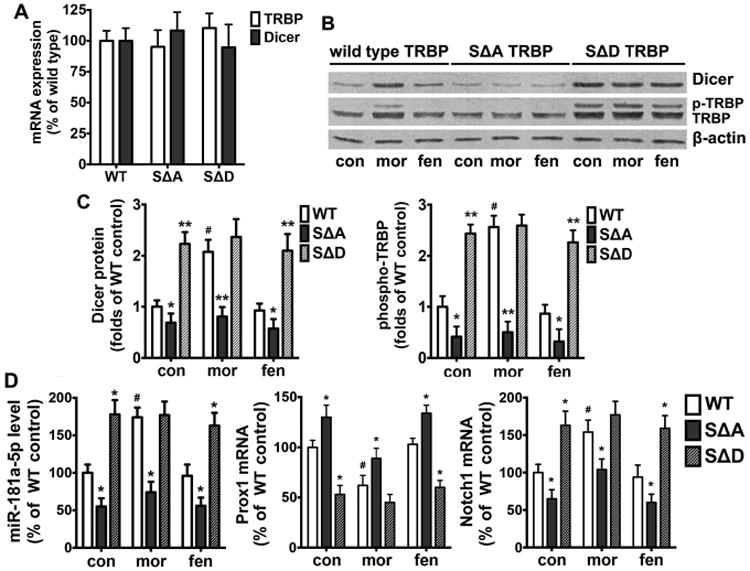
(A) NPCs were transfected with wild type, SΔA or SΔD TRBP and cultured in complete differentiation medium for 24 h, and the expression of TRBP and Dicer mRNAs were determined by qRT-PCR. The results were normalized against those of GAPDH. All data represent mean ± SEM of four independent experiments.
(B) NPCs transfected wild type, SΔA or SΔD TRBP were cultured in complete differentiation medium for 24 h, with or without the treatment of 1 μM morphine or 10 nM fentanyl. The protein levels of Dicer and TRBP were determined by western blot. β-actin was used as the internal control. con: control; mor: morphine; fen: fentanyl.
(C) Quantification of protein levels of Dicer and phospho-TRBP as shown in (B), calculated as folds of wild type control. *, p<0.05; **, p<0.01 compared to wild type cells with the same agonist treatment. #, p<0.05 compared to wild type control. Data are the mean ± SEM of four independent experiments.
(D) The expression of miR-181a-5p and mRNA levels of Prox1 and Notch1 were determined by qRT-PCR after 24 h of agonist treatment. The results were normalized against the level of GAPDH, and further normalized against the result obtained from wild type control group. *, p<0.05; **, p<0.01 compared to wild type cells with the same agonist treatment. #, p<0.05 compared to wild type control. All data represent the mean ± SEM of four independent experiments.
Since phospho-TRBP and Dicer are major components of the microRNA-generating complex, we investigated whether the elevated miR-181a level in NPCs induced by morphine is a direct consequence of morphine-mediated increase in phospho-TRBP. qRT-PCR analysis was carried out to quantify miR-181a, Prox1 and Notch1 in NPCs transfected with wild type or SΔA, SΔD mutant TRBP. As shown in Fig. 5D, expression of SΔA significantly increased Prox1 mRNA level and decreased miRNA-181a and Notch1 mRNA levels in NPCs in regardless of agonist treatment. Conversely, expression of SΔD decreased Prox1 mRNA level and increased miRNA-181a and Notch1 mRNA levels in NPCs without morphine treatment, but significantly affected the levels in morphine-treated NPCs (Fig. 5D). Taken together, these data suggest that the morphine-induced increase in TRBP phosphorylation and subsequent Dicer expression is critical in facilitating miR-181a maturation and modulation of Prox1 and Notch1 mRNA levels in NPCs.
TRBP phosphorylation modulates morphine-induced astrocyte-preferential differentiation of NPCs
Since TRBP phosphorylation was shown to be essential for miR-181a maturation and thus regulate the expression of Prox1 and Notch1 (Fig. 6), we then tested its role in lineage determination during NPC differentiation. NPCs were transfected with wild type, SΔA or SΔD mutant TRBP and treated with 1 μM morphine for four days before Tuj1+ neurons and GFAP+ astrocytes were detected by immunocytochemistry. As shown in Fig. 6A and 6B, after transient SΔA transfection, the percentage GFAP+ astrocytes with or without morphine treatment decreased from 59.7±8.9% and 35.8±4.8% (wild type) to 30.1±5.5% and 24.6±4.3%, respectively. Meanwhile, the percentage of Tuj1+ neurons in the presence of morphine increased correspondingly. On the other hand, transfection of SΔD increased the percentage of GFAP+ astrocytes to 61.3±9.1%, with concomitant decrease of Tuj1+ neurons (from 29.6±5.6% to 15.3±4.2%). Interestingly, morphine treatment did not further increase the percentage of NPC differentiated into GFAP+ astrocytes. To substantiate these observations, qRT-PCR analyses were carried out to quantify βIII-tubulin and GFAP. Transfection of SΔA significantly increased βIII-tubulin mRNA level and decreased GFAP mRNA level in NPCs treated with or without morphine. In contrast, expression of SΔD decreased βIII-tubulin mRNA level and increased GFAP mRNA level in NPCs without morphine treatment, but did not show significant effects in morphine-treated NPCs (Fig. 6C). Taken together, these data suggest that TRBP phosphorylation is a crucial step leading to morphine-induced astrocyte-preferential differentiation.
Figure 6. TRBP phosphorylation modulates morphine-induced astrocyte-preferential differentiation of NPCs.

(A) NPCs transfected wild type, SΔA or SΔD TRBP were cultured in complete differentiation medium for 4 d, with or without the treatment of 1 μM morphine. Cells were stained with markers for neurons (Tuj1), astrocytes (GFAP) and with DAPI. Scale bar, 25 μm. Images are representative of four independent experiments with similar results.
(B) Quantification of cells stained with each marker, calculated as the percentage of the total number of cells stained with DAPI. Red: Tuj1; Green: GFAP. *, p<0.05 compared to wild type groups with the same treatment. #, p<0.05 compared to the wild type control.
(C) The mRNA levels of βIII-tubulin and GFAP were determined by qRT-PCR after 4 d of differentiation with indicated treatments. The results were normalized against GAPDH levels. *, p<0.05, **, p<0.01, compared to wild type groups with the same treatment. #, p<0.05 compared to the wild type control. All data represent mean ± SEM of four independent experiments. WT: wild type.
Discussion
Previously, we demonstrated that the miR-181a/Prox1/Notch1 cascade plays an essential role in morphine-induced astrocyte-preferential differentiation [23]. However, the mechanism by which morphine and fentanyl differentially regulate miR-181a expression remains to be clarified. In our current study, we demonstrate that morphine and fentanyl activate ERK via PKCε- and β-arrestin-dependent pathways, respectively. This results in differential cellular localization of phosphorylated ERKs, either in the cytosol or in the nucleus. The fact that ERK activated via PKC-dependent pathway is retained in the cytosol is contrary to the accepted dogma. Hence, we hypothesize that certain cellular factors other than β-arrestins might be involved in the cytosolic retention of phosphorylated ERK. Only the morphine-induced PKCε-mediated and cytosol-localized activated ERK is capable of inducing TRBP phosphorylation, thereby promoting Dicer expression and miR-181a maturation. Fentanyl, however, does not induce these effects despite its ability to activate OPRM1 and ERK. The difference between the two agonists is ultimately reflected in the lineage-specific differentiation of NPCs (Fig. 7). Overall, these results indicate an important role of OPRM1 agonist-selective pathway-dependent signaling in the progenitor cell fate determination.
Figure 7. A schematic diagram summarizing the signaling pathways of morphine and fentanyl regulating adult neurogenesis.
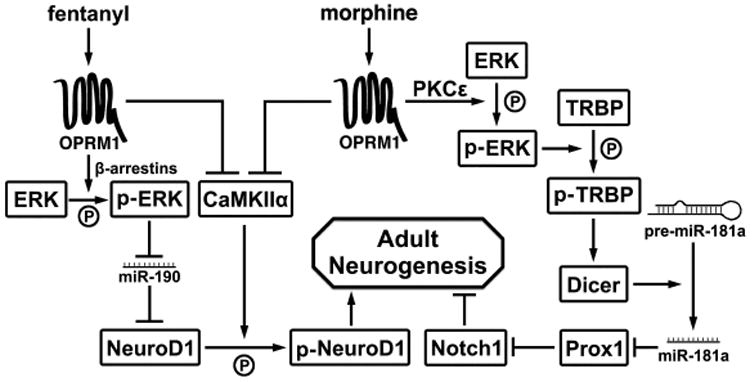
As indicated in our current study, morphine's inhibition of neurogenesis by modulating miR-181a maturation and NPC differentiation depends on ERK activation. This observation is consistent with our previous studies showing that morphine-induced ERK activation inhibits adult neurogenesis and subsequent contextual memory retention [22]. Such effects can be attributed to the regulation of NeuroD1 level by miR-190 [21], which is in turn regulated by the ERK phosphorylation pathway [39]. These observations begin to elucidate the role of OPRM1's ligand selective signaling in regulating adult neurogenesis (Fig. 7). ERK activated by morphine remains in the cytosol and does not induce the transcription factor YY1 phosphorylation, thus having no effect on the miR-190 level via the talin2 transcription [43]. Furthermore, cytosolic phosphorylated ERK promotes the phosphorylation of other cytosolic substrates such as TRBP, which in turn up-regulates Dicer expression and facilitates miR-181a maturation. This drives an up-regulation of Notch1 expression and astrocyte-preferential differentiation of NPCs [23]. Thus, morphine attenuates adult neurogenesis via dual mechanisms. Its ability to phosphorylate TRBP gives rise to activation of the miR-181a/Prox1/Notch1 pathway, resulting in a decreased number of neurons [23]. In addition, its inability to alter miR-190 level and its inhibition of CaMKIIα activity results in attenuation of NeuroD1 activity [21], which plays a major role in development of the nervous system [20]. By its differential regulation of various miRNAs, morphine impairs neurogenesis and subsequent behavioral alterations related to hippocampal functions (Fig. 7).
The posttranscriptional mechanism that modulates miRNA processing and maturation is supposed to show a universal effect on all members of the microRNA family, as Dicer and TRBP are in the microprocessing complex of all miRNAs. However, our current study shows the specific regulation of morphine on miR-181a. The specificity of such TRBP-mediated regulation has been demonstrated in the preferential up-regulation of the pro-growth miRNAs such as miR-17, miR-20a and miR-92a, but down-regulation of let-7 [37]. The inhibition of miR-103 maturation induced by apigenin is also related to decrease phosphorylation of ERK and TRBP [38]. It is likely that certain RNA-binding proteins might participate in the processing of pre-miRNAs. For example, the KH-type splicing regulatory protein (KSRP) facilitates Dicer-mediated processing of a series of pre-miRNAs through its interaction with the terminal loop [44]. Lin28 was shown to modulate pri-let-7 and pre-let-7 processing [45]. Dead End 1 was demonstrated to modulate interactions between the miRNA silencing machinery and target mRNAs [46]. RNA methylation mediated by RNA methyltransferase BCDIN3D was also shown to interfere with Dicer-mediated pre-miRNA processing [47]. Whether such proteins are involved in the morphine-induced TRBP-mediated modulation of pre-miRNA-181a processing remains to be demonstrated.
In spite of the specificity of TRBP-mediated regulation of pre-miRNA processing shown by previous studies, it is nevertheless probable that morphine modulates some other miRNAs besides miR-181a via this pathway. In a microarray screen, we have previously shown that morphine up-regulats the expression of several miRNAs including miR-224, 331, 365 and 20a [21]. Others have reported that morphine modulate miR-103, 107 [48] and 133b [49]. Because ERKs activated by morphine do not translocate into the nucleus, it is likely that morphine modulate these miRNAs via TRBP phosphorylation in the cytosol, rather than at the transcription level. Hence the multiple miRNAs that are regulated by morphine could modulate many aspects of adult neurogenesis via TRBP phosphorylation and miRNA processing.
Conclusion
Morphine and fentanyl activate ERK via differential pathways. Morphine-induced ERK phosphorylation is mediated by PKCε and localizes in the cytosol, and is therefore capable of inducing TRBP phosphorylation. Phosphorylated TRBP promotes Dicer expression by stabilizing the miRNA-generating complex and thus facilitates miR-181a maturation, which finally results in astrocyte-preferential differentiation of NPCs.
Supplementary Material
Significance Statement.
Although it is well-known that addictive drugs such as morphine modulate neurogenesis, the mechanism by which morphine regulates miR181a/Prox1/Notch1 remains elusive. We identified the roles of PKCε and phosphorylated ERK is this process by using hippocampal neural progenitor cells (NPCs) isolated from PKCε knockout mice. We also used the MEK inhibitor U0126 to block morphine-induced astrocyte-preferential differentiation. Cytosolic phospho-ERK is capable of phosphorylating TRBP, a Dicer cofactor that promotes maturation of miR-181a. In summary, this study demonstrates that morphine's modulation of NPC differentiation is mediated by PKCε-dependent ERK activation and subsequent TRBP phosphorylation and miR-181a maturation.
Acknowledgments
We thank Dr. Robert J. Lefkowitz (Howard Hughes Medical Institute, Duke University) for providing β-arrestin2-knockout mice and Dr. George L. Wilcox (Department of Neuroscience, University of Minnesota) for providing PKCε-knockout mice. We thank Dr. Qinghua Liu (Department of Biochemistry, University of Texas Southwestern Medical Center) for providing DNA constructs of wild type and mutant TRBP. We thank Patrick W McGarrah (Department of Pharmacology, University of Minnesota) for proofreading and editing the manuscript. Research is supported by NIDA Grant DA031442-03.
This work was supported by National Institutes of Health, National Institute of Drug Abuse (Grant DA031442-03).
Footnotes
Author Contribution: Chi Xu: Conception and design, Provision of study material, Collection and assembly of data, Data analysis and interpretation, Manuscript writing, Final approval of manuscript
Hui Zheng: Conception and design
Horace H. Loh: Conception and design
Ping-Yee Law: Conception and design, Financial support, Provision of study material, Data analysis and interpretation, Manuscript writing, Final approval of manuscript
References
- 1.Frankland PW, Miller FD. Regenerating your senses: multiple roles for neurogenesis in the adult brain. Nature neuroscience. 2008;11:1124–1126. doi: 10.1038/nn1008-1124. [DOI] [PubMed] [Google Scholar]
- 2.De La Rosa-Prieto C, De Moya-Pinilla M, Saiz-Sanchez D, et al. Olfactory and cortical projections to bulbar and hippocampal adult-born neurons. Frontiers in neuroanatomy. 2015;9:4. doi: 10.3389/fnana.2015.00004. [DOI] [PMC free article] [PubMed] [Google Scholar]
- 3.Kempermann G, Jessberger S, Steiner B, et al. Milestones of neuronal development in the adult hippocampus. Trends in neurosciences. 2004;27:447–452. doi: 10.1016/j.tins.2004.05.013. [DOI] [PubMed] [Google Scholar]
- 4.Gage FH. Mammalian neural stem cells. Science. 2000;287:1433–1438. doi: 10.1126/science.287.5457.1433. [DOI] [PubMed] [Google Scholar]
- 5.Aimone JB, Li Y, Lee SW, et al. Regulation and Function of Adult Neurogenesis: From Genes to Cognition. Physiological reviews. 2014;94:991–1026. doi: 10.1152/physrev.00004.2014. [DOI] [PMC free article] [PubMed] [Google Scholar]
- 6.Abrous DN, Koehl M, Le Moal M. Adult neurogenesis: from precursors to network and physiology. Physiological reviews. 2005;85:523–569. doi: 10.1152/physrev.00055.2003. [DOI] [PubMed] [Google Scholar]
- 7.Canales JJ. Adult neurogenesis and the memories of drug addiction. European archives of psychiatry and clinical neuroscience. 2007;257:261–270. doi: 10.1007/s00406-007-0730-6. [DOI] [PubMed] [Google Scholar]
- 8.Kamboj SK, Tookman A, Jones L, et al. The effects of immediate-release morphine on cognitive functioning in patients receiving chronic opioid therapy in palliative care. Pain. 2005;117:388–395. doi: 10.1016/j.pain.2005.06.022. [DOI] [PubMed] [Google Scholar]
- 9.Willner D, Cohen-Yeshurun A, Avidan A, et al. Short term morphine exposure in vitro alters proliferation and differentiation of neural progenitor cells and promotes apoptosis via mu receptors. PloS one. 2014;9:e103043. doi: 10.1371/journal.pone.0103043. [DOI] [PMC free article] [PubMed] [Google Scholar]
- 10.Eisch AJ, Barrot M, Schad CA, et al. Opiates inhibit neurogenesis in the adult rat hippocampus. Proceedings of the National Academy of Sciences of the United States of America. 2000;97:7579–7584. doi: 10.1073/pnas.120552597. [DOI] [PMC free article] [PubMed] [Google Scholar]
- 11.Bernstein HG, Trubner K, Krebs P, et al. Increased densities of nitric oxide synthase expressing neurons in the temporal cortex and the hypothalamic paraventricular nucleus of polytoxicomanic heroin overdose victims: possible implications for heroin neurotoxicity. Acta histochemica. 2014;116:182–190. doi: 10.1016/j.acthis.2013.07.006. [DOI] [PubMed] [Google Scholar]
- 12.Teuchert-Noodt G, Dawirs RR, Hildebrandt K. Adult treatment with methamphetamine transiently decreases dentate granule cell proliferation in the gerbil hippocampus. Journal of neural transmission. 2000;107:133–143. doi: 10.1007/s007020050012. [DOI] [PubMed] [Google Scholar]
- 13.Ekthuwapranee K, Sotthibundhu A, Govitrapong P. Melatonin attenuates methamphetamine-induced inhibition of proliferation of adult rat hippocampal progenitor cells in vitro. Journal of pineal research. 2015;58:418–428. doi: 10.1111/jpi.12225. [DOI] [PubMed] [Google Scholar]
- 14.Yamaguchi M, Suzuki T, Seki T, et al. Repetitive cocaine administration decreases neurogenesis in adult rat hippocampus. Annals of the New York Academy of Sciences. 2004;1025:351–362. doi: 10.1196/annals.1316.043. [DOI] [PubMed] [Google Scholar]
- 15.Blanco-Calvo E, Rivera P, Arrabal S, et al. Pharmacological blockade of either cannabinoid CB1 or CB2 receptors prevents both cocaine-induced conditioned locomotion and cocaine-induced reduction of cell proliferation in the hippocampus of adult male rat. Frontiers in integrative neuroscience. 2014;7:106. doi: 10.3389/fnint.2013.00106. [DOI] [PMC free article] [PubMed] [Google Scholar]
- 16.Jang MH, Shin MC, Jung SB, et al. Alcohol and nicotine reduce cell proliferation and enhance apoptosis in dentate gyrus. Neuroreport. 2002;13:1509–1513. doi: 10.1097/00001756-200208270-00004. [DOI] [PubMed] [Google Scholar]
- 17.Rueda D, Navarro B, Martinez-Serrano A, et al. The endocannabinoid anandamide inhibits neuronal progenitor cell differentiation through attenuation of the Rap1/B-Raf/ERK pathway. The Journal of biological chemistry. 2002;277:46645–46650. doi: 10.1074/jbc.M206590200. [DOI] [PubMed] [Google Scholar]
- 18.Song P, Zhao ZQ. The involvement of glial cells in the development of morphine tolerance. Neuroscience research. 2001;39:281–286. doi: 10.1016/s0168-0102(00)00226-1. [DOI] [PubMed] [Google Scholar]
- 19.Persson AI, Thorlin T, Bull C, et al. Mu- and delta-opioid receptor antagonists decrease proliferation and increase neurogenesis in cultures of rat adult hippocampal progenitors. The European journal of neuroscience. 2003;17:1159–1172. doi: 10.1046/j.1460-9568.2003.02538.x. [DOI] [PubMed] [Google Scholar]
- 20.Cho JH, Tsai MJ. The role of BETA2/NeuroD1 in the development of the nervous system. Molecular neurobiology. 2004;30:35–47. doi: 10.1385/MN:30:1:035. [DOI] [PubMed] [Google Scholar]
- 21.Zheng H, Zeng Y, Zhang X, et al. mu-Opioid receptor agonists differentially regulate the expression of miR-190 and NeuroD. Molecular pharmacology. 2010;77:102–109. doi: 10.1124/mol.109.060848. [DOI] [PMC free article] [PubMed] [Google Scholar]
- 22.Zheng H, Zhang Y, Li W, et al. NeuroD modulates opioid agonist-selective regulation of adult neurogenesis and contextual memory extinction. Neuropsychopharmacology : official publication of the American College of Neuropsychopharmacology. 2013;38:770–777. doi: 10.1038/npp.2012.242. [DOI] [PMC free article] [PubMed] [Google Scholar]
- 23.Xu C, Zhang Y, Zheng H, et al. Morphine Modulates Mouse Hippocampal Progenitor Cell Lineages by Upregulating miR-181a Level. Stem cells. 2014;32:2961–2972. doi: 10.1002/stem.1774. [DOI] [PMC free article] [PubMed] [Google Scholar]
- 24.Bartel DP. MicroRNAs: genomics, biogenesis, mechanism, and function. Cell. 2004;116:281–297. doi: 10.1016/s0092-8674(04)00045-5. [DOI] [PubMed] [Google Scholar]
- 25.Ha M, Kim VN. Regulation of microRNA biogenesis. Nature reviews Molecular cell biology. 2014;15:509–524. doi: 10.1038/nrm3838. [DOI] [PubMed] [Google Scholar]
- 26.Lee Y, Ahn C, Han J, et al. The nuclear RNase III Drosha initiates microRNA processing. Nature. 2003;425:415–419. doi: 10.1038/nature01957. [DOI] [PubMed] [Google Scholar]
- 27.Hutvagner G, McLachlan J, Pasquinelli AE, et al. A cellular function for the RNA-interference enzyme Dicer in the maturation of the let-7 small temporal RNA. Science. 2001;293:834–838. doi: 10.1126/science.1062961. [DOI] [PubMed] [Google Scholar]
- 28.Jiang F, Ye X, Liu X, et al. Dicer-1 and R3D1-L catalyze microRNA maturation in Drosophila. Genes & development. 2005;19:1674–1679. doi: 10.1101/gad.1334005. [DOI] [PMC free article] [PubMed] [Google Scholar]
- 29.Chendrimada TP, Gregory RI, Kumaraswamy E, et al. TRBP recruits the Dicer complex to Ago2 for microRNA processing and gene silencing. Nature. 2005;436:740–744. doi: 10.1038/nature03868. [DOI] [PMC free article] [PubMed] [Google Scholar]
- 30.Filipowicz W, Bhattacharyya SN, Sonenberg N. Mechanisms of post-transcriptional regulation by microRNAs: are the answers in sight? Nature reviews Genetics. 2008;9:102–114. doi: 10.1038/nrg2290. [DOI] [PubMed] [Google Scholar]
- 31.Knuckles P, Vogt MA, Lugert S, et al. Drosha regulates neurogenesis by controlling neurogenin 2 expression independent of microRNAs. Nature neuroscience. 2012;15:962–969. doi: 10.1038/nn.3139. [DOI] [PubMed] [Google Scholar]
- 32.Saurat N, Andersson T, Vasistha NA, et al. Dicer is required for neural stem cell multipotency and lineage progression during cerebral cortex development. Neural development. 2013;8:14. doi: 10.1186/1749-8104-8-14. [DOI] [PMC free article] [PubMed] [Google Scholar]
- 33.Nowakowski TJ, Mysiak KS, O'Leary T, et al. Loss of functional Dicer in mouse radial glia cell-autonomously prolongs cortical neurogenesis. Developmental biology. 2013;382:530–537. doi: 10.1016/j.ydbio.2013.08.023. [DOI] [PMC free article] [PubMed] [Google Scholar]
- 34.Garcia MA, Meurs EF, Esteban M. The dsRNA protein kinase PKR: virus and cell control. Biochimie. 2007;89:799–811. doi: 10.1016/j.biochi.2007.03.001. [DOI] [PubMed] [Google Scholar]
- 35.Daniels SM, Gatignol A. The multiple functions of TRBP, at the hub of cell responses to viruses, stress, and cancer. Microbiology and molecular biology reviews : MMBR. 2012;76:652–666. doi: 10.1128/MMBR.00012-12. [DOI] [PMC free article] [PubMed] [Google Scholar]
- 36.Wilson RC, Tambe A, Kidwell MA, et al. Dicer-TRBP complex formation ensures accurate mammalian microRNA biogenesis. Molecular cell. 2015;57:397–407. doi: 10.1016/j.molcel.2014.11.030. [DOI] [PMC free article] [PubMed] [Google Scholar]
- 37.Paroo Z, Ye X, Chen S, et al. Phosphorylation of the human microRNA-generating complex mediates MAPK/Erk signaling. Cell. 2009;139:112–122. doi: 10.1016/j.cell.2009.06.044. [DOI] [PMC free article] [PubMed] [Google Scholar]
- 38.Ohno M, Shibata C, Kishikawa T, et al. The flavonoid apigenin improves glucose tolerance through inhibition of microRNA maturation in miRNA103 transgenic mice. Scientific reports. 2013;3:2553. doi: 10.1038/srep02553. [DOI] [PMC free article] [PubMed] [Google Scholar]
- 39.Zheng H, Loh HH, Law PY. Beta-arrestin-dependent mu-opioid receptor-activated extracellular signal-regulated kinases (ERKs) Translocate to Nucleus in Contrast to G protein-dependent ERK activation. Molecular pharmacology. 2008;73:178–190. doi: 10.1124/mol.107.039842. [DOI] [PMC free article] [PubMed] [Google Scholar]
- 40.Schuster DJ, Kitto KF, Overland AC, et al. Protein kinase Cepsilon is required for spinal analgesic synergy between delta opioid and alpha-2A adrenergic receptor agonist pairs. The Journal of neuroscience : the official journal of the Society for Neuroscience. 2013;33:13538–13546. doi: 10.1523/JNEUROSCI.4013-12.2013. [DOI] [PMC free article] [PubMed] [Google Scholar]
- 41.Khasar SG, Lin YH, Martin A, et al. A novel nociceptor signaling pathway revealed in protein kinase C epsilon mutant mice. Neuron. 1999;24:253–260. doi: 10.1016/s0896-6273(00)80837-5. [DOI] [PMC free article] [PubMed] [Google Scholar]
- 42.Zheng H, Chu J, Qiu Y, et al. Agonist-selective signaling is determined by the receptor location within the membrane domains. Proceedings of the National Academy of Sciences of the United States of America. 2008;105:9421–9426. doi: 10.1073/pnas.0802253105. [DOI] [PMC free article] [PubMed] [Google Scholar]
- 43.Zheng H, Chu J, Zeng Y, et al. Yin Yang 1 phosphorylation contributes to the differential effects of mu-opioid receptor agonists on microRNA-190 expression. The Journal of biological chemistry. 2010;285:21994–22002. doi: 10.1074/jbc.M110.112607. [DOI] [PMC free article] [PubMed] [Google Scholar]
- 44.Trabucchi M, Briata P, Garcia-Mayoral M, et al. The RNA-binding protein KSRP promotes the biogenesis of a subset of microRNAs. Nature. 2009;459:1010–1014. doi: 10.1038/nature08025. [DOI] [PMC free article] [PubMed] [Google Scholar]
- 45.Viswanathan SR, Daley GQ, Gregory RI. Selective blockade of microRNA processing by Lin28. Science. 2008;320:97–100. doi: 10.1126/science.1154040. [DOI] [PMC free article] [PubMed] [Google Scholar]
- 46.Kedde M, Strasser MJ, Boldajipour B, et al. RNA-binding protein Dnd1 inhibits microRNA access to target mRNA. Cell. 2007;131:1273–1286. doi: 10.1016/j.cell.2007.11.034. [DOI] [PubMed] [Google Scholar]
- 47.Xhemalce B, Robson SC, Kouzarides T. Human RNA methyltransferase BCDIN3D regulates microRNA processing. Cell. 2012;151:278–288. doi: 10.1016/j.cell.2012.08.041. [DOI] [PMC free article] [PubMed] [Google Scholar]
- 48.Lu Z, Xu J, Xu M, et al. Morphine regulates expression of mu-opioid receptor MOR-1A, an intron-retention carboxyl terminal splice variant of the mu-opioid receptor (OPRM1) gene via miR-103/miR-107. Molecular pharmacology. 2014;85:368–380. doi: 10.1124/mol.113.089292. [DOI] [PMC free article] [PubMed] [Google Scholar]
- 49.Garcia-Perez D, Lopez-Bellido R, Hidalgo JM, et al. Morphine regulates Argonaute 2 and TH expression and activity but not miR-133b in midbrain dopaminergic neurons. Addiction biology. 2013 doi: 10.1111/adb.12083. [DOI] [PubMed] [Google Scholar]
Associated Data
This section collects any data citations, data availability statements, or supplementary materials included in this article.