

Abstract
Purpose
To determine repeatability and agreement between the non-invasive tear break up time (NIK-BUT) as measured by the Oculus Keratograph 4 and fluorescein tear break up time (FBUT).
Methods
Sixty subjects were recruited for two study visits separated by 7 (± 2) days. At each visit, three NIK-BUT measures and FBUT measures were obtained. Each NIK-BUT measure from the Keratograph included a first and an average NIK-BUT. The means of the measures obtained, first NIK-BUT, average NIK-BUT and FBUT, were calculated for each visit. Between- and within-visit agreement was assessed using intraclass correlation coefficients (ICCs) and Bland-Altman 95% limits of agreement (LoA) analyses of log-transformed data.
Results
Between-visit ICCs were 0.53 (95% CI, 0.32-0.69) for first NIK-BUT, 0.59 (95% CI, 0.40-0.73) for average NIK-BUT, and 0.66 (95% CI, 0.49-0.78) for FBUT, whereas 95% LoA were -0.65 to 0.67, -0.44 to 0.48, and -1.14 to 1.10, [back transformed: (visit 1 + 0.01) / (visit 2 + 0.01) = 0.22 to 4.68, 0.36 to 3.02, and 0.07 to 12.59] for the aforementioned methods, respectively. The visit one within-visit ICC between first NIK-BUT and FBUT was 0.44 (95% CI, 0.21-0.62), whereas the 95% LoA was -0.84 to 1.18 [back transformed: (first NIK-BUT + 0.01) / (FBUT + 0.01) = 0.14 to 15.14]. Likewise, the visit one within-visit ICC between average NIK-BUT and FBUT was 0.41 (95% CI, 0.18-0.60), whereas the 95% LoA was -0.58 to 1.44 [back transformed: (average NIK-BUT + 0.01) / (FBUT + 0.01) = 0.26 to 27.54].
Conclusions
The 95% LoA suggest that the average NIK-BUT has better between-visit agreement compared to the first NIK-BUT or FBUT. The first NIK-BUT showed better within-visit agreement with the FBUT than the average NIK-BUT. In addition, there is better between- and within-visit agreement for all measures at lower values.
Keywords: non-invasive tear break up time, fluorescein tear break up time, repeatability, tear film
Many conditions are diagnosed based on changes to a structure over time. Monitoring for progression can also indicate the effectiveness of a treatment. The importance of longitudinal observation of clinical findings in diagnosis and treatment emphasizes the importance of repeatability when assessing instrumentation used in clinical practice. Further, agreement between new and established methods is important as new technology is introduced for use clinically.
Studies have shown fluorescein tear break up time (FBUT) to be different between dry eye and normal patients, 1-3 and it is often used within clinical research to monitor the effectiveness of treatments.4-6 However, this measure has been shown to have modest repeatability at best when the same examiner performs the test.7, 8 The lack of consistent protocols regarding the instillation of fluorescein has been outlined by Korb, et al.9 The FBUT has been shown to be affected by the volume of fluorescein instilled into the eye10 and the methods of observation used by the examiner.7 Previous repeatability studies indicate that subjective assessment also causes some variability in measurements, even with the same examiner.8 Such factors must be considered when measures are taken across time and can limit the use of FBUT clinically.
Another way to measure tear break up time is the non-invasive tear break up time. In this procedure, an image is projected onto the tear film of the cornea. While the eye remains open, the integrity of the tear film becomes compromised or of varied thickness. This causes the edges of the lines within the image to appear broken. The advantage of this technique is that it eliminates the need for the instillation of fluorescein. An early form of this technique was used on humans by Mengher, et al11 and was later implemented by the Keeler TearScope and other clinical instruments. However, these devices still require a subjective assessment by an examiner to assign a numerical value for tear break up time. The Keratograph 4 introduced the non-invasive Keratograph break up time (NIK-BUT), which provides a numerical interpretation of a non-invasive tear break up time. There are many suggested advantages to this system including a standardized method that eliminates inter-examiner variability due to biomicroscopic light beam width and/or method of examination (scanning versus full illumination observation) and the ability for a trained technician to obtain results so that the doctor's time can be better utilized. However, the question remains as to its own repeatability, and agreement with the traditional measure of FBUT, which are the aims of this study.
Methods
This study was approved by the Institutional Review Board of the University of Houston, which follow the tenants of the Declaration of Helsinki. Informed consent and Health Insurance Portability and Accountability Act documents were verbally reviewed with each subject. He or she was given adequate time to review the documents, and then each signed the documents prior to any procedures.
The subjects were recruited for two study visits separated by five to nine days. The subjects were required to be 18 years of age or older. Subjects were excluded if they were pregnant or nursing or had participated in another study within two days prior to their current initial visit. Use of ocular and systemic medication was permitted, but the dosing and medication was required to remain unchanged for one month prior to the first study visit and over the course of the current study. The recruited cohort included 20 subjects without a history of contact lens wear, 20 subjects who had been diagnosed with dry eye in a clinical setting, and 20 current contact lens wearers.
Following enrollment, three NIK-BUT measures were obtained for each subject that were separated by two minutes each. The Keratograph 4 uses placido rings as the image projected onto the tear film. The instrument guides the examiner to center it, and the subject is instructed to blink twice. After the second blink, the Keratograph 4 immediately begins measuring the NIK-BUT, and the subject is instructed to hold the eye open without blinking. The measurement continues until the Keratograph has gathered the necessary information and ends the reading or the subject blinks.
The display screen for each NIK-BUT measure included a first NIK-BUT and an average NIK-BUT. For analysis the Keratograph 4 divides the projected image into sections. In simplified terms, when a disruption in the projected image is registered by the Keratograph 4 within a particular section, that section is assigned a value in seconds from the time the Keratograph begins the measurement. The first NIK-BUT is the first time that the Keratograph 4 recognizes a disruption in the projected placido rings. The average NIK-BUT is an average of the sections across the cornea.
To obtain the FBUT measures, five microliters of 2% liquid fluorescein were pipetted into the eye of the subject. The examiners looked at the tear film using a biomicroscope with a cobalt blue filter and a Wratten #12 yellow filter. The subject was instructed to blink a few times and then hold the eye open as long as possible. The examiners used a stopwatch to measure the time from the subject's blink to the first observed black spot within the tear film. This procedure was completed three times without any time between measures. The same clinical procedures were repeated at the second visit in the same manner and order.
The means of the three first NIK-BUT, three average NIK-BUT and three FBUT measures were calculated for each visit. A log transformation (base = 10) of the raw data was completed when Bland-Altman plots showed heteroscedasticity, as suggested by Bland and Altman.12 Note that the base chosen does not affect the relationships reported when back transformed. Some FBUT values were found to equal to zero, which would yield a log transformation of infinity. Therefore, as suggested by previous authors, 13 a negligible constant (here 0.01) was added to each mean value prior to taking the log of the mean value. Bland-Altman plots were used to show repeatability and agreement.14 These plots show the average of the two measures being compared against the difference of the same two measures.14 Each Bland-Altman plot includes the mean difference between the values and the 95% limits of agreement (95% LoA) for that mean difference (mean difference ± 1.96 * standard deviation of the difference). In each figure, the mean is illustrated by a solid line and dashed lines for the 95% LoA. The mean difference values were also compared to zero using a one-sample t-test to determine bias, and the p-values are reported. The between-visit repeatability of the first NIK-BUT, average NIK-BUT, and FBUT were as described above, as was within-visit agreement between the first NIK-BUT and FBUT and the average NIK-BUT and FBUT (visit one only). In addition, the intraclass correlation coefficient (ICC) and 95% confidence interval (95% CI) was found for each set of between- and within-visit comparisons noted above.12
Results
Descriptive Statistics
There were 60 subjects that completed this study, with an average age of 34.3 ± 15.9 years and 66.7% were female. All measures for this study were taken in the same building. The average first NIK-BUT from visit one was 6.12 ± 5.15 seconds, while it was 5.61 ± 4.21 seconds at visit two, and the average difference between the two values (visit one-visit two) was 0.50 ± 4.56 seconds. The mean average NIK-BUT from visit one was 9.23 ± 5.00 seconds, while it was 8.57 ± 4.21 seconds at visit two, and the average difference between the two values was 0.65 ± 4.19 seconds. Lastly, the average FBUT from visit one was 4.72 ± 4.88 seconds, while it was 5.16 ± 5.08 seconds at visit two, and the average difference between the two values was -0.43 ± 4.11 seconds.
Between-Visit Agreement
The Bland-Altman plot evaluating the between-visit agreement of the first NIK-BUT is shown in Figure 1. The mean difference of the log transformed first NIK-BUT data was 0.01 (p = 0.81) and the 95% LoA were -0.65 to 0.67 [back transformed 95% LoA: (visit 1 + 0.01) / (visit 2 + 0.01) = 0.22 to 4.68]. The ICC was 0.53 (95% CI = 0.32 - 0.69). The Bland-Altman plot for the between-visit agreement of the average NIK-BUT is shown in Figure 2. The mean difference of the log transformed average NIK-BUT data was 0.02 (p = 0.50), the 95% LoA were -0.44 to 0.48 [back transformed 95% LoA: (visit 1 + 0.01) / (visit 2 + 0.01) = 0.36 to 3.02], and the ICC was 0.59 (95% CI = 0.40 – 0.73). The Bland-Altman plot evaluating the between-visit agreement of the FBUT is shown in Figure 3. The mean difference of the log transformed FBUT data was -0.02 (p = 0.78), the 95% LoA were -1.14 to 1.10 [back transformed 95% LoA: (visit 1 + 0.01) / (visit 2 + 0.01) = 0.07 to 12.59], and the ICC was 0.66 (95% CI = 0.49 – 0.78).
Figure 1.
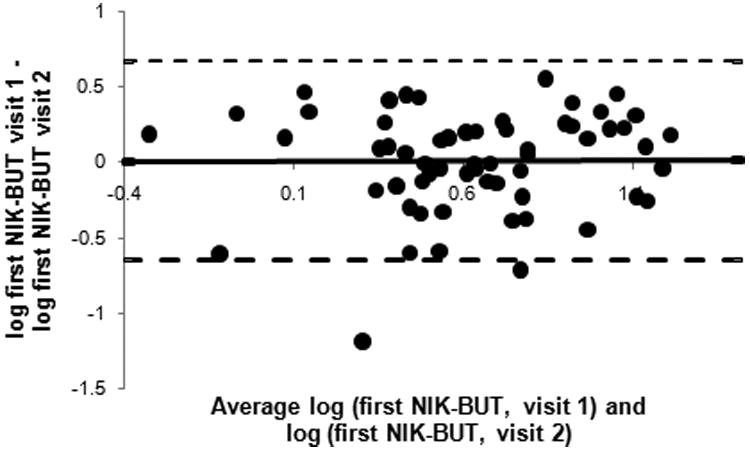
Comparison of first NIK-BUT between visits. Each point represents one subject.
Figure 2.
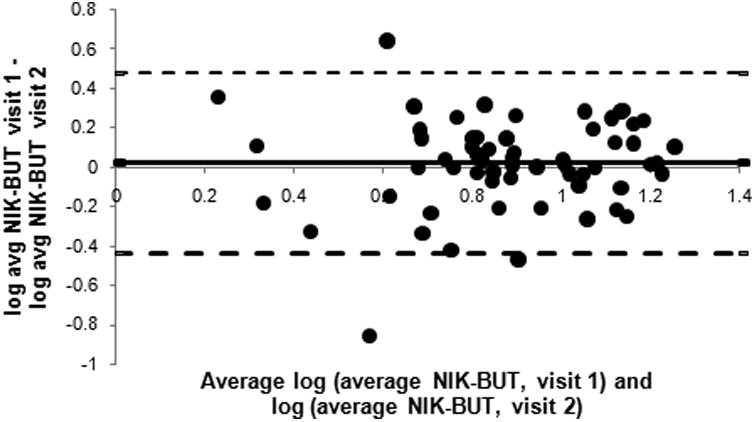
Comparison of average NIK-BUT between visits. Each point represents one subject.
Figure 3.

Comparison of FBUT between visits. Each point represents one subject.
Within-Visit Agreement
The within-visit agreement between the log transformed first NIK-BUT and FBUT (Figure 4), the mean difference was 0.17 (p = 0.01), the 95% LoA were -0.84 to 1.18 [back transformed 95% LoA: (first NIK-BUT + 0.01) / (FBUT + 0.01) = 0.14 to 15.14], and the ICC was 0.44 (95% CI = 0.21 – 0.62). The within-visit agreement between the log transformed average NIK-BUT and FBUT (Figure 5), the mean difference was 0.43 (p < 0.01), the 95% LoA were -0.58 to 1.44 [back transformed 95% LoA: (average NIK-BUT + 0.01) / (FBUT + 0.01) = 0.26 to 27.54], and the ICC was 0.41 (95% CI = 0.18 – 0.60).
Figure 4.

Comparison of first NIK-BUT and FBUT at visit one. Each point represents one subject.
Figure 5.

Comparison of average NIK-BUT and FBUT at visit one. Each point represents one subject.
Discussion
The initial observation of larger differences at higher values suggests more variability in repeated measures at higher values. This does indicate better repeatability at more critical values for dry eye subjects, who would be expected to have lower NIK-BUT values and FBUT values. This tendency was true when comparing the between visit first NIK-BUT, average NIK-BUT, and FBUT. The same appearance (more variation at higher values) being seen when comparing the within visit first NIK-BUT to FBUT and average NIK-BUT to FBUT is most likely a reflection of the between visit repeatability trend. This heteroscedasticity was noted in other studies comparing noninvasive tear break up times to fluorescein tear break up times.15-18
Between-Visit Agreement
The between-visit agreement Bland-Altman plots (Figures 1 through 3) show statistically insignificant biases based on the mean differences found for all three methods. The 95% LoA give an indication of the variation to expect for each measure from visit to visit for most patients in practice, where a smaller 95% LoA range would suggest better repeatability from visit to visit. The difference between the upper and lower bounds of the 95% LoA is smallest for the average NIK-BUT and largest for the FBUT. However, the FBUT large 95% LoA range could be due to the presence of zero values for FBUT values, which are not present in the NIK-BUT values. Following the statistical methods outline above zero values can cause outliers; therefore, the 95% LoA should be interpreted with caution. The ICC values may be more representative of the repeatability for these values. The ICC values and 95% CI also suggest that all three methods exhibit similar between-visit levels of agreement. At best, based on the 95% LoA and ICC values, it should be considered that these methods exhibit modest between-visit agreement.
These values can be interpreted clinically by back transforming the data. Table 2 shows the interpretation of the 95% LoA for the first NIK-BUT, average NIK-BUT, and FBUT. The measures listed under “Measure at Visit 1” gives selected values that could be gained at a patient's initial appointment. For each of these selected values a corresponding column labelled “Possible Range of Values at Visit 2” provides a high value and a low value. For example, a first NIK-BUT value of five seconds found at visit one could produce a first NIK-BUT at visit two of 1.06 to 22.44 seconds. An average NIK-BUT of five seconds at visit one could range from 1.65 to 13.75 seconds at visit two, and a FBUT of five seconds at visit one could produce a range of 0.39 to 68.79 seconds at visit two. These values represent a range determined using the 95% LoA which indicates the extent of variation that could occur around the corresponding “Measure at Visit 1” value due to environmental factors, examiner variability, instrument precision, random noise, or non-biased variability in the tear film, as discussed in the following paragraph. As the table demonstrates the range of possible values is most narrow for the average NIK-BUT.
Table 2.
Range of first NIK-BUT, average NIK-BUT, and FBUT values to expect at a second visit given a range of values attained at visit 1.
| First NIK-BUT | Average NIK-BUT | FBUT | ||||||
| Measure at Visit 1 | Possible Range of Values at Visit 2 | Measure at Visit 1 | Possible Range of Values at Visit 2 | Measure at Visit 1 | Possible Range of Values at Visit 2 | |||
| 1 | 0.21 | 4.52 | 1 | 0.32 | 2.76 | 1 | 0.07 | 13.86 |
| 3 First NIK-BUT | 0.63 | 13.48 | 3 | 0.99 | 8.26 | 3 | 0.23 | 41.32 |
| 5 | 1.06 | 22.44 | 5 | 1.65 | 13.75 | 5 | 0.39 | 68.79 |
| 7 | 1.48 | 31.41 | 7 | 2.31 | 19.25 | 7 | 0.55 | 96.25 |
| 10 | 2.12 | 44.85 | 10 | 3.30 | 27.49 | 10 | 0.79 | 137.45 |
| 13 | 2.76 | 58.30 | 13 | 4.30 | 35.73 | 13 | 1.03 | 178.64 |
| 15 | 3.18 | 67.26 | 15 | 4.96 | 41.22 | 15 | 1.19 | 206.10 |
| 17 | 3.61 | 76.23 | 17 | 5.62 | 46.72 | 17 | 1.35 | 233.57 |
| 20 | 4.25 | 89.67 | 20 | 6.62 | 54.96 | 20 | 1.59 | 274.76 |
Given that no treatment was given during the study, one can conclude that the between-visit variation in NIK-BUT and FBUT was due to environmental factors, examiner variability, instrument precision, random noise, or non-biased variability in the tear film. Because the measures were taken in the same building approximately seven days apart, it would be difficult to contribute the variations to environmental factors. A strict protocol was followed by both examiners as outlined in the methods section, and the same examiner was used at both visits for each subject. Therefore, it is unlikely that variations were due to variations in procedure used by the examiners. It is also possible that the lack of agreement for the NIK-BUT values could be due to the lack of precision of the Keratograph (i.e., ability to provide a consistent value over several measures). It is possible that the human tear film could produce this much variability as it is a flowing thin film that has tangential flow, evaporative factors, and even gravity that may influence its structure.
Previous studies have analyzed the repeatability of tear break up time measures. First, consider the literature related to the repeatability of the NIK-BUT measures. One study by Best, et al. analyzed the repeatability of the NIK-BUT and found that a second NIK-BUT was significantly less than the first, which was not found in this study.17 This disparity could be due to the fact that two measures were taken within five minutes of each other. This short time frame may not have been sufficient time for the tear film to re-stabilize. A study by Hong, et al. analyzed the repeatability of the NIK-BUT when the measures were separated by two days. They reported a much higher ICC value than that found here.19 The reason for this difference could be that the Hong, et al. study only used 20 normal subjects with an average NIK-BUT of 4.3 ± 0.3 seconds and FBUT of 7.2 ± 0.6 seconds. Compared to the Hong, et al. study, the standard deviations reported in this study were much larger, which indicates that the Hong, et al. study obtained more values at lower measures. The heteroscedasticity reported previously indicates better repeatability at lower values compared to higher values, and the differences in the distribution of measures collected contribute to the differences between the ICCs reported.
Previous literature has also reported the repeatability of the FBUT. One study measured FBUT eight times over the course of two months and found no significant differences between values.7 However, this study used a repeated measures analysis of variance in their statistical analysis as opposed to the measures used in this study. A second study used a paired t-test to show that FBUT measures taken at two separate visits were not statistically different.20 Another study performed a statistical analysis similar to the one performed here. This study found that the FBUT at two visits separated by seven to twenty-one days, the ICC reported was similar to that found in this study.8
Within-Visit Agreement
When considering within visit agreement, it is important to note that the mean differences are closer to zero for the agreement between the first NIK-BUT and FBUT when compared with the average NIK-BUT and FBUT (although both statistically differ from zero, indicating a bias). However, the 95% LoA show an approximately equal range of within-visit agreement when comparing the first and average NIK-BUT with FBUT. The zero values associated with the FBUT affect both agreement comparisons; therefore, the caution emphasized for between-visit comparison of the 95% LoA is not necessary here. Table 3 shows the interpretation of the 95% LoA for the within-visit data. The measures listed under “TBUT value” gives selected values that could be gained from a FBUT for a patient. For each of these selected values a “Range of First NIK-BUT values” and a “Range of Average NIK-BUT values” are given based on their respective 95% LoA. This range suggests, for example, that a FBUT measure of five seconds could provide a First NIK-BUT of 0.720 seconds to 74.990 seconds and an average NIK-BUT of 1.299 seconds to 137.85 seconds. The ICC values and 95% confidence intervals are similar and suggest similar agreements.
Table 3.
The first and average NIK-BUT values to expect given a range of FBUT values.
| FBUT value | Range of First NIK-BUT values | Range of Average NIK-BUT values | ||
| 1 | 0.14 | 15.11 | 0.25 | 27.78 |
| 3 | 0.43 | 45.05 | 0.78 | 82.81 |
| 5 | 0.72 | 74.99 | 1.30 | 137.85 |
| 7 | 1.01 | 104.93 | 1.82 | 192.88 |
| 10 | 1.45 | 149.84 | 2.61 | 275.43 |
| 13 | 1.89 | 194.75 | 3.39 | 357.98 |
| 15 | 2.18 | 224.69 | 3.91 | 413.01 |
| 17 | 2.47 | 254.63 | 4.43 | 468.04 |
| 20 | 2.91 | 299.54 | 5.22 | 550.59 |
The first NIK-BUT and average NIK-BUT show a positive bias from the mean FBUT, which are both statistically significant, and heteroscadescity. This bias indicates that the non-invasive tear break up time measures are higher on average compared to FBUT measures. This positive bias with non-invasive break up time measures has been reported previously.15, 16, 18, 21 One recent study used a Bland-Altman plot to compare first NIK-BUT and FBUT to show that the magnitude of the positive bias increases as the average of the first NIK-BUT and FBUT increases.18 Although a negative bias was found in the Hong, et al study19 , the differences in characteristics of the sample outlined previously could account for this apparent inconsistency.
It is important to note that all three methods show poor between-visit agreement; therefore, several dry eye measures, including symptoms, may be best when assessing for changes with treatment and/or progression of dry eye disease. Within-visit agreement is also equal between all the methods, which suggests that the Keratograph 4's NIK-BUT can be substituted for the numerical FBUT value obtained in clinical practice. However, it must be noted that certain observational characteristics, such as the presence of debris in the tear film, notation of reflex tearing, and the tear break-up as streaks versus spots, are not noted by the Keratograph 4.
Table 1.
Intraclass correlation coefficients.
| Comparison | ICC | 95% confidence interval |
|---|---|---|
| Between Visit First NIK-BUT | 0.53 | 0.32 - 0.69 |
| Between Visit Average NIK-BUT | 0.59 | 0.40 – 0.73 |
| Between Visit FBUT | 0.66 | 0.49 – 0.78 |
| Within Visit First NIK-BUT vs FBUT | 0.44 | 0.21 – 0.62 |
| Within Visit Average NIK-BUT vs FBUT | 0.41 | 0.18 – 0.60 |
Acknowledgments
The authors would like to thank the NIH funding that contributed to this project (R01EY015519, T35EY007088, and P30EY007551). We would also like to acknowledge the data collection efforts of Abigail Gillogly and Catherine Voung.
References
- 1.Begley CG, Chalmers RL, Abetz L, Venkataraman K, Mertzanis P, Caffery BA, Snyder C, Edrington T, Nelson D, Simpson T. The relationship between habitual patient-reported symptoms and clinical signs among patients with dry eye of varying severity. Invest Ophthalmol Vis Sci. 2003;44:4753–61. doi: 10.1167/iovs.03-0270. [DOI] [PubMed] [Google Scholar]
- 2.Kallarackal GU, Ansari EA, Amos N, Martin JC, Lane C, Camilleri JP. A comparative study to assess the clinical use of Fluorescein Meniscus Time (FMT) with Tear Break up Time (TBUT) and Schirmer's tests (ST) in the diagnosis of dry eyes. Eye. 2002;16:594–600. doi: 10.1038/sj.eye.6700177. [DOI] [PubMed] [Google Scholar]
- 3.Begley CG, Himebaugh N, Renner D, Liu H, Chalmers R, Simpson T, Varikooty J. Tear breakup dynamics: a technique for quantifying tear film instability. Optom Vis Sci. 2006;83:15–21. doi: 10.1097/01.opx.0000195569.36185.fd. [DOI] [PubMed] [Google Scholar]
- 4.Korb DR. Survey of preferred tests for diagnosis of the tear film and dry eye. Cornea. 2000;19:483–6. doi: 10.1097/00003226-200007000-00016. [DOI] [PubMed] [Google Scholar]
- 5.Nichols KK, Nichols JJ, Zadnik K. Frequency of dry eye diagnostic test procedures used in various modes of ophthalmic practice. Cornea. 2000;19:477–82. doi: 10.1097/00003226-200007000-00015. [DOI] [PubMed] [Google Scholar]
- 6.Smith J, Nichols KK, Baldwin EK. Current patterns in the use of diagnostic tests in dry eye evaluation. Cornea. 2008;27:656–62. doi: 10.1097/QAI.0b013e3181605b95. [DOI] [PubMed] [Google Scholar]
- 7.Cho P, Brown B, Chan I, Conway R, Yap M. Reliability of the tear break-up time technique of assessing tear stability and the locations of the tear break-up in Hong Kong Chinese. Optom Vis Sci. 1992;69:879–85. doi: 10.1097/00006324-199211000-00007. [DOI] [PubMed] [Google Scholar]
- 8.Nichols KK, Mitchell GL, Zadnik K. The repeatability of clinical measurements of dry eye. Cornea. 2004;23:272–85. doi: 10.1097/00003226-200404000-00010. [DOI] [PubMed] [Google Scholar]
- 9.Korb DR, Greiner JV, Herman J. Comparison of fluorescein break-up time measurement reproducibility using standard fluorescein strips versus the Dry Eye Test (DET) method. Cornea. 2001;20:811–5. doi: 10.1097/00003226-200111000-00007. [DOI] [PubMed] [Google Scholar]
- 10.Johnson ME, Murphy PJ. The Effect of instilled fluorescein solution volume on the values and repeatability of TBUT measurements. Cornea. 2005;24:811–7. doi: 10.1097/01.ico.0000154378.67495.40. [DOI] [PubMed] [Google Scholar]
- 11.Mengher LS, Bron AJ, Tonge SR, Gilbert DJ. A non-invasive instrument for clinical assessment of the pre-corneal tear film stability. Curr Eye Res. 1985;4:1–7. doi: 10.3109/02713688508999960. [DOI] [PubMed] [Google Scholar]
- 12.Bland JM, Altman DG. Measuring agreement in method comparison studies. Stat Methods Med Res. 1999;8:135–60. doi: 10.1177/096228029900800204. [DOI] [PubMed] [Google Scholar]
- 13.Osborne JW. Improving your data transformations: applying the Box-Cox transformation. Pract Assess Res Eval. 2010;15:1–9. [Google Scholar]
- 14.Atkinson G, Nevill AM. Statistical methods for assessing measurement error (reliability) in variables relevant to sports medicine. Sports Med. 1998;26:217–38. doi: 10.2165/00007256-199826040-00002. [DOI] [PubMed] [Google Scholar]
- 15.Cho P, Douthwaite W. The relation between invasive and noninvasive tear break-up time. Optom Vis Sci. 1995;72:17–22. doi: 10.1097/00006324-199501000-00004. [DOI] [PubMed] [Google Scholar]
- 16.Nichols JJ, Nichols KK, Puent B, Saracino M, Mitchell GL. Evaluation of tear film interference patterns and measures of tear break-up time. Optom Vis Sci. 2002;79:363–9. doi: 10.1097/00006324-200206000-00009. [DOI] [PubMed] [Google Scholar]
- 17.Best N, Drury L, Wolffsohn JS. Clinical evaluation of the Oculus Keratograph. Cont Lens Anterior Eye. 2012;35:171–4. doi: 10.1016/j.clae.2012.04.002. [DOI] [PubMed] [Google Scholar]
- 18.Lan W, Lin L, Yang X, Yu M. Automatic noninvasive tear breakup time (TBUT) and conventional fluorescent TBUT. Optom Vis Sci. 2014;91:1412–8. doi: 10.1097/OPX.0000000000000418. [DOI] [PubMed] [Google Scholar]
- 19.Hong J, Sun X, Wei A, Cui X, Li Y, Qian T, Wang W, Xu J. Assessment of tear film stability in dry eye with a newly developed keratograph. Cornea. 2013;32:716–21. doi: 10.1097/ICO.0b013e3182714425. [DOI] [PubMed] [Google Scholar]
- 20.Cho P, Brown B. Review of the tear break-up time and a closer look at the tear break-up time of Hong Kong Chinese. Optom Vis Sci. 1993;70:30–8. doi: 10.1097/00006324-199301000-00007. [DOI] [PubMed] [Google Scholar]
- 21.Pult H, Riede-Pult BH. A new modified fluorescein strip: its repeatability and usefulness in tear film break-up time analysis. Cont Lens Anterior Eye. 2012;35:35–8. doi: 10.1016/j.clae.2011.07.005. [DOI] [PubMed] [Google Scholar]