

Abstract
In humans, there is a repeated category-selective organization across the lateral and ventral surfaces of the occipitotemporal cortex. This apparent redundancy is often explained as a feedforward hierarchy, with processing within lateral areas preceding the processing within ventral areas. Here, we tested the alternative hypothesis that this structure better reflects distinct high-level representations of the upper (ventral surface) and lower (lateral surface) contralateral quadrants of the visual field, consistent with anatomical projections from early visual areas to these surfaces in monkey. Using complex natural scenes, we provide converging evidence from three independent functional imaging and behavioral studies. First, population receptive field mapping revealed strong biases for the contralateral upper and lower quadrant within the ventral and lateral scene-selective regions, respectively. Second, these same biases were observed in the position information available both in the magnitude and multivoxel response across these areas. Third, behavioral judgments of a scene property strongly represented within the ventral scene-selective area (open/closed), but not another equally salient property (manmade/natural), were more accurate in the upper than the lower field. Such differential representation of visual space poses a substantial challenge to the idea of a strictly hierarchical organization between lateral and ventral scene-selective regions. Moreover, such retinotopic biases seem to extend beyond these regions throughout both surfaces. Thus, the large-scale organization of high-level extrastriate cortex likely reflects the need for both specialized representations of particular categories and constraints from the structure of early vision.
SIGNIFICANCE STATEMENT One of the most striking findings in fMRI has been the presence of matched category-selective regions on the lateral and ventral surfaces of human occipitotemporal cortex. Here, we focus on scene-selective regions and provide converging evidence for a retinotopic explanation of this organization. Specifically, we demonstrate that scene-selective regions exhibit strong biases for different portions of the visual field, with the lateral region representing the contralateral lower visual field and the ventral region the contralateral upper visual field. These biases are consistent with the retinotopy found in the early visual areas that lie directly antecedent to category-selective areas on both surfaces. Furthermore, these biases extend beyond scene-selective cortex and provide a retinotopic basis for the large-scale organization of occipitotemporal cortex.
Keywords: hierarchy, retinotopy
Introduction
One of the most striking findings in human vision has been the discovery of category-selective regions (e.g., for scenes, objects, or faces) in extrastriate cortex that occur in the same relative anatomical locations across individuals (Hasson et al., 2003). At a large scale, these regions exhibit a repeated organization throughout lateral and ventral occipitotemporal cortex (OTC), reflected by equivalently selective regions on both surfaces (Hasson et al., 2003; Op de Beeck et al., 2008; Taylor and Downing, 2011). Whereas the basic selectivity has been investigated extensively, the reasons for this prototypical and apparently redundant organization are currently unclear (Taylor and Downing, 2011; Konkle and Oliva, 2012).
This duplicate organization is often interpreted within a hierarchical framework (Haxby et al., 2000) wherein lateral areas correspond to early and ventral areas to later processing stages (Grill-Spector et al., 1999; Kourtzi and Kanwisher, 2001; Lerner et al., 2001; Kourtzi et al., 2003; Downing and Peelen, 2011; Taylor and Downing, 2011). Although intuitive, this account offers no explanation for the spatial segregation of matched category-selective regions throughout lateral and ventral OTC. Indeed, a strictly hierarchical structure would predict close proximity between matched regions, thus minimizing biologically expensive long-range connections (Chklovskii and Koulakov, 2004; Kravitz et al., 2013). Furthermore, clear functional differences between paired areas are seldom reported, and in the case of object selectivity, lateral and ventral areas are often combined and treated unitarily (Malach et al., 1995). Finally, in both human and monkey, the limited impact of posterior lesions on anterior function (Merigan and Saunders, 2004; Ungerleider et al., 2008) argues against a rigid hierarchy. For example, patient P.S. exhibits face selectivity on the ventral surface despite a posterior legion encompassing the lateral surface (Sorger et al., 2007). Alternative accounts have proposed that these regions evolved haphazardly, leading to a stereotypical but unpredictable structure (de Haan and Cowey, 2011). However, it is unclear why a random evolutionary process would lead to a consistent repeated organization across categories.
Here, we focus on complex natural scenes and test an alternative account that the repeated organization reflects representations of different portions of the visual field, with the ventral and lateral surfaces representing predominantly the contralateral upper and lower visual fields, respectively. Retinotopic structure is prevalent throughout much of visual cortex (Kravitz et al., 2013) and extends into OTC (Hasson et al., 2003). Indeed, anatomical projections in macaque highlight that lateral and ventral TEO (Kravitz et al., 2013) primarily receive inputs from early visual areas V4d (lower field) and V4v (upper field), respectively. In human, representations of the lower and upper fields are similarly segregated in early visual areas (Sereno et al., 1995; DeYoe et al., 1996; Engel et al., 1997), which lie directly antecedent to category-selective regions on both surfaces. Thus, the neuroanatomy predicts contralateral lower and upper field biases within lateral and ventral areas, respectively (Kravitz et al., 2013). Although there is some evidence for these biases in lateral and ventral object-selective cortex (Kravitz et al., 2010), the situation is much less clear for other category-selective regions (Schwarzlose et al., 2008).
We used three independent approaches to investigate retinotopic biases in scene-selective transverse occipital sulcus (TOS; or occipital place area; Dilks et al., 2013) on the lateral surface and in parahippocampal place area (PPA; Epstein and Kanwisher, 1998) on the ventral surface. Population receptive field (pRF) mapping and condition-rich, event-related imaging both revealed a contralateral lower visual field bias within TOS and a contralateral upper visual field bias within PPA. Follow-up behavioral testing revealed an upper field bias for scene judgments previously shown to be associated with representations in PPA (Kravitz et al., 2011). This differential representation of the visual field is hard to reconcile within the framework of a strictly hierarchical organization between TOS and PPA (MacEvoy and Epstein, 2007; Dilks et al., 2011). More generally, underlying retinotopic biases for the contralateral upper and lower fields may help explain the large-scale organization of matched category selectivity observed throughout OTC.
Materials and Methods
Participants and testing
Fourteen participants in total (six male; mean age, 28 years) participated in the fMRI experiments [checkerboard pRF mapping, n = 7; scene pRF mapping, n = 14 (including the seven who participated in the checkerboard pRF mapping); event-related scene quadrant presentation, n = 10 (all participants completed either one (n = 6) or both (n = 4) pRF mapping sessions)]. Sixteen participants completed the behavioral test (eight male; mean age, 27 years). All participants had normal or corrected-to-normal vision and gave written informed consent. The National Institutes of Health Institutional Review Board approved the consent and protocol.
fMRI scanning parameters
Participants were scanned on either a research-dedicated GE 3 tesla Sigma scanner or a research-dedicated Siemens 7 tesla Magnetom scanner in the Clinical Research Center on the National Institutes of Health campus (Bethesda, MD).
In all scans and across scanners, oblique slices were oriented approximately parallel to the base of the temporal lobe and extended posteriorly through all of the visual cortex. Three different fMRI experiments were conducted in separate scanning sessions (checkerboard pRF mapping, scene pRF mapping, and event-related quadrant presentation). In each session, additional category-selective functional localizer runs were also acquired.
3T scanning parameters
Partial volumes of the occipital and temporal cortices were acquired using an eight-channel head coil (21 slices; 2 × 2 × 2 mm; 10% interslice gap; TR, 2 s; TE, 30 ms; matrix size, 96 × 96; FOV, 192 mm).
7T scanning parameters
Partial volumes of the occipital and temporal cortices were acquired using a 32-channel head coil (42 slices; 1.2 × 1.2 × 1.2 mm; 10% interslice gap; TR, 2 s; TE, 27 ms; matrix size, 170 × 170; FOV, 192 mm).
Visual stimuli and tasks
Checkerboard pRF mapping.
A 100% contrast flickering circular checkerboard was presented through a bar aperture that gradually traversed the visual field (Fig. 1A). During each 36 s sweep, the aperture took 18 evenly spaced steps every 2 s (1TR) to traverse the entire screen (Dumoulin and Wandell, 2008). A total of eight sweeps were performed in each run (four orientations, two directions). Specifically, the bar stimuli progressed in the following order: L-R, BR-TL, T-B, BL-TR, R-L, TL-BR, B-T, and TR-BL. The bar stimuli covered a circular aperture (21° diameter 7T; 15° diameter 3T). During runs, participants performed a color-detection task at fixation, indicating via button press when the white fixation dot changed to red. Color fixation changes occurred semirandomly, with ∼2 color changes per sweep.
Figure 1.

Checkerboard and scene pRF mapping stimuli and task schematics. A, Example frames during checkerboard pRF mapping runs. A 100% contrast flickering (6 Hz) circular (21° diameter 7T; 10.5° diameter 3T) checkerboard stimulus was presented through a bar aperture that moved gradually through the visual field. A single sweep across the visual field took 36 s and consisted of 18 equal time (2 s) and width instances of the aperture. In each run, the aperture completed eight sweeps (2 orientations, 4 directions). Participants were required to maintain fixation and indicate the detection of a color change at fixation, via a button press. B, Example frames from scene pRF mapping sessions. The aperture, its progression across the visual field, and the detection task were identical to that used during checkerboard pRF runs. Scene images of identical dimensions replaced the checkerboard stimulus with images changing every 400 ms (5 per aperture position). Over an entire sweep, 90 scene images (5 × 18 aperture positions) were presented at random without replacement, guaranteeing that no scene was presented twice within a sweep.
Scene pRF mapping.
During scene pRF mapping, the spatial dimensions and progression order of the bar apertures were identical to those used during checkerboard mapping sessions. However, during scene pRF runs, the aperture revealed fragments of scenes (Fig. 1B). During each bar position (1TR), five scene fragments were displayed in rapid succession (400 ms per image). Across the 18 aperture positions, all 90 possible scene images were displayed once. Thus, in any single sweep, each scene occurred only once, reducing the likelihood that participants mentally “fill in” the underlying image, a problem that can arise if a single background image is revealed gradually. During runs, participants performed the same color-detection task as used during checkerboard mapping. Checkerboard and scene pRF runs comprised 144 TRs. Of note, other groups have previously used adaptations of the conventional checkerboard (Sereno and Huang, 2006), with a rotating wedge revealing clips from a single video. Here, we used random presentation of image fragments to minimize the potential for participants filling in the overall image.
Event-related scene quadrant presentation.
Event-related scanning sessions were conducted on both 3T (six participants) and 7T (four participants) scanners. Participants performed an attention-demanding task at fixation while whole-scene images were presented randomly in one of the four quadrants of the visual field (top left, top right, bottom left, bottom right). Stimuli subtended ∼6.5 × 6.5° and were centered 6.5° from the central fixation cross into one of the quadrants of the visual field. Participants maintained fixation throughout. Scene stimuli were scaled to subtend the same visual angle of the screen during both 3T and 7T scans. As a scene was presented, one arm of the fixation cross (either the horizontal or the vertical) increased in length. Participants were required to identify, via button response, the longer fixation arm. Stimulus presentation and fixation cross changes occurred simultaneously. Within each run, each scene (n = 24) appeared at each location (n = 4) for 400 ms, with a jittered (4–12 s) interstimulus fixation period; thus, each run contained 96 trials. The order of presentations and fixation arm extensions was randomized within each run. Participants completed six runs of the event-related experiment. Each of the six runs comprised 263 TRs.
Category-selective functional localizers.
Within each of the three fMRI experiments (checkerboard, scene pRF, and event-related quadrant presentation), two independent localizer scans were also collected in each participant to localize scene-, face-, and object-selective regions of OTC. Both localizers used an on/off design (scenes/faces or objects/scrambled) with alternating blocks of stimuli (5 × 5°) presented (16 s) while participants performed a one-back task. Localizer scans comprised 144 TRs.
Behavioral paradigm.
During behavioral testing, participants fixated a centrally presented cross while images of whole scenes were presented randomly into in one of the four quadrants of the visual field. Stimuli were presented briefly (150 ms), to reduce the likelihood of saccades to the target, followed by a trial unique mask (350 ms). Unique masks were created by cutting each stimulus into 64 squares and shuffling these squares between stimuli (768 unique masks in total), a procedure implemented previously (Kravitz et al., 2010). There were eight blocks of trials in total. Within a block, each of the 96 scenes occurred once. During alternating blocks, participants were required to indicate, via keyboard response, whether stimuli were manmade or natural (four blocks) or open or closed (four blocks). Block orders were counterbalanced across participants. Across the four blocks, in each task, each scene appeared once in each of four visual field locations. Participants viewed stimuli from a fixed distance of 57 cm via use of a chin-rest. Stimuli subtended 5 × 5°. Images were centered 5° into each of the four quadrants of the visual field. Accuracy and reaction time data were recorded with each trial.
fMRI data preprocessing.
All data were analyzed using the Analysis of Functional NeuroImages (AFNI) software package (http://afni.nimh.nih.gov/afni). All functions and programs are readily available in the current version: AFNI binary version March 4, 2015. Before statistical and pRF analyses, all images for each participant were motion corrected to the first image of the first run, after removal of the appropriate “dummy” volumes (eight) to allow stabilization of the magnetic field. Postmotion-correction data were smoothed with a 2 mm full-width at half-maximum Gaussian kernel for both 3T and 7T localizer runs.
Localizer analysis.
To identify scene- and face-selective regions of interest (ROI), significance maps of the brain were computed in each participant by performing a correlation analysis between the assumed hemodynamic response function and the activation time courses thresholded at p < 0.0001 (uncorrected). Only contiguous clusters of voxels (>25) exceeding this threshold were defined as scene or face selective. The anatomical locations of these clusters were then inspected to define ROIs consistently with previously published work (Sayres and Grill-Spector, 2008; Schwarzlose et al., 2008). To subdivide each participant's PPA into posterior and anterior portions, we took the median split in the y-dimension (posterior-anterior axis).
Event-related analysis.
The six runs were split into two halves (10 times, maximum splits). Each half was then deconvolved independently and correlated. For event-related runs, performing t tests between each condition (top left, bottom left, top right, and bottom right) and baseline generated significance maps. The t values for each condition were extracted from voxels within each ROI and correlations computed between each condition (Kravitz et al., 2010). In our paradigm, 24 scene images were presented in four visual field locations; thus, the correlation matrix for a given ROI represents 96 × 96 correlations. The full correlation matrices for each ROI represent the similarity in the pattern of activity elicited by stimuli in the different positions. These individual participant matrices were then averaged together for each ROI (Kravitz et al., 2010). The resulting group-level matrices represent the spatial similarity in the pattern of responses between conditions within a given ROI. To establish the significance of position effects, matrices were averaged by position by taking the mean correlation values for each of the 24 stimuli within a visual field position.
Checkerboard and scene pRF mapping analysis.
Both checkerboard and scene pRF analyses of unsmoothed data were conducted in AFNI, using a new pRF implementation for the AFNI distribution (Fig. 2) (developed by R. C. Reynolds), based broadly on previous implementations for pRF estimation (Larsson and Heeger, 2006; Dumoulin and Wandell, 2008). For every voxel in the brain, the model initially estimates the center of the pRF on an X, Y grid with 200 samples across both the height and the width of the screen. For each point in the grid, σ (pRF size) values are sampled at the same resolution, but over a default range of 0 to half the screen width sampled at 100 even intervals. These default parameters result in 4 million possible pRFs (X, Y location and σ). Given the position of the stimulus in the visual field at every TR, the estimated time series for a receptive field of a given location (X, Y) and size (σ) can be modeled. The model then makes use of a 2-D stimulus time series, which contains binary masks of the stimulus location at each TR and a convolution with a standard hemodynamic response function to produce 4 million predicted time series. The model then utilizes both Simplex and Powell optimization algorithms to find the best time series/parameter sets (X, Y, and σ) by minimizing the least-squares error of the predicted time series measured against the acquired time series in each voxel. The model outputs for each voxel the X, Y location representing the center of the receptive field; σ, which represents the diameter (size) of the receptive field; and R2, which corresponds to the explained variance of the fit and can be used to statistically threshold these data.
Figure 2.

Population receptive field modeling schematic. Schematic representation of the AFNI pRF implementation. Initially, pRF centers are estimates on an X, Y grid of 200 × 200. For every position in the grid, the model estimates 100 levels of RF size (red circles). Iterating through all possible combinations (red box indicates the final combination; X = 200, Y = 200, σ = 100) produces 4 million possible pRF combinations. Combining these location and size parameters with a stimulus time series, produces 4 million predicted time series (3 predicted time series shown in red). Two optimization algorithms are then used simultaneously to find the best fit between the acquired time series for each voxel (bottom, black line) and the predicted time series (red line on right plot). The example time series shown at the bottom is taken from a voxel within left PPA of a single participant (image in radiological convention). The model outputs, for each voxel, the X, Y, and σ (green box) values that produced the maximum R2 (red box).
Visual field coverage plots, which are built by combining the best Gaussian receptive field model for each voxel within an ROI, can be computed from these data. In our analyses, only subjects with >20 significantly modulated voxels in each ROI were included. For TOS and PPA, all 14 subjects (both hemispheres) met this criterion. The coverage plots for a given ROI are an aggregation of these Gaussians. Assuming a strong central tendency in the centers of the receptive fields, a linear aggregation (e.g., summation) will result in a coverage plot appearing as a single large Gaussian. In our analyses, a max operator is used. This creates a coverage plot that reflects, at each point, the maximum pRF value from all of the receptive field models within an ROI (Winawer et al., 2010). Thus, the coverage plot reflects the maximum envelope of all the Gaussians within an ROI. Whereas this allows for a nonsymmetric shape, the edges of that plot will often evidence a Gaussian falloff as few RFs define the edges. Importantly, all of our results hold whether the aggregation is summation or a max operator.
Reliability of our pRF model
To test the reliability of our pRF estimates, we split each of the eight scene pRF runs into odd and even runs. The pRF parameter estimates (X, Y location; σ; and R2) derived from these now independent data sets were compared on a voxel-wise basis for each ROI. Initially, we selected significantly modulated voxels using the odd runs and correlated the four pRF parameter estimates with the parameters extracted from the exact voxels in the even runs. This process was reversed, and the average correlation was derived. Despite having only half the amount of data to estimate the pRFs, we observed high correlations in all ROIs across all four parameters (0.68 < r < 0.94).
The venous eclipse artifact
We assessed the proximity of our PPA ROIs to the “venous eclipse,” an artifact caused by the dural sinus (Winawer et al., 2010). Reduced and/or distorted measurements of the lower visual field, in certain individuals, have been attributed recently to the location of the dural sinus. We investigated the impact of the dural sinus using procedures described by Winawer et al. (2010). Our data are consistent with those previously reported and highlight the location of the dural sinus on the posterior and lateral edge of OTC. Our PPA ROIs, however, occupy a more anterior and medial portion of ventral OTC. Although measurements of visual field responses could be distorted within the vicinity of the dural sinus, there is sufficient spatial separation between it and our PPA ROIs to reject it as a possible explanation for the strong upper visual field biases reported here.
3T versus 7T
All fMRI scanning sessions reported here were conducted at both 3T and 7T field strengths. We observed no differences in the pattern of results between 3T and 7T and have, therefore, collapsed across scanner in our analyses. Although, in general, an advantage of using 7T may have been expected, our choice of imaging resolution may have precluded any such advantage as the reduction in voxel size from 3T (2 mm3) to 7T (1.2 mm3) may have been greater than the increase in signal at 7T relative to 3T. Additionally, it is possible that the large-scale spatial organization being measured is much larger than the voxel size used in the 7T scans. This would make it unlikely to observe any advantage of moving to the smaller voxels.
Results
We tested the hypothesis that scene-selective TOS on the lateral surface and PPA on the ventral surface would exhibit biases for the contralateral lower and upper visual field, respectively, using three independent methods to quantify position sensitivity: pRF mapping (with both checkerboards and scene fragments); condition-rich, event-related fMRI (with whole scenes); and behavioral measurements.
pRF mapping
Initially, we conducted pRF mapping using standard checkerboard stimuli (n = 7). To visualize the representations of the visual field within TOS and PPA, schematic 2-D reconstructions were computed. These reconstructions model the spatial extent of the pRFs of a given brain region expressed as a function of the maximum pRF value at each point in the visual field (Winawer et al., 2010). These reconstructions, shown for left PPA and TOS of a sample participant in Figure 3A (top row), revealed two important results. First, both PPA and TOS exhibited a striking bias for the contralateral visual field. Indeed, both areas show a vanishingly weak representation of the ipsilateral visual field. Second, a clear bias for the contralateral upper visual field was evident in PPA, whereas TOS exhibited a bias for the contralateral lower visual field. These results were present at the group level, and although consistent with our hypotheses, the checkerboard stimuli did not drive responses strongly within the scene-selective regions with <20% of the voxels in PPA evidencing a significant proportion of variance explained (Fig. 3B,C).
Figure 3.

Comparison of checkerboard and scene pRF mapping. A, Example checkerboard and scene pRF data in a single participant. The top row shows the ventral (top left) and lateral (top right) surface reconstructions of the left hemisphere of a single participant overlaid with the group-averaged contrast of scenes minus faces (p < 0.0001, uncorrected). The group PPA (ventral) and TOS (lateral) are labeled. The middle row shows visual field coverage plots given in pRF value elicited by checkerboards for the left PPA (left) and left TOS (right) of a single participant. A bias for the contralateral upper visual field is evident within PPA, and a bias for the contralateral lower visual field is present within TOS. The bottom row shows visual field coverage plots, elicited by our scenes in the same participant. The biases are consistent with those elicited by checkerboards; however, there is a far higher pRF value across the visual field, particularly within left PPA. B, Percentage of voxels within each ROI, collapsed across hemispheres, modulated significantly (p < 0.001, uncorrected) by both mapping stimuli in the seven participants who completed both sessions. Scene pRF mapping led to a substantial increase in the proportion of significant voxels relative to checkerboards in both ROIs; (*p < 0.05). C, Mean explained variance in both ROIs elicited by both mapping stimuli. In both ROIs, scene pRF mapping captures significantly more variance than its checkerboard mapping counterpart (*p < 0.05). Error bars in this and all plots represent the between-subjects SEM.
To engage the scene-selective regions more strongly, we replaced the checkerboards in the stimuli with scene fragments and reran the same group of participants. As shown for the sample participant in Figure 3A (bottom row), visual field coverage plots showed a very similar pattern to the checkerboards, but there was a sharp increase in the variance explained. This increase in explained variance was consistent at the group level, and the proportion of significant voxels nearly doubled in PPA (Fig. 3B,C). Two analyses were performed to quantify the differences between our pRF mapping stimuli. First, in each participant we calculated the proportion of voxels within each ROI that was modulated significantly (p < 0.001, uncorrected) by our mapping stimuli. A two-way ANOVA with Stimulus (checkerboard, scene) and ROI (PPA, TOS) as factors revealed a significant main effect of Stimulus (F(1,6) = 6.45, p < 0.05), reflecting greater modulation with scenes than checkerboards. The main effect of ROI (F(1,6) = 5.77, p > 0.05) approached significance. There was no significant interaction between Stimulus and ROI (F(1,6) = 0.71, p > 0.43).
Second, we calculated the average explained variance within PPA and TOS bilaterally. A two-way repeated-measures ANOVA (same factors as above) revealed significant main effects of Stimulus (F(1,6) = 35.50, p < 0.001), reflecting greater explained variance with scenes than checkerboards, and ROI (F(1,6) = 13.74, p < 0.01), reflecting greater variance explained in TOS than PPA. The interaction between Stimulus and ROI (F(1,6) = 1.33, p = 0.29), however, was not significant.
Thus, the scene stimuli engaged TOS and PPA to a greater extent than the checkerboards. There was also a tendency to engage and explain more variance in TOS than PPA. Given the clear advantage of the scenes compared with checkerboards, an additional seven participants underwent scene pRF mapping. Across all 14 participants, the average visual field coverage plots for each hemisphere (Fig. 4A) show (1) an overwhelming contralateral bias in both PPA and TOS and (2) a disproportionately strong representation of the upper visual field in PPA and the lower visual field in TOS.
Figure 4.

Group-averaged scene pRF visual field coverage. A, Group-averaged visual field coverage plots are shown for left PPA (top row, left column) and right PPA (bottom row, left column). Both ROIs exhibit the predicted biases for the contralateral upper visual field. A similar bias for the contralateral lower visual field is evident in left and right TOS (right column). The percentage of pRF centers within each quadrant of the visual field is given for each ROI. B, Bars depict the pRF value in the right minus left visual fields. Note the contralateral bias present within both left and right PPA (left) and TOS (right). Biases were significant (relative to zero) in both ROIs (***p < 0.0001). C, Bars depict the differential pRF value in the contralateral upper minus lower visual fields for both PPA and TOS in the left (top) and right (bottom) hemisphere. In both hemispheres, PPA exhibits an upper field bias and TOS a lower field bias. Elevation biases were significantly different from zero in all ROIs (*p < 0.05; **p < 0.01).
Contralateral upper bias in PPA and contralateral lower bias in TOS
To quantify these visual field biases, we calculated the average pRF value as a function of visual field quadrant for each participant and ROI. A four-way repeated-measures ANOVA with Hemisphere (left, right), ROI (TOS, PPA), Visual Field (left, right), and Elevation (upper, lower) as within-subject factors revealed significant main effects of Hemisphere (F(1,13) = 7.78, p < 0.05), reflecting greater variance explained for the right than left hemisphere, and ROI (F(1,13) = 14.51, p < 0.01), reflecting greater variance explained for TOS than PPA. Neither the main effects of Visual Field (F(1,13) = 2.20, p > 0.16) nor Elevation (F(1,13) = 0.05, p > 0.83) were significant. There was a significant interaction between Hemisphere and Visual Field (F(1,13) = 131.24, p < 0.001), reflecting the large contralateral bias within each hemisphere. Critically and consistent with our hypothesis, there was a significant two-way interaction between ROI and Elevation (F(1,13) = 23.83, p < 0.01), reflecting greater variance explained in TOS for the lower than upper visual field, with the opposite pattern in PPA. No other two-way interactions were significant (p > 0.05 in all cases).
Additionally, we observed a significant four-way interaction between Hemisphere, ROI, Visual Field, and Elevation (F(1,13) = 27.10, p < 0.001), owing to the Elevation biases being present only in the contralateral visual field. To confirm this interpretation, we conducted two-way ANOVAs (ROI and Elevation) for the ipsilateral and contralateral fields separately. For the contralateral field, we observed a significant main effect of ROI (F(3,39) = 7.11, p < 0.001), reflecting the already noted greater variance explained in TOS than PPA. There was no main effect of Elevation (F(1,13) = 0.01, p > 0.95), but, crucially, there was a significant interaction between ROI and Elevation (F(3,39) = 9.55, p < 0.001), reflecting the different elevation biases in the two ROIs. For the ipsilateral visual field, there was the main effect of ROI (F(3,39) = 5.95, p < 0.05) but no main effect of Elevation (F(1,13) = 0.17, p = 0.68). The interaction between ROI and Elevation was also significant (F(3,39) = 4.41, p < 0.05) but was markedly weaker than within the contralateral field. In summary, these results confirm biases for the contralateral upper visual field within PPA and for the contralateral lower visual field within TOS. To demonstrate the reliability of these biases, we calculated the frequency of participants in whom we observed (1) a contralateral bias in PPA (left, 14 of 14; right, 14 of 14) and TOS (left, 14 of 14; right, 14 of 14) and (2) a contralateral upper field bias in PPA (left, 12 of 14; right, 11 of 14) and a contralateral lower field bias in TOS (left, 11 of 14; right, 12 of 14). The observed visual field biases were highly consistent across participants. These individual participant visual field biases are displayed for all ROIs (PPA and TOS, left and right) and for both measurements (contralateral bias and elevation bias) in Figure 5.
Figure 5.

Individual participant visual field biases. A, Bars depict the contralateral bias [Contra minus Ipsi (pRF value)] for each participant and ROI. Across ROIs, every participant exhibited the predicted bias for the contralateral visual field. B, Bars depict the elevation bias [Contra upper minus Contra lower (pRF value)] for each participant and ROI. A contralateral UVF bias (positive value) was present in 12 of 14 and 11 of 14 participants for the left and right PPA, respectively. In contrast, a contralateral LVF bias (negative value) was present in 11 of 14 and 12 of 14 participants for the left and right TOS, respectively. Bold numbers in A and B highlight the 7T participants. Participant numbers correspond to the order in which participants were scanned.
No difference in pRF size in PPA and TOS
Two additional analyses were conducted to compare the pRF characteristics of our ROIs. First, we calculated the average pRF size (diameter of Gaussian) for each ROI [mean (SE): TOS, 6.05° (0.56°); PPA, 8.08° (0.44°)], collapsed across hemispheres. A two-way repeated-measures ANOVA with Hemisphere (left, right) and ROI (TOS, PPA) as within-subject factors was conducted. Neither the main effect of Hemisphere (F(1,13) = 1.74, p > 0.21) nor ROI (F(1,13) = 3.37, p > 0.09), nor their interaction (F(1,13) = 0.81, p > 0.39), were significant. Additionally, we calculated group-averaged pRF size distributions for PPA and TOS, broken down by hemisphere (Fig. 6A,B). In each participant, in each ROI we calculated the proportion of voxels with pRF sizes that fell within 20 linearly spaced bins (0.5° spacing). These distributions were then averaged across participants to create group-level distributions. These distributions were tested for statistical differences using two-sample Kolmogorov–Smirnov tests. No pairwise comparisons were significant (p > 0.05 in all cases).
Figure 6.
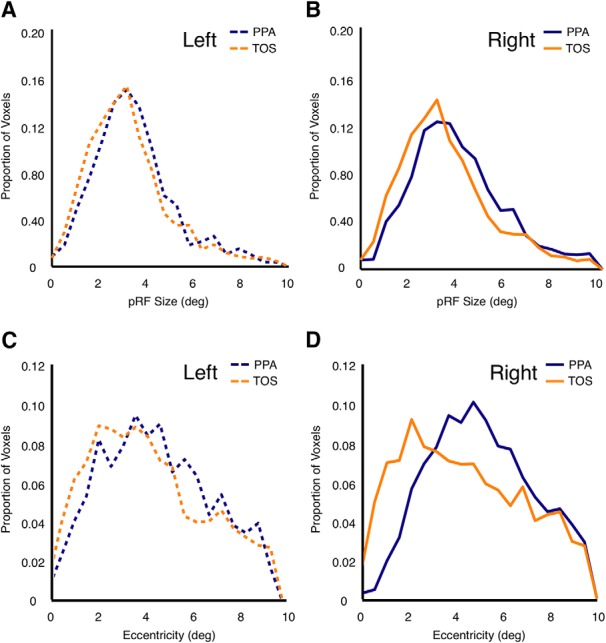
Average pRF size and eccentricity distributions for TOS and PPA. A, B, Group-level pRF size distributions are shown for left PPA and TOS (A) and right PPA and TOS (B). Size distributions were calculated in each subject by taking the proportion of voxels with pRF sizes in 20 evenly spaced bins. These distributions were then averaged across subjects. Distributions were not significantly different across ROIs (Kolmogorov–Smirnov tests, p > 0.05 in all cases). C, D, Group-level eccentricity distributions are shown for left PPA and TOS (C) and right PPA and TOS (D). Eccentricity distributions were calculated in an identical procedure. Distributions were not significantly different across ROIs (Kolmogorov–Smirnov tests, p > 0.05 in all cases).
Second, we calculated the average estimate of eccentricity for both areas. We observed slightly more eccentric receptive fields within PPA than TOS [TOS, 4.63° (0.31°); PPA, 5.22° (0.22°)]. However, a two-way repeated-measures ANOVA (same factors as above) revealed no significant main effects or interactions (p > 0.08 in all cases). Group-averaged eccentricity distributions were also calculated using the same procedure described above (Fig. 6C,D). Kolmogorov–Smirnov tests indicated no significant differences between these distributions (p > 0.49 in all cases).
Condition-rich, event-related experiment
To confirm the implications of the pRF findings during whole-scene viewing, we conducted an event-related experiment in which participants viewed 24 scene images in each of the four quadrants of the visual field, while performing an orthogonal task at fixation (Fig. 7A). We analyzed these data both with standard univariate methods and with multivoxel pattern analysis (MVPA).
Figure 7.
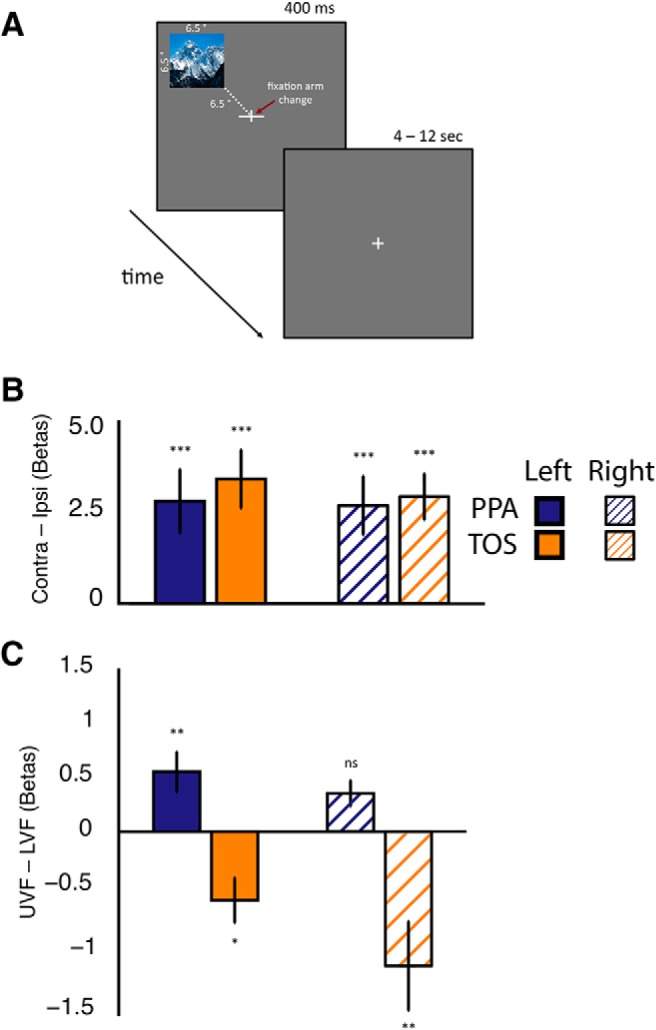
Event-related design and magnitude analyses. A, Participants fixated a centrally presented cross, while images of whole scenes were presented in one of the four quadrants of the visual field for 400 ms (example trial for the upper left quadrant). Participants performed an orthogonal attention-demanding task at fixation requiring the identification of the longer arm of the fixation cross (either horizontal or vertical). Fixation cross changes occurred simultaneously with stimulus presentation. B, Contralateral bias measurements (contralateral minus ipsilateral magnitude) were calculated in each ROI. All ROIs exhibit a robust and reliable bias for stimuli presented in the contralateral visual field. These biases were significantly different from zero in all ROIs (***p < 0.001). C, Elevation bias measurements (upper minus lower magnitude) were calculated for all ROIs. Consistent with pRF mapping data, an upper bias was present within PPA, with a lower bias present within left and right TOS. These biases were significantly different from zero in all ROIs except right PPA (**p < 0.01; *p < 0.05).
Magnitude: contralateral upper bias in PPA and contralateral lower bias in TOS
In agreement with our pRF mapping, univariate analyses (Fig. 7B) showed that both TOS and PPA exhibited stronger responses in the contralateral than ipsilateral visual field. In addition, consistent with our hypothesis and the pRF data, TOS showed stronger responses to scenes in the lower compared with upper visual field, and the opposite pattern was found in PPA (Fig. 7C).
A four-way repeated-measures ANOVA with Hemisphere (left, right), ROI (TOS, PPA), Hemifield (ipsilateral, contralateral), and Elevation (upper, lower) as within-subject factors revealed a significant main effect of Hemifield (F(1,9) = 13.03, p < 0.01), reflecting stronger responses in the contralateral than ipsilateral visual fields in all ROIs, but no other main effects (all p values >0.14). There were significant two-way interactions of Hemisphere and Hemifield (F(1,9) = 12.05, p < 0.01), reflecting a stronger contralateral bias in the left than right hemisphere, and Hemisphere and Elevation (F(1,9) = 6.98, p < 0.05), reflecting slightly stronger responses to the lower visual field within the right compared with left hemisphere. Crucially, there was a significant interaction between ROI and Elevation (F(1,9) = 12.70, p < 0.01), confirming stronger responses in the lower than upper visual field in TOS, but the opposite pattern was found in PPA. These differences in response magnitude across quadrants offer a simple, independent confirmation of the visual field biases observed during our pRF mapping.
MVPA: contralateral upper bias in PPA and contralateral lower bias in TOS
Next, we used MVPA to assess the similarity in the pattern of responses within each ROI for stimuli presented in each of the four quadrants of the visual field. This analysis serves as a complementary test of visual field biases. For each participant, split-half analysis was used to generate a 96 × 96 similarity matrix for each ROI, wherein each pixel represents the correlation in the pattern of responses between stimuli presented in all quadrants.
The full similarity matrices for left PPA and TOS (Fig. 8) clearly show two major effects. First, higher correlations are observed for stimuli presented in the contralateral than ipsilateral visual fields in both regions. Second, within the contralateral field, higher correlations are observed within the upper field for PPA and within the lower field for TOS. To visualize this quadrant-dependent structure within both regions more clearly, we used multidimensional scaling (Fig. 8). These visualizations reveal a striking grouping by hemifield as well as a strong grouping by elevation in the contralateral field. For both ROIs, the preferred quadrant is readily apparent as the tightest grouping of points. The intermingling of the upper and lower field conditions in the ipsilateral field speak to (1) the weaker responses here and (2) the fact those responses are likely dominated by voxels with large pRFs, which span the two ipsilateral quadrants.
Figure 8.

Similarity matrices for quadrant data. A, Top, Group-averaged raw similarity matrix for the left PPA. The matrix is 96 × 96 (24 scenes × 4 positions), with each point representing the correlation between a pair of conditions across two independent halves of the data. The correlation between a condition and itself are plotted along the main diagonal from the top left to bottom right corner. Solid lines demarcate borders between hemifields, whereas dashed lines show the borders between the upper and lower visual fields. Negative and positive correlations are well grouped by quadrant, indicating that position is a strong determinant of the pattern of responses. Bottom, Multidimensional scaling (MDS) plot of the left PPA matrix shown above. In this plot, each symbol represents a single condition, and the distances between symbols reflects the correlation between conditions. Note the strong grouping by visual hemifield and the strong grouping by elevation, particularly for the contralateral (red symbols) conditions. B, Top, Raw similarity matrix for left TOS. Bottom, MDS plot for left TOS.
To quantify these biases, we computed average matrices for all ROIs (Fig. 9A), revealing that (1) all four ROIs exhibited stronger correlations for stimuli presented in the contralateral visual field and (2) there were stronger correlations within PPA for the contralateral upper visual field and within TOS for the contralateral lower visual field, a pattern entirely consistent with our predictions and previous analyses. Average within-quadrant correlations (Fig. 9B) show that in each ROI, the preferred quadrant produced significantly higher correlations than all other quadrants (t test, p < 0.05, uncorrected), save one nonpreferred quadrant in the right PPA (p > 0.11).
Figure 9.

Multivoxel quadrant effects. A, Group-averaged matrices for all ROIs averaged by quadrant. The predicted pattern of results was evident in all ROIs. That is, higher correlations were observed for (1) stimuli presented in the contralateral versus ipsilateral visual fields and (2) higher correlations for stimuli presented in the contralateral upper versus contralateral lower visual fields in left and right PPA, with the opposite pattern evident in left and right TOS, respectively. Blue asterisks denote the quadrant showing the highest correlations for each ROI. B, Bars depict the within-quadrant average correlations in each ROI (diagonal from top left to bottom right in A). Red boxes highlight the position with the highest correlations in each ROI, which correspond to the blue asterisks in A. Paired t tests revealed significant differences between the correlation within the predicted visual field position (red box) and all other positions in all but one comparison (UL vs LL within right PPA). Asterisks highlight these significant differences (*p < 0.05). LL, Lower left; UL, upper left; LR, lower right; UR, upper right. C, Effects of changes in quadrants across all four ROIs. Each bar gives the average correlation for a particular type of position change. For example, within-quadrant refers to the average of values along the main diagonals in A. Note that in every ROI the, within-quadrant value is the greatest (as shown by asterisks), indicating strong position information. D, Correlation between quadrants in the ipsilateral and contralateral fields. Note that in every ROI, the correlation between quadrants in the contralateral field is significantly (*p < 0.05) lower than that in the ipsilateral field, indicating stronger position information contralaterally.
To test whether the preferred quadrant truly differed across ROIs, we entered the within-quadrant correlations into a four-way repeated-measures ANOVA, with the same factors as above. Consistent with previous analyses, only the main effect of Hemifield was significant (F(1,9) = 11.75, p < 0.01), reflecting the contralateral bias present within each ROI. All other main effects were not significant (all p values >0.1). There were significant interactions between ROI and Elevation (F(1,9) = 7.35, p < 0.05) and between ROI, Hemifield, and Elevation (F(1,9) = 7.57, p < 0.05), reflecting the contralateral upper visual field bias within PPA and contralateral lower visual field bias within TOS bilaterally. All other interactions were not significant (all p values >0.2).
Strong position information in the contralateral visual field in both ROIs
We also characterized the position information within these ROIs with two additional analyses. First, all four ROIs showed higher correlations within than between quadrants, indicating strong effects of position changes (Fig. 9C). A three-way ANOVA with ROI, Hemisphere, and Quadrant (within-quadrant, within-field, between-fields, and opposite) as factors revealed only a significant main effect of Quadrant (F(3,24) = 14.56, p < 0.001), reflecting the higher within-quadrant correlations in each ROI. No other main effects or interactions reached significance (all p values >0.4).
Second, we compared in each ROI how the correlation between stimuli in the upper and lower fields differed across hemifields (Fig. 9D). All ROIs exhibited stronger positive correlations across the upper and lower quadrants within the ipsilateral than contralateral field (p < 0.05 in all cases), suggesting less position sensitivity within the ipsilateral field. Thus, responses in PPA and TOS are not only stronger but also more sensitive to position in the contralateral than ipsilateral visual fields, likely reflecting the dominance of larger receptive fields in the ipsilateral response.
An upper visual field advantage for open- and closed-scene discriminations
Recent work (Kravitz et al., 2011; Park et al., 2011) reported that neural patterns within PPA encode a representation of expanse (open/closed boundaries). In particular, scenes could be characterized as either open or closed based on the neural patterns of PPA responses, with the neural grouping correlating highly with behavioral ratings of the same stimuli (Kravitz et al., 2011). Therefore, given the upper visual field biases observed within PPA across independent measurements, we hypothesized that participants would be more accurate at discriminating open or closed scenes when those scenes were presented in the upper than lower visual field (Fig. 10A). We also contrasted this against a manmade or natural scene discrimination task on the same stimuli.
Figure 10.

Behavioral experiment. A, Example trial from our behavioral paradigm. Participants fixated a centrally presented cross, while images of whole scenes were presented randomly in the four quadrants of the visual field. Stimuli were presented briefly (150 ms), followed by a trial-unique mask (350 ms). In alternating, counterbalanced blocks, participants indicated, via keyboard press, whether the scene was open or closed (4 blocks) or manmade or natural (4 blocks). B, Group-averaged performances (percent correct) for stimuli presented in the upper minus lower visual fields for both tasks plotted separately. For manmade versus natural, we observed no advantage for stimuli presented in either field. In contrast, for open versus closed, we observed a significant advantage for stimuli presented in the upper visual fields compared with zero (*p < 0.05). There was also a significant difference between the two tasks (**p < 0.01).
The accuracy (percent correct) of responses was measured for all four quadrants and both tasks, plotted as difference measurements (upper minus lower) in Figure 10B. No advantage for either elevation was observed during manmade/natural discriminations. In contrast, during open/closed discriminations, a small but significant upper visual field advantage was observed, as predicted.
Performance was analyzed using three-way repeated-measures ANOVA, with Task (manmade/natural, open/closed), Visual Field (left, right), and Elevation (upper, lower) as within-subject factors. Neither the main effects of Task (F(1,15) = 0.88, p ≥ 0.36, p > 0.36) nor Visual Field (F(1,15) = 0.23, p > 0.59) nor Elevation (F(1,15) = 0.02, p > 0.89) were significant. Importantly, however, a significant interaction between Task and Elevation was present (F(1,15) = 8.68, p < 0.01). Planned comparison t tests showed no significant difference in performance as a function of Elevation for the manmade/natural task (t(15) = 1.10, p > 0.14). In contrast, for open/closed discriminations, participants were significantly more accurate when stimuli were presented in the upper compared with lower visual field (t(15) = 2.27, p < 0.05). These performance measurements were found not to be caused by the presence of speed–accuracy trade-offs. To confirm this, a two-way repeated-measures ANOVA (same factors as above) conducted on the inverse efficiency measurements demonstrated only a significant interaction between Task and Elevation (F(1,15) = 10.22, p < 0.01). All other main effects and interactions were not significant (all p values >0.32).
Retinotopic biases in posterior and anterior PPA
Until now, we have considered PPA as a single scene-selective region on the ventral surface of OTC. Recently, however, dissociations between the posterior and anterior portions of PPA have been suggested (Baldassano et al., 2013). We therefore analyzed both our pRF and event-related quadrant data with respect to these PPA subdivisions. First, we computed group-averaged visual field coverage plots for each newly created ROI (left posterior PPA, left anterior PPA, right posterior PPA, right anterior PPA). Qualitatively, each ROI exhibited the predicted contralateral upper field bias. Bias measurements [both contralateral minus ipsilateral and contralateral upper visual field (UVF) minus contralateral lower visual field (LVF)] also followed the predicted patterns. However, there is a tendency for both the contralateral and upper visual field biases to become weaker in anterior PPA, a pattern potentially attributable to the increase in RF sizes in anterior PPA. The decrease in contralateral bias was significant between posterior and anterior PPA (t(13) = 3.01, p < 0.05, collapsed across hemispheres), but, importantly, the upper field bias did not differ significantly between posterior and anterior PPA (t(13) = 1.97, p > 0.05, collapsed across hemispheres). One caveat, however, is that explained variance is also significantly reduced in anterior PPA (t(13) = 4.22, p < 0.01), which may be attributable to either reduced retinotopy or reduced signal as we move toward the anterior temporal lobe. Second, from our event-related analyses, we calculated bias measurements (both contralateral minus ipsilateral and UVF minus LVF) in the response magnitudes for all ROIs. Both posterior and anterior PPA exhibit a significant contralateral bias (p < 0.01, collapsed across hemispheres). The predicted upper field bias was observed (numerically) in both posterior and anterior PPA but was only significant in posterior PPA (p < 0.05, collapsed across hemispheres). Similar results were observed in the analysis of the multivoxel responses.
Contralateral upper and lower biases beyond scene-selective regions
To examine the generalizability of these retinotopic biases, we performed a number of additional analyses. First, group-level surface maps of pRF centers in the vertical dimension (Fig. 11) demonstrate that lower and upper field biases extend beyond TOS and PPA throughout both surfaces. Lower field positions largely dominate the lateral surface. On the ventral surface, the majority of locations are in the upper field or close to the horizontal meridian, with lower field locations only appearing in close proximity to the occipital face area (OFA). Second, we measured retinotopic biases in face-selective regions on the lateral (OFA) and ventral [fusiform face area (FFA)] surface. Even though we presented scenes and not faces, there was some responsiveness in these regions. Because of limited engagement of the left FFA by our stimulus, we restricted this analysis to the right-hemisphere ROIs only and to those subjects with at least 20 significant voxels in the ROI (see Materials and Methods). Group-averaged visual field coverage plots for the right FFA (n = 7) and right OFA (n = 11) indicate biases for the contralateral upper and lower visual fields, respectively (Fig. 12A). Contralateral (Contra minus Ipsi) and Elevation (Contra UVF minus Contra LVF) biases were found to be significant in both ROIs (p < 0.05 in all cases) (Fig. 12B,C). Furthermore, the results in our event-related data in terms of magnitude and multivoxel response in OFA and FFA showed a similar pattern to those observed in PPA and TOS. In general, these effects were stronger in OFA than FFA.
Figure 11.

Upper and lower field biases across the ventral and lateral surfaces. Top row, Ventral (left) and lateral (right) surface reconstructions of the right hemisphere of a single participant overlaid with the group-averaged contrast of scenes minus faces (p < 0.0001, uncorrected). The group PPA and FFA (ventral) and TOS and OFA (lateral) are labeled. Bottom row, Visual field position (vertical dimension) across both surfaces is overlaid with ROIs outlined in white and labeled. Cold colors (dark blue through cyan) represent positions in the lower visual field from the horizontal meridian. Hot colors (red to yellow) represent positions in the upper visual field from the horizontal meridian. The ventral surface (left) predominantly represents the upper visual field (hot colors). Indeed, both PPA and FFA ROIs overlap upper visual field representations, with the uppermost visual field representations (yellow) overlapping PPA. In contrast, lower visual field representations (cold colors) dominate the lateral surface (left), with both TOS and OFA predominantly representing the lower visual field. The majority of TOS overlaps the lowermost (cyan) visual field representations on the lateral surface. Overall, there is clear divergence between the upper and lower visual fields across the ventral and lateral surfaces, evidenced by the switch from hot to cold colors as one moves from the ventral to the lateral surface.
Figure 12.

Group-averaged visual field coverage in right FFA and OFA. A, Group-averaged visual field coverage plots are shown for right FFA and right OFA. Both ROIs exhibit the predicted biases for the contralateral visual field, with a contralateral upper bias present in FFA and a contralateral lower bias evident in OFA. The percentage of pRF centers within each quadrant of the visual field is given for each ROI. B, Bars depict the pRF value in the right minus left visual fields. Biases were significant (relative to zero) in both ROIs (**p < 0.01). C, Bars depict the differential pRF value in the contralateral upper minus lower visual fields for both ROIs. FFA exhibits an upper and OFA a lower field bias. Elevation biases were significantly different from zero in both ROIs (*p < 0.05, **p < 0.01).
Discussion
We used three independent methods to confirm a retinotopic bias for the contralateral upper and lower visual fields that can explain the repeated scene selectivity on the ventral and lateral surfaces of OTC. First, pRF mapping revealed a strong bias toward the contralateral upper quadrant in PPA and the contralateral lower quadrant in TOS. Second, these quadrant biases were replicated in our condition-rich, event-related data in both magnitude and multivoxel pattern analyses. Finally, we identified through behavioral testing a significant advantage for open- and closed-scene discrimination in the upper visual field, consistent with the strong representation of this scene dimension within PPA (Kravitz et al., 2011). These results suggest that visual field biases in immediately antecedent early visual cortex persist into scene-selective regions and, more generally, may extend throughout both surfaces of OTC (Kravitz et al., 2013). This underlying retinotopic organization is consistent with biased anatomical projections from early visual areas to lateral and ventral TEO in macaque (Webster and Ungerleider, 1991; Distler et al., 1993; Saleem et al., 1993, 2000; Ungerleider et al., 2008). The need to represent categories across all four quadrants of the visual field likely underlies the repeated category-selective structure observed across both hemispheres and the lateral and ventral surfaces of OTC.
Retinotopic versus hierarchical organization of OTC
Whereas our data cannot completely rule it out, they nevertheless argue strongly against a strictly hierarchical organization between lateral and ventral scene-selective regions of OTC, a view that has dominated previous interpretations of such repeated category selectivity (Taylor and Downing, 2011). Although in monkey RF sizes have been reported to increase more anteriorly along the ventral visual hierarchy (Desimone and Gross, 1979), we found only a small and nonsignificant increase in RF size between lateral TOS and ventral PPA. Moreover, the two regions are biased toward different portions of the peripheral visual field and cannot be hierarchically organized beyond their overlap at the fovea/parafovea. Our data suggest a different framework in which the lateral and ventral scene-selective regions function in parallel with one another and are mutually constrained by underlying retinotopic organization. The segregation of the contralateral lower and upper visual fields in antecedent early dorsal and ventral visual cortex appears to persist into anterior scene-selective, face-selective (reported here), and object-selective (Kravitz et al., 2010) regions and likely underpins the origin, anatomical location, and observation of repeated category selectivity across the two surfaces.
Although TOS and PPA do not appear to be hierarchically related, within a given region (and more generally across a given surface) a hierarchical organization may still exist, as suggested by increasing RF sizes more anteriorly within PPA. This potential within-surface hierarchy may be particularly relevant for posterior/anterior portions of PPA, which despite both exhibiting contralateral upper biases have recently been shown to exhibit some functional differences (Baldassano et al., 2013).
Relationship to visual field maps
Visual field maps have previously been identified extending into and overlapping with high-level category-selective regions of cortex (Larsson and Heeger, 2006; Arcaro et al., 2009). Of particular relevance to the current study, two visual field maps (PHC1 and PHC2) have been reported within the vicinity of PPA on the ventral surface (Arcaro et al., 2009; Wang et al., 2014). The upper visual field biases we observed within PPA are consistent with visual field representations reported within PHC1/2, despite their putative hemifield representations (Arcaro et al., 2009; Wang et al., 2014). Indeed, under closer inspection, both maps display biases for the upper visual field, with relatively weak representation of the lower visual field, particularly within more anterior PHC2 (Arcaro et al., 2009; Wang et al., 2014), a feature noted previously (Kravitz et al., 2013). Here, we opted to characterize the receptive field properties of PPA as a whole, functionally defined region, rather than subdivide it into putative visual field map divisions. Although we do observe progressions of visual field maps along the posterior-anterior axis of PPA, we do not consistently observe representations of the lower vertical meridian.
Our TOS ROIs extended over large portions of the lateral surface. There is overlap between TOS and previously identified visual maps LO1, LO2, and V3A/B. LO1 and LO2, which show considerable overlap with lateral object-selective area LO (Sayres and Grill-Spector, 2008), also tend to exhibit an overrepresentation of the lower visual field, despite reported hemifield representations (Larsson and Heeger, 2006), an elevation bias consistent with their location on the lateral surface. The moderate representation of the upper visual field found in TOS likely arises from the overlap with V3A/B, which do contain full hemifield representations (Swisher et al., 2007).
Upper/lower field as an organizing principle across lateral and ventral OTC
Through our analyses, we have demonstrated the role of upper/lower field biases in determining the organization of scene-selective regions. Furthermore, our analyses both at the group level and within face-selective regions suggest that these biases extend throughout lateral and ventral OTC. The generality of these upper/lower biases is also supported by prior results in the literature. In particular, we, and others, have previously highlighted similar biases in the context of object selectivity (Schwarzlose et al., 2008; Kravitz et al., 2010). Furthermore, an upper field bias has been reported for word selectivity in the ventral visual word form area (Ino et al., 2008), and there may be an advantage for the upper half of words during recognition (Perea and Gomez, 2012). Similarly, a recent study (Wang et al., 2013) highlighted higher responses for stimuli presented in the upper versus lower visual field within face- and house-selective regions on the ventral surface. In addition, the body-selective extrastriate body area on the lateral surface lies in a region strongly biased toward the lower field (Chan and Baker, 2011; Weiner and Grill-Spector, 2011). Finally, analyses of resting-state functional connectivity suggest that the lateral surface has much stronger connectivity with the lower field representation in V1, whereas the ventral surface has much stronger connectivity with the upper field representation in V1 (Striem-Amit et al., 2015).
Pervasive role of retinotopy throughout OTC
The focus of this study has been on the difference between the upper and lower visual fields, but retinotopic information can also be defined around two other dimensions, ipsilateral/contralateral and foveal/peripheral, that also have a strong impact on the organization of OTC generally.
First, the overwhelming contralateral biases observed within TOS and PPA are consistent with biases present within macaque (Merigan and Saunders, 2004) inferotemporal cortex, despite increases in receptive field size as one moves anteriorly (Desimone and Gross, 1979; Op de Beeck and Vogels, 2000). Very recently, a causal role of such contralateral biases has been observed within face-selective patches of macaque inferotemporal cortex (Afraz et al., 2015). Furthermore, contralateral biases are present within human object-selective (Niemeier et al., 2005; Kravitz et al., 2010), face-selective (Hemond et al., 2007), and body-selective (Chan et al., 2010; Chan and Baker, 2011) cortices. These large biases in even high-level visual areas are obviously related to the contralateral biases in antecedent early visual cortex. The repeated category-selective structure across hemispheres may, therefore, arise from the need to represent high-level category information in both visual hemifields.
Second, eccentricity also acts to organize OTC, though perhaps at a finer scale, defining the relative positions of the different forms of category selectivity. Face- and scene-selective regions contain foveal and peripheral eccentricity biases (Levy et al., 2001), respectively, forming the basis of the proposed mirror-symmetry organization of OTC (Hasson et al., 2003). This is also observed in resting-state functional connectivity (Striem-Amit et al., 2015).
Combined with the differential representations of the lower and upper visual fields that we have demonstrated for TOS and PPA, these three dimensions can be thought of as jointly defining the distribution of category selectivity across the entire OTC. Their combined constraints lead to a repeated structure on the ventral and lateral surfaces and a foveal to peripheral gradient with increasing distance from the confluence of the surfaces. Interestingly, a similar and perhaps related pattern of organization has been observed for object size, with a small to large object gradient with increasing distance from the confluence between the surfaces (Konkle and Oliva, 2012; Konkle and Caramazza, 2013).
Conclusion
Together, our data suggest the organization of scene selectivity across the lateral and ventral OTC likely reflects underlying retinotopic biases for the contralateral lower and upper visual fields, rather than a strictly hierarchical link between regions on both surfaces. These findings suggest a simple retinotopic framework for interpreting the large-scale organization of category-selective regions throughout lateral and ventral OTC in both hemispheres.
Footnotes
This work was supported by the Intramural Research Program of the National Institutes of Health–National Institute of Mental Health Clinical Study Protocol 93-M-0170, NCT00001360. We thank Sean Marrett, Iris Groen, Adam Steel, Marcie King, and Aaron Trefler for helpful comments.
The authors declare no competing financial interests.
References
- Afraz A, Boyden ES, DiCarlo JJ. Optogenetic and pharmacological suppression of spatial clusters of face neurons reveal their causal role in face gender discrimination. Proc Natl Acad Sci U S A. 2015;112:6730–6735. doi: 10.1073/pnas.1423328112. [DOI] [PMC free article] [PubMed] [Google Scholar]
- Arcaro MJ, McMains SA, Singer BD, Kastner S. Retinotopic organization of human ventral visual cortex. J Neurosci. 2009;29:10638–10652. doi: 10.1523/JNEUROSCI.2807-09.2009. [DOI] [PMC free article] [PubMed] [Google Scholar]
- Baldassano C, Beck DM, Fei-Fei L. Differential connectivity within the parahippocampal place area. Neuroimage. 2013;75:228–237. doi: 10.1016/j.neuroimage.2013.02.073. [DOI] [PMC free article] [PubMed] [Google Scholar]
- Chan AW, Baker CI. Differential contributions of occipitotemporal regions to person perception. Cogn Neurosci. 2011;2:210–211. doi: 10.1080/17588928.2011.604723. [DOI] [PMC free article] [PubMed] [Google Scholar]
- Chan AW, Kravitz DJ, Truong S, Arizpe J, Baker CI. Cortical representations of bodies and faces are strongest in commonly experienced configurations. Nat Neurosci. 2010;13:417–418. doi: 10.1038/nn.2502. [DOI] [PMC free article] [PubMed] [Google Scholar]
- Chklovskii DB, Koulakov AA. Maps in the brain: what can we learn from them? Annu Rev Neurosci. 2004;27:369–392. doi: 10.1146/annurev.neuro.27.070203.144226. [DOI] [PubMed] [Google Scholar]
- de Haan EHF, Cowey A. On the usefulness of “what” and “where” pathways in vision. Trends Cogn Sci. 2011;15:460–466. doi: 10.1016/j.tics.2011.08.005. [DOI] [PubMed] [Google Scholar]
- Desimone R, Gross CG. Visual areas in the temporal cortex of the macaque. Brain Res. 1979;178:363–380. doi: 10.1016/0006-8993(79)90699-1. [DOI] [PubMed] [Google Scholar]
- DeYoe EA, Carman GJ, Bandettini P, Glickman S, Wieser J, Cox R, Miller D, Neitz J. Mapping striate and extrastriate visual cerebral cortex human. Proc Natl Acad Sci U S A. 1996;93:2382–2386. doi: 10.1073/pnas.93.6.2382. [DOI] [PMC free article] [PubMed] [Google Scholar]
- Dilks DD, Julian JB, Kubilius J, Spelke ES, Kanwisher N. Mirror-image sensitivity and invariance in object and scene processing pathways. J Neurosci. 2011;31:11305–11312. doi: 10.1523/JNEUROSCI.1935-11.2011. [DOI] [PMC free article] [PubMed] [Google Scholar]
- Dilks DD, Julian JB, Paunov AM, Kanwisher N. The occipital place area is causally and selectively involved in scene perception. J Neurosci. 2013;33:1331–1336a. doi: 10.1523/JNEUROSCI.4081-12.2013. [DOI] [PMC free article] [PubMed] [Google Scholar]
- Distler C, Boussaoud D, Desimone R, Ungerleider LG. Cortical connections of inferior temporal area TEO in macaque monkeys. J Comp Neurol. 1993;332:125–150. doi: 10.1002/cne.903340111. [DOI] [PubMed] [Google Scholar]
- Downing PE, Peelen MV. The role of occipitotemporal body-selective regions in person perception. Cogn Neurosci. 2011;2:186–203. doi: 10.1080/17588928.2011.582945. [DOI] [PubMed] [Google Scholar]
- Dumoulin SO, Wandell BA. Population receptive field estimates in human visual cortex. Neuroimage. 2008;39:647–660. doi: 10.1016/j.neuroimage.2007.09.034. [DOI] [PMC free article] [PubMed] [Google Scholar]
- Engel SA, Glover GH, Wandell BA. Retinotopic organization in human visual cortex and the spatial precision of functional MRI. Cereb Cortex. 1997;97:181–192. doi: 10.1093/cercor/7.2.181. [DOI] [PubMed] [Google Scholar]
- Epstein R, Kanwisher N. A cortical representation of the local visual environment. Nature. 1998;392:598–601. doi: 10.1038/33402. [DOI] [PubMed] [Google Scholar]
- Grill-Spector K, Kushnir T, Edelman S, Avidan G, Itzchak Y, Malach R. Differential processing of objects under various viewing conditions in the human lateral occipital complex. Neuron. 1999;24:187–203. doi: 10.1016/S0896-6273(00)80832-6. [DOI] [PubMed] [Google Scholar]
- Hasson U, Harel M, Levy I, Malach R. Large-scale mirror-symmetry organization of human occipito-temporal object areas. Neuron. 2003;37:1027–1041. doi: 10.1016/S0896-6273(03)00144-2. [DOI] [PubMed] [Google Scholar]
- Haxby JV, Hoffman EA, Gobbini MI. The distributed human neural system for face perception. Trends Cogn Sci. 2000;4:223–233. doi: 10.1016/S1364-6613(00)01482-0. [DOI] [PubMed] [Google Scholar]
- Hemond CC, Kanwisher NG, Op de Beeck HP. A preference for contralateral stimuli in human object- and face-selective cortex. PLoS One. 2007;2:e574. doi: 10.1371/journal.pone.0000574. [DOI] [PMC free article] [PubMed] [Google Scholar]
- Ino T, Nakai R, Azuma T, Tokumoto K, Usami K. An fMRI study of word reading and colour recognition in different quadrant fields. Open Neuroimag J. 2008;2:56–64. doi: 10.2174/1874440000802010056. [DOI] [PMC free article] [PubMed] [Google Scholar]
- Konkle T, Caramazza A. Tripartite organization of the ventral stream by animacy and object size. J Neurosci. 2013;33:10235–10242. doi: 10.1523/JNEUROSCI.0983-13.2013. [DOI] [PMC free article] [PubMed] [Google Scholar]
- Konkle T, Oliva A. A real-world size organization of object responses in occipitotemporal cortex. Neuron. 2012;74:1114–1124. doi: 10.1016/j.neuron.2012.04.036. [DOI] [PMC free article] [PubMed] [Google Scholar]
- Kourtzi Z, Kanwisher N. Representation of perceived object shape by the human lateral occipital complex. Science. 2001;293:1506–1509. doi: 10.1126/science.1061133. [DOI] [PubMed] [Google Scholar]
- Kourtzi Z, Erb M, Grodd W, Bülthoff HH. Representation of the perceived 3-D object shape in the human lateral occipital complex. 2003:911–920. doi: 10.1093/cercor/13.9.911. [DOI] [PubMed] [Google Scholar]
- Kravitz DJ, Kriegeskorte N, Baker CI. High-level visual object representations are constrained by position. Cereb Cortex. 2010;20:2916–2925. doi: 10.1093/cercor/bhq042. [DOI] [PMC free article] [PubMed] [Google Scholar]
- Kravitz DJ, Peng CS, Baker CI. Real-world scene representations in high-level visual cortex: it's the spaces more than the places. J Neurosci. 2011;31:7322–7333. doi: 10.1523/JNEUROSCI.4588-10.2011. [DOI] [PMC free article] [PubMed] [Google Scholar]
- Kravitz DJ, Saleem KS, Baker CI, Ungerleider LG, Mishkin M. The ventral visual pathway: an expanded neural framework for the processing of object quality. Trends Cogn Sci. 2013;17:26–49. doi: 10.1016/j.tics.2012.10.011. [DOI] [PMC free article] [PubMed] [Google Scholar]
- Larsson J, Heeger DJ. Two retinotopic visual areas in human lateral occipital cortex. J Neurosci. 2006;26:13128–13142. doi: 10.1523/JNEUROSCI.1657-06.2006. [DOI] [PMC free article] [PubMed] [Google Scholar]
- Lerner Y, Hendler T, Ben-Bashat D, Harel M, Malach R. A hierarchical axis of object processing stages in the human visual cortex. Cereb Cortex. 2001;11:287–297. doi: 10.1093/cercor/11.4.287. [DOI] [PubMed] [Google Scholar]
- Levy I, Hasson U, Avidan G, Hendler T, Malach R. Center-periphery organization of human object areas. Nat Neurosci. 2001;4:533–539. doi: 10.1038/87490. [DOI] [PubMed] [Google Scholar]
- MacEvoy SP, Epstein RA. Position selectivity in scene- and object-responsive occipitotemporal regions. J Neurophys. 2007;98:2089–2098. doi: 10.1152/jn.00438.2007. [DOI] [PubMed] [Google Scholar]
- Malach R, Reppas JB, Benson RR, Kwong KK, Jiang H, Kennedy WA, Ledden PJ, Brady TJ, Rosen BR, Tootell RB. Object-related activity revealed by functional magnetic resonance imaging in human occipital cortex. Proc Natl Acad Sci U S A. 1995;92:8135–8139. doi: 10.1073/pnas.92.18.8135. [DOI] [PMC free article] [PubMed] [Google Scholar]
- Merigan WH, Saunders RC. Unilateral deficits in visual perception and learning after unilateral inferotemporal cortex lesions in macaques. Cereb Cortex. 2004;14:863–871. doi: 10.1093/cercor/bhh045. [DOI] [PubMed] [Google Scholar]
- Niemeier M, Goltz HC, Kuchinad A, Tweed DB, Vilis T. A contralateral preference in the lateral occipital area: sensory and attentional mechanisms. Cereb Cortex. 2005;15:325–331. doi: 10.1093/cercor/bhh134. [DOI] [PubMed] [Google Scholar]
- Op de Beeck HP, Vogels R. Spatial sensitivity of macaque inferior. J Comp Neurol. 2000;426:505–518. doi: 10.1002/1096-9861(20001030)426:4<505::AID-CNE1>3.0.CO;2-M. [DOI] [PubMed] [Google Scholar]
- Op de Beeck HP, Haushofer J, Kanwisher NG. Interpreting fMRI data: maps, modules and dimensions. Nat Rev Neurosci. 2008;9:123–135. doi: 10.1038/nrn2314. [DOI] [PMC free article] [PubMed] [Google Scholar]
- Park S, Brady TF, Greene MR, Oliva A. Disentangling scene content from spatial boundary: complementary roles for the parahippocampal place area and lateral occipital complex in representing real-world scenes. J Neurosci. 2011;31:1333–1340. doi: 10.1523/JNEUROSCI.3885-10.2011. [DOI] [PMC free article] [PubMed] [Google Scholar]
- Perea M, Gomez P. Subtle increases in interletter spacing facilitate the encoding of words during normal reading. PLoS One. 2012;7:e47568. doi: 10.1371/journal.pone.0047568. [DOI] [PMC free article] [PubMed] [Google Scholar]
- Saleem KS, Tanaka K, Rockland KS. Specific and columnar projection from area TEO to TE in the macaque inferotemporal cortex. Cereb Cortex. 1993;2:454–464. doi: 10.1093/cercor/3.5.454. [DOI] [PubMed] [Google Scholar]
- Saleem KS, Suzuki W, Tanaka K, Hashikawa T. Connections between anterior inferotemporal cortex and superior temporal sulcus regions in the macaque monkey. J Neurosci. 2000;20:5083–5101. doi: 10.1523/JNEUROSCI.20-13-05083.2000. [DOI] [PMC free article] [PubMed] [Google Scholar]
- Sayres R, Grill-Spector K. Relating retinotopic and object-selective responses in human lateral occipital cortex. J. Neurophysiol. 2008;100:249–267. doi: 10.1152/jn.01383.2007. [DOI] [PMC free article] [PubMed] [Google Scholar]
- Schwarzlose RF, Swisher JD, Dang S, Kanwisher N. The distribution of category and location information across object-selective regions in human visual cortex. Proc Natl Acad Sci U S A. 2008;105:4447–4452. doi: 10.1073/pnas.0800431105. [DOI] [PMC free article] [PubMed] [Google Scholar]
- Sereno M, Dale AM, Reppas JB, Kwong KK, Belliveau JW, Brady TJ, Rosen BR, Tootell RBH. Borders of multiple visual areas in humans revealed by functional magnetic resonance imaging. Science. 1995;268:899–893. doi: 10.1126/science.7754376. [DOI] [PubMed] [Google Scholar]
- Sereno MI, Huang RS. A human parietal face area contains aligned head-centered visual and tactile maps. Nat Neurosci. 2006;9:1337–1343. doi: 10.1038/nn1777. [DOI] [PubMed] [Google Scholar]
- Sorger B, Goebel R, Schiltz C, Rossion B. Understanding the functional neuroanatomy of acquired prosopagnosia. Neuroimage. 2007;35:836–852. doi: 10.1016/j.neuroimage.2006.09.051. [DOI] [PubMed] [Google Scholar]
- Striem-Amit E, Ovadia-Caro S, Caramazza A, Margulies S, Villringer A, Amedi A. Functional connectivity of visual cortex in the blind follows retinotopic organization principles. Brain. 2015;138:1679–1695. doi: 10.1093/brain/awv083. [DOI] [PMC free article] [PubMed] [Google Scholar]
- Swisher JD, Halko MA, Merabet LB, McMains SA, Somers DC. Visual topography of human intraparietal sulcus. J Neurosci. 2007;27:5326–5337. doi: 10.1523/JNEUROSCI.0991-07.2007. [DOI] [PMC free article] [PubMed] [Google Scholar]
- Taylor JC, Downing PE. Division of labor between lateral and ventral extrastriate representations of faces, bodies, and objects. J Cogn Neurosci. 2011;23:4122–4137. doi: 10.1162/jocn_a_00091. [DOI] [PubMed] [Google Scholar]
- Ungerleider LG, Galkin TW, Desimone R, Gattass R. Cortical connections of area V4 in the macaque. Cereb Cortex. 2008;18:477–499. doi: 10.1093/cercor/bhm061. [DOI] [PubMed] [Google Scholar]
- Wang B, Yan T, Wu J, Chen K, Imajyo S, Ohno S, Kanazawa S. Regional neural response differences in the determination of faces and houses positioned in a wide visual field. PLoS One. 2013:8174–179. doi: 10.1371/journal.pone.0072728. [DOI] [PMC free article] [PubMed] [Google Scholar]
- Wang L, Mruczek REB, Arcaro MJ, Kastner S. Probabilistic maps of visual topography in human cortex. Cereb Cortex. 2014;pii:bhu277. doi: 10.1093/cercor/bhu277. [DOI] [PMC free article] [PubMed] [Google Scholar]
- Webster MJ, Ungerleider LG, Bachevalier J. Connections of inferior temporal areas TE and TEO with medial structures in infant and adult monkeys. J Neurosci. 1991;11:1095–1116. doi: 10.1523/JNEUROSCI.11-04-01095.1991. [DOI] [PMC free article] [PubMed] [Google Scholar]
- Weiner KS, Grill-Spector K. Not one extrastriate body area: using anatomical landmarks, hMT+, and visual field maps to parcellate limb-selective activations in human lateral occipitotemporal cortex. NeuroImage. 2011;56:2183–2199. doi: 10.1016/j.neuroimage.2011.03.041. [DOI] [PMC free article] [PubMed] [Google Scholar]
- Winawer J, Horiguchi H, Sayres RA, Amano K, Wandell BA. Mapping hV4 and ventral occipital cortex: the venous eclipse. J Vis. 2010;10(5):1–22. doi: 10.1167/10.5.1. [DOI] [PMC free article] [PubMed] [Google Scholar]