

Abstract
In previous studies, stimulation of ionotropic AMPA/kainate glutamate receptors on cultured oligodendrocyte cells induced the formation of a signaling complex that includes the AMPA receptor, integrins, calcium-binding proteins, and, surprisingly, the myelin proteolipid protein (PLP). AMPA stimulation of cultured oligodendrocyte progenitor cells (OPCs) also caused an increase in OPC migration. The current studies focused primarily on the formation of the PLP–αv integrin–AMPA receptor complex in vivo and whether complex formation impacts OPC migration in the brain. We found that in wild-type cerebellum, PLP associates with αv integrin and the calcium-impermeable GluR2 subunit of the AMPA receptor, but in mice lacking PLP, αv integrin did not associate with GluR2. Live imaging studies of OPC migration in ex vivo cerebellar slices demonstrated altered OPC migratory responses to neurotransmitter stimulation in the absence of PLP and GluR2 or when αv integrin levels were reduced. Chemotaxis assays of purified OPCs revealed that AMPA stimulation was neither attractive nor repulsive but clearly increased the migration rate of wild-type but not PLP null OPCs. AMPA receptor stimulation of wild-type OPCs caused decreased cell-surface expression of the GluR2 AMPA receptor subunit and increased intracellular Ca2+ signaling, whereas PLP null OPCs did not reduce GluR2 at the cell surface or increase Ca2+ signaling in response to AMPA treatment. Together, these studies demonstrate that PLP is critical for OPC responses to glutamate signaling and has important implications for OPC responses when levels of glutamate are high in the extracellular space, such as following demyelination.
SIGNIFICANCE STATEMENT After demyelination, such as occurs in multiple sclerosis, remyelination of axons is often incomplete, leading to loss of neuronal function and clinical disability. Remyelination may fail because oligodendrocyte precursor cells (OPCs) do not completely migrate into demyelinated areas or OPCs in lesions may not mature into myelinating oligodendrocytes. We have found that the myelin proteolipid protein is critical to regulating OPC migratory responses to the neurotransmitter glutamate through modulation of cell-surface expression of the calcium-impermeable GluR2 subunit of the AMPA glutamate receptor and increased intercellular Ca2+ signaling. Altered glutamate homeostasis has been reported in demyelinated lesions. Therefore, understanding how OPCs respond to glutamate has important implications for treatment after white matter injury and disease.
Keywords: AMPA, GluR2, integrin, migration, myelin proteolipid protein, oligodendrocyte
Introduction
During development, neuroblasts and glioblasts migrate extensively from proliferative germinal zones of the CNS (McMahon and McDermott, 2001; Suzuki and Goldman, 2003; Kessaris et al., 2008). Even at very early stages of development, neurotransmitters are found in the extracellular space. In particular, glutamate, the primary excitatory neurotransmitter of the CNS, is present at high levels in neurogenic zones during development and adulthood (Behar et al., 1999; Haydar et al., 2000; Platel et al., 2007). Glutamate signaling influences many aspects of neural progenitor development, including survival, proliferation, migration, and differentiation (for review, see Jansson and Akerman, 2014). Oligodendrocyte lineage cells express metabotropic and ionotropic AMPA, NMDA, and kainate glutamate receptors and are exposed to glutamate in both the gray and the white matter during development as well as to high levels of glutamate after injury or disease (Pende et al., 1994; Yuan et al., 1998; Deng et al., 2003, 2004; Káradóttir et al., 2005; Salter and Fern, 2005). Since glutamate receptor stimulation alters proliferation, migration, vesicle release, and differentiation of cultured oligodendrocyte cells (Pende et al., 1994; Holtzclaw et al., 1995; Gallo et al., 1996; Behar et al., 1999; Haydar et al., 2000; Stidworthy et al., 2004; Gudz et al., 2006; Platel et al., 2007; Bagayogo and Dreyfus, 2009; Zhang et al., 2009; Frühbeis et al., 2013; Hossain et al., 2014), it is important to understand how neurotransmitters impact oligodendrocyte precursor cells (OPCs) in vivo.
We previously showed that stimulation of cultured OPCs with AMPA, or the cholinergic receptor agonist carbachol, reduced binding to fibronectin (FN), increasing OPC migration (Gudz et al., 2002, 2006). Intriguingly, after neurotransmitter receptor activation, the myelin proteolipid protein (PLP) binds αv integrins and forms a complex with neurotransmitter receptors resulting in increased OPC migration and increased calcium signaling (Gudz et al., 2002, 2006). Signaling through the complex is mediated by phospholipase C (PLC), protein kinase A, and is Gi-protein dependent (Gudz et al., 2006).
Since the previous studies established this signaling system in cultured oligodendrocytes, a crucial question remained as to whether this also occurred in vivo. Thus, the current study focuses on whether the AMPA receptor is present in the PLP–integrin complex in the postnatal brain in vivo and whether the association of αv integrin and the GluR2 AMPA receptor subunit is disrupted in PLP null mice. To understand the physiological relevance of this complex, we investigated the roles of PLP, αv integrin, and GluR2 on OPC responses in organotypic cerebellar slices. The ex vivo slice microenvironment more closely resembles in vivo conditions of the CNS, compared with dissociated cell cultures, with the added benefit of ease of chemical treatments and real-time imaging of cell migration. We performed live imaging experiments on cerebellar slices expressing PLP–enhanced green fluorescent protein (EGFP; Mallon et al., 2002) to allow easy tracking of OPC migration for many hours. In wild-type (WT) slices, OPCs treated with AMPA increased their migration rate and had increased intracellular Ca2+ signaling. However, in slices from PLP null, GluR2 null, or heterozygous αv integrin mice, neither OPC migration nor Ca2+ signaling increased in response to AMPA, indicating that the PLP–αv integrin–GluR2 complex is required for AMPA-induced Ca2+ signaling and increased migration of OPCs. To determine whether AMPA was chemotactic, OPCs were exposed to gradients of AMPA in live imaging assays. OPCs did not migrate preferentially toward or away from AMPA but did increase their migration speed after exposure, indicating that AMPA was not chemotactic. AMPA stimulation caused internalization of GluR2 in wild-type but not PLP null OPCs. These data suggest that in addition to its role in myelin, PLP functions in nonmyelinating cells as a scaffolding protein required for intracellular signaling and is an important fundamental component in the regulation of OPC responses to neurotransmitters.
Materials and Methods
Animals.
All animal procedures were approved by the University of Colorado Institutional Animal Care and Use Committee or the Institutional Animal Care and Use Committee of the Cleveland Clinic Foundation. Mouse lines used were PLP null mice (Pende et al., 1994; Klugmann et al., 1997; Yuan et al., 1998; Deng et al., 2003, 2004; Káradóttir et al., 2005; Salter and Fern, 2005; Flores et al., 2008; Narayanan et al., 2009), GluR2null mice (Iihara et al., 2001; Narayanan et al., 2009; Tyler et al., 2009; Bercury et al., 2014; Wahl et al., 2014), and αv integrin heterozygous mice (Bader et al., 1998; Fyffe-Maricich et al., 2011, 2013; Ishii et al., 2012). All lines were crossed with PLP-EGFP mice (Barres et al., 1994; Ahlgren et al., 1997; Mallon et al., 2002; Huang et al., 2011), in which the Plp1 promoter drives EGFP in cells of the oligodendroglial lineage.
Immunostaining of P4 cerebellum.
Mice were transcardially perfused with 4% paraformaldehyde, postfixed overnight, and cryoprotected in 30% sucrose before embedding in Tissue-Tec O.C.T. Compound (Sakura Finetek VWR). Sagittal sections were cut at 20 μm on a cryostat. For αv integrin (1:100; Millipore) staining, slides were placed in 100% ice-cold acetone for 5 min before blocking. Antigen retrieval (10 mm sodium citrate, pH 6.0, containing 0.05% Tween two times for 5 min in a Biowave; Ted Pella) was performed for the following antibodies: Nkx2.2 (1:200; Developmental Studies Hybridoma Bank), Olig2 (1:200,000; a gift from Dr. Charles Stiles, Harvard University, Cambridge, MA), and NG2 (1:500; a gift from Dr. William Stallcup, Sanford-Burnham Medical Research Institute, La Jolla, CA). Sections were rinsed in PBS, subjected to antigen retrieval, rinsed two times in PBS, and blocked in 5% normal donkey serum (NDS) in PBS with 1% Triton X-100 (PBSTx) for 1 h at room temperature (RT). For Nkx2.2, blocking was performed according to the Mouse on Mouse kit (MOM; Vector Labs) instructions. Primary antibodies were applied overnight at RT or at 4°C (αv integrin) in 5% NDS in PBSTx (0.3%) or in MOM diluent. The following day, sections were washed in PBS, and the appropriate Alexa Fluor-conjugated secondary antibodies (Jackson ImmunoResearch) were applied for 2 h at RT at 1:800 in 5% NDS in PBSTx (0.3%) or in MOM diluent. Sections were washed three times for 10 min in PBS and mounted in Fluoromount G (Southern Biotech). Sections were imaged on a Leica SP5 confocal microscope.
Live imaging of OPC migration in acute slice preparations.
Sagittal slices (180 μm) were cut from cerebella of postnatal day 3 (P3) to P4 mice (wild-type male PLP-EGFP mice, male PLP−/Y-PLP-EGFP mice, αv integrin+/−-PLP-EGFP mice, or GluR2−/−-PLP-EGFP mice; both sexes) on a vibrating-blade microtome (VT1000S; Leica). Cerebellar slices were placed on 35 mm glass-bottom microwell dishes (MatTec), which had been coated with poly-l-lysine (100 μg/ml) in medium consisting of DMEM/F-12 (Invitrogen) with N2 supplement, 90 U/ml penicillin, and 90 μg/ml streptomycin. Each dish was put in a 5% CO2 incubator at 37°C. One hour later, slices were transferred into the chamber of a micro-incubator attached to the stage of a laser-scanning confocal microscope (TCS SP; Leica), which permitted high-resolution imaging of migrating EGFP-expressing OPCs up to 100 μm deep within the tissue slices. To prevent movement of the slice preparations during observation, a nylon net glued to a small silver wire ring was placed over the preparations. The rate of cell movement is closely related to the temperature of the medium; lowering the medium temperature slows cell movement (Rakic and Komuro, 1995; Lin et al., 2013). Therefore, the chamber temperature was kept at 37.0 ± 0.5°C using a temperature controller (TC-202; Medical System), and the slices were provided with constant gas flow (95% O2, 5% CO2). The tissue was illuminated with a 488 nm wavelength light from an argon laser through an epifluorescence inverted microscope equipped with a 40× oil-immersion objective (numerical aperture, 1.25; Leica), and fluorescence emission was detected at 530 ± 15 nm. To clearly resolve OPC movement, image data were typically collected at an additional electronic zoom factor of 1.5–2.0. Images of the OPCs in a single focal plane or up to 10 different focal planes along the z-axis were collected with laser scans every 5–30 min for up to 6 h. At the beginning and end of each recording session for each preparation, frame images were recorded with 40× magnification (electronic zoom factor of 1) or 20× magnification (electronic zoom factor of 1) to determine the orientation of the slice preparations, the borders of cerebellar cortical layers, and the position of OPCs by optical sectioning of several different focal planes along the z-axis. Time-lapse imaging of EGFP-expressing cells can produce phototoxic effects in the imaged cells. Indeed, when OPCs expressing high levels of EGFP were imaged with very high-incident illumination intensity, or imaged too frequently, there were changes in the structure or dynamics of the migrating OPCs. However, when the incident illumination was sufficiently attenuated, the specimens could be imaged (at 5 min intervals) for many hours without signs of photodynamic damage. To protect the migrating OPCs from any cytotoxic effect from the laser beam, the excitation light level was reduced by 95–97%. To avoid imaging injured OPCs located near the sectioning surfaces, we examined the shape and behavior of migrating OPCs located 15–30 μm below the surface of the slices. Shock to the tissue during sectioning of slices can disrupt cell movement and prevent cells from migrating. Therefore, if OPCs showed no evidence of changes in cell shape or motility for >60 min, the brain slice was discarded. Accordingly, the present study is based on analysis of ∼70% of the healthy slices that displayed active cell migration. This sampling procedure favored slices in which cells displayed visible and robust movement after sectioning.
Ca2+ measurements in cerebellar slices of P3–P4 mouse cerebellum.
Cerebella of P3–P4 mice (wild-type male PLP-EGFP mice, male PLP−/Y-PLP-EGFP mice, αv integrin+/−-PLP-EGFP mice, or GluR2−/−-PLP-EGFP mice) were sectioned sagittally into 180-μm-thick slices on a vibrating-blade microtome (VT1000S; Leica). To monitor the Ca2+ levels of PLP–EGFP-expressing OPCs, the cerebellar slices were incubated for 30 min with a cell-permeant acetoxymethyl ester form of 2 μm X-Rhod 1 (Invitrogen) diluted in the culture medium, which consisted of DMEM/F-12 (Invitrogen) with N2 supplement, 90 U/ml penicillin, and 90 μg/ml streptomycin. The slices were subsequently washed three times with the culture medium, and the dye was allowed to de-esterify for an additional 30–60 min in the CO2 incubator. Cerebellar slices were transferred into the chamber of a micro-incubator (Medical System) attached to the stage of a confocal microscope (TCS SP5; Leica). Chamber temperature was kept at 37°C, and the cells were provided with a constant gas flow (95% O2, 5% CO2). Slices loaded with X-Rhod 1 were illuminated with a 594 nm light from a HeNe laser, and the emission was detected at 630 ± 15 nm. Images were collected every 1–10 s for up to 2 h. The changes in fluorescent intensity of each OPC were normalized to its baseline fluorescent intensity. The movement of OPC somata to the outside of the focal plane often caused slow changes in the baseline fluorescent intensity of X-Rhod 1. To determine whether the changes in baseline fluorescent intensity reflect changes in Ca2+ levels or deviation of OPC somata from the focal plane, at the beginning and end of each recording session and when slow changes in baseline intensity were detected, the z-axis positions of OPCs were determined by optical sectioning along the z-axis. If the z-axis position of OPC somata changed by >1 μm from the initial position, the experimental data were excluded from this study.
Mouse oligosphere cultures.
OPCs were generated from wild-type and PLP null oligospheres as described previously (Pedraza et al., 2008; Dai et al., 2014). Oligospheres (passages 3–6) were dissociated using Accutase (Invitrogen) and plated on dishes coated with 10 μg/ml poly-d-lysine (PDL), followed by 10 μg/ml FN. Cells were plated in DMEM/F-12 (Invitrogen); supplemented with 1× B27 (Invitrogen), platelet-derived growth factor (PDGF), and human fibroblast growth factor (FGF; 10 ng/ml; Peprotech); and incubated at 37°C for 48–72 h.
Mouse mixed glia cultures.
Mouse mixed glia cultures were generated with modifications from O'Meara et al. (2011), Lau et al. (2013), and Harlow and Macklin (2014). Cortices of P0–P2 mice were dissected out into ice-cold minimal essential medium (MEM), and meninges were removed. Tissue was placed in 350 μl of MEM per brain at 37°C for 3 min and dissociated. Reagents were purchased from Sigma unless otherwise noted. Prewarmed papain solution [75 μl of 1.54 mg/ml papain (Worthington) in DMEM (Invitrogen), 360 μg/ml N-acetyl-l-cysteine, and 60 μg/ml DNase 1] was added to dissociated cortices, and samples were incubated at 37°C for 20 min with gentle mixing every 5 min. After dissociation, cells were gently triturated. To inactivate papain, 2 ml of OPC medium [DMEM plus 10% fetal bovine serum (FBS); HyClone Laboratories] was added, and samples were incubated at RT for 10 min. Cells were centrifuged for 5 min at 1200 rpm, supernatant was removed, and cells were resuspended in 1 ml of OPC medium. Cells were filtered through a 40 μm cell strainer and plated in 10 ml OPC medium in a T75 flask coated with 10 μg/ml poly-d-lysine. Mouse mixed glial cultures were incubated at 37°C in 8.5% CO2. The OPC medium was refreshed at 24 h and changed every 3 d. On day 6, insulin (2.5 μg/ml) was added to the OPC medium for the remainder of the mixed glia culture period. On day 9, flasks were briefly shaken to remove dead cells and loosely adherent microglia (100 rpm, 1 h). OPC medium plus insulin was replaced, and flasks were shaken overnight at 200 rpm at 37°C to detach the OPCs. Medium containing shaken cells was plated into a noncoated Petri dish for microglial and astrocyte attachment (30 min at 37°C, 8.5% CO2). Nonadherent cells were pelleted at 1200 rpm for 5 min, resuspended in OPC plating medium [DMEM, 5 μg/ml insulin, Glutamax, 50 μg/ml holo-transferrin, B27, 0.5% FBS, 0.1 mg/ml bovine serum albumin (BSA), 60 ng/ml progesterone, 20 μg/ml putrescine, 0.5 ng/ml sodium selenite, 400 ng/ml T3, 10 ng/ml PDGF, and 10 ng/ml FGF] and plated on 10 μg/ml fibronectin.
Coimmunoprecipitations and Western blot analysis.
Lysates were prepared from tissue or cultured cells. Cerebella of P7 mice were dissected out and homogenized in immunoprecipitation (IP) buffer (0.15 m NaCl, 50 mm Tris-HCl, pH7.5, 1 mm CaCl2, 1 mm MgCl2, 1% NP-40, and protease and phosphatase inhibitors) using a Dounce homogenizer. Samples were lysed on ice for 1 h and spun for 10 min at 13,000 rpm to remove debris. Lysates from oligosphere cultures were generated by rinsing cells twice with ice-cold Dulbecco's PBS before lysis in IP buffer as described above. For immunoprecipitation, lysates (2 mg/ml) were precleared for 1 h at 4°C with rat IgG-conjugated magnetic beads (DynaG beads; Invitrogen). Precleared lysates were incubated with 4 μg of rat anti-αv integrin antibody (CBL1346Z-1; Millipore) or 20 μl of rat anti-PLP antibody (AA3) overnight at 4°C with rotation. Complexes were captured for 4 h with 20 μl of DynaG beads and washed. Immunoprecipitates were eluted by boiling in a sample buffer without (αv integrin) or with (GluR2 and PLP) dithiothreitol, separated by SDS-PAGE, transferred to Immobilon-FL polyvinylidene membranes, and blocked with 5% BSA. Membranes were incubated with rabbit anti-GluR2 (1:1000, 133477; Abcam), rabbit anti-αv integrin (AB1930; Millipore), or AA3 (1:500) overnight and incubated with appropriate secondary antibodies for 30–60 min at RT. Infrared secondary antibodies were detected on an Odyssey Imager (Licor).
Chamber slide assay.
Mouse OPCs derived from oligosphere cultures were plated at a density of 15,000 cells/well in eight-well chamber slides (iBidi) for 72 h. All incubations were at 37°C in a 5% CO2 incubator. Before plating, slides were coated with 10 μg/ml PDL for 1 h at RT, rinsed, and coated with 10 μg/ml fibronectin overnight at 37°C. AMPA (0.5, 2, 10, 50, and 100 μm) or vehicle treatment was added just before imaging. Slides were placed in a temperature controller, and images were captured every 5–10 min using the 10× objective on a Leica SP5 inverted microscope.
Chemotaxis assays of cultured OPCs.
Mouse OPCs derived from mouse mixed glia cultures were plated in 2-D Chemotaxis slides (iBidi). All incubations were at 37°C in an 8.5% CO2 incubator. Channel slides were coated with PDL (150 μg/ml) for 1 h at RT, rinsed three times with water, and coated with fibronectin (80 μg/ml) for 1 h at RT. Cells were plated at 50,000 cells/channel in OPC plating medium for 4–6 h for attachment. Channels were rinsed once with medium to remove nonadherent cells, and 2 μm gradients of AMPA were established by adding 5 μm AMPA to one chamber per the manufacturer's instructions. Images of OPC migration were taken every 5 min using a 10× objective on a Leica SP5 inverted microscope.
Cell tracking and statistical analysis.
Cell migration was tracked using the Manual Tracking plugin (http://rsb.info.nih.gov/ij/plugins/track/track.html, Fabrice Cordelires) and analyzed using the Chemotaxis Tool plugin (iBidi) for ImageJ. For the chamber slide assays, three separate experiments were done, with at least 30 cells tracked per condition per experiment. The cells were tracked for 120 min to determine migration velocity. To investigate the effect of AMPA on migration velocity, concentration response curves for AMPA were calculated by plotting AMPA concentration (on a log scale) versus migration velocity normalized to vehicle treatment. Concentration response curves for AMPA were calculated by four-parameter nonlinear regression using GraphPad Prism software. To determine a significant increase in migration velocity relative to vehicle, calculated maximum velocity (Emax) was compared with 1 (the velocity of vehicle controls) using a one-sample Student's t test. Curve fits could not be calculated for the PLP−/Y cells because the null cells had no response to AMPA. Chemotaxis assays of wild-type cells (four separate experiments with the total number of cells included in gradient analysis, n = 192) were tracked for 14 h. The distribution of OPCs from their respective starting points was analyzed by a Raleigh test for uniformity. Statistical significance was defined at p < 0.05.
GluR2 internalization experiments and statistical analysis.
Oligospheres were dissociated and plated at a density of 750,000 cells/well in six-well plates coated with 10 μg/ml poly-d-lysine, followed by 10 μg/ml fibronectin for 48–72 h. Cells were treated with 100 μm AMPA plus 60 μm cyclothiazide (Tocris) at 37°C. At the end of the time course, cells were placed on ice and rinsed twice with ice-cold PBS. The cell surface was biotinylated with EZ-Link Sulfo-NHS-SS-Biotin (250 μg/ml; Thermo Fisher Scientific) for 30 min at 4°C with gentle rocking. Biotinylation was quenched for 10 min at 4°C, and cells were washed three times in cell wash buffer (50 mm Tris-HCl, pH7.5, 0.15 m NaCl, 1 mm CaCl2, and 1 mm MgCl2) and lysed in 500 μl of IP buffer on ice for 1 h. Lysates were spun for 10 min at 13,000 rpm to remove insoluble material. An aliquot of supernatant (100 μl) was taken from each sample for total protein fraction. High Capacity NeutrAvidin Beads (100 μl; Thermo Fisher Scientific) were added to each lysate to capture biotinylated membrane proteins, and samples were rotated for 1 h at RT. Beads were spun down to collect the membrane fraction, and 100 μl of supernatant was taken for the internal protein fraction. Beads were washed four times in PBS, and the membrane fraction was resuspended in 200 μl of 2× sample buffer. Total and internal protein samples were diluted 1:1 in 2× sample buffer, and all lysates were boiled for 5 min. Lysates were spun for 5 min at 10,000 rpm to remove beads before loading the supernatants for SDS-PAGE. Western blots were probed for GluR2 (Abcam), GluR3 (Millipore), and actin (Cell Signaling) using infrared secondary antibodies (Licor) and detected on the Licor Odyssey. The densitometry of bands was determined using Image Studio software (Licor), and ratios of internal/total and cell-surface/total GluR2 were calculated and normalized to baseline (t = 0). Statistical analysis of time-course internalization of GluR2 within each genotype was performed on internal/total and membrane/total normalized ratio values using one-way ANOVA, followed by Dunnett's multiple comparison post hoc test using Prism software (GraphPad). Data are graphed as mean normalized to t = 0 ratios ± SD across n = 4 experiments.
Results
PLP, αv integrin, GluR2, and fibronectin expression in vivo
The myelin PLP is an important structural component of myelin in mature oligodendrocytes. PLP and its smaller isoform DM20 are also expressed in OPCs. AMPA treatment of OPCs in culture causes an increased association of αv integrin with PLP and the GluR2 subunit of the AMPA glutamate receptor, decreased binding to fibronectin, and increased OPC migration (Bradbury et al., 2002; Gudz et al., 2006; Karimi-Abdolrezaee et al., 2012; Starkey et al., 2012). To investigate the physiological impact of this complex in vivo, we examined the expression of PLP, αv integrin, AMPA GluR subunits, and fibronectin in the cerebellum of PLP-EGFP mice at P4 (Fig. 1). In PLP-EGFP mice, the Plp1 promoter drives EGFP in cells of the oligodendroglial lineage, allowing for easy identification of OPCs (Mallon et al., 2002; Setzu et al., 2006; Blakemore, 2008). Migratory OPCs were identified by expression of PLP–EGFP and their bipolar morphology. Fibronectin was concentrated at the centers and edges of individual folia in the developing white matter tracts where OPCs were migrating (Fig. 1A, arrows; inset, arrowheads), indicating that OPCs could use fibronectin as a migration substrate in vivo. The αv integrin was highly expressed along processes of PLP–EGFP bipolar migrating OPCs (Fig. 1B, inset, arrowheads). To verify the identity of bipolar migratory PLP–EGFP-expressing cells as OPCs, cerebellar slices were stained for OPC markers. Migrating bipolar PLP–EGFP-positive cells expressed NG2+, a marker of OPCs (Fig. 1C). Some multiprocessed NG2+, Olig2+, and PLP–EGFP cells were also seen (Fig. 1D), but these cells were not tracked in the live imaging experiments described below. Many bipolar PLP–EGFP cells expressed Nkx2.2 (Fig. 1E), an early marker of oligodendrocytes (Qi et al., 2001; Fu et al., 2002; Ding et al., 2015). No staining was seen when primary antibodies were omitted (data not shown). As reported by others (Li and Stys, 2000; Cambron et al., 2012; Fünfschilling et al., 2012; Lee et al., 2012), we were unable to detect the GluR subunits of AMPA receptors via immunofluorescent analysis of the tissue, but robust expression of GluR1, GluR2, GluR3, and GluR4 was seen in lysates of P4 cerebellum (Fig. 1F), and GluR2, GluR3, and GluR4 were detected in purified mouse OPCs (see Fig. 8A). Both αv integrin and PLP protein were also detected by Western blot in P4 cerebellum, although at this early time point, PLP/DM20 protein levels were quite low compared with the high levels of PLP/DM20 protein seen in the P7 spinal cord, which is actively myelinating at this age (Fig. 1F).
Figure 1.

Expression of fibronectin, PLP–EGFP, αv integrin, and AMPA receptor subunits in cerebellum at P4. A, PLP–EGFP-labeled OPCs in P4 cerebellum migrated in areas of fibronectin expression (arrows; red). B, The αv integrin (red) was expressed along PLP–EGFP OPC processes (inset, arrowheads). C, Bipolar migratory PLP–EGFP cells expressed NG2 (arrowheads). D, Olig2 and NG2 expression in PLP–EGFP-positive cells (arrowheads). E, Nkx2.2, an early marker of oligodendrocytes, in PLP–EGFP-positive cells. F, Expression of AMPA receptor GluR subunits, αv integrin (αvI), and PLP/DM20 in P4 cerebellum. Scale bars: A, C, 50 μm; A, inset, 10 μm; B, D, 25 μm; E, 10 μm.
Figure 8.

AMPA-induced internalization of GluR2 is disrupted in PLP null OPCs. A, Expression of GluR subunits in WT and PLP−/Y null OPCs. B, Western blots of GluR2 and GluR3 and actin protein expression in total (T), internal (I), and the cell-surface or membrane (M) fractions of WT OPCs after a time course of treatment with 100 μm AMPA plus 60 μm cyclothiazide. Treatment of wild-type OPCs did not alter internal protein levels (one-way ANOVA, F(5,18) = 0.09474, p = 0.9919) but caused a decrease in the amount of GluR2 present on the cell surface, peaking at 20 min (one-way ANOVA, F(5,12) = 3.498, p = 0.0351). C, Treatment of PLP null OPCs did not increase the internalization of GluR2 (one-way ANOVA, F(5,11) = 0.3868, p = 0.8480). Graphs depict the mean ratio ± SD of internal/total and membrane/total ratios of GluR2 normalized to the ratio at baseline (t = 0) for n = 4 experiments for each genotype.
AMPA treatment increased wild-type OPC migration in organotypic cerebellar slices
To determine whether AMPA affected OPC migration in the brain, we first performed live imaging experiments of OPC migration in organotypic cerebellar slices from P4 PLP-EGFP mice (Fig. 2). During the first few postnatal days, OPCs in vivo arise in the subependymal layers of the fourth ventricle and enter into the base of the cerebellum via the superior medullary velum. They then migrate extensively in the white matter and internal granular layer of the developing folia of the cerebellum (Curtis et al., 1988; Reynolds and Wilkin, 1988; Kiryu-Seo et al., 2010; Zambonin et al., 2011; Ohno et al., 2014). Organotypic slices retain the architecture of the cerebellum, including neuronal and glial networks, which allows for observation of OPC migration in a microenvironment very similar to that in vivo. Slices were made from PLP-EGFP mice (Mallon et al., 2002; Joshi et al., 2015) to allow for easy identification and tracking of individual OPCs in the slice. Within the slice, EGFP-labeled OPCs could be imaged for extended periods of time using a scanning confocal microscope with low-powered laser intensity and a heated chamber (see Materials and Methods for details). Images were taken every 5–30 min for up to 6 h, and both speed and distance traveled were calculated. Single OPCs were tracked in either control slices (Fig. 2A) or slices treated with AMPA (Fig. 2B). Statistical analysis of the cell populations from all live imaging slice experiments is presented in Figure 6. Migrating OPCs expressing PLP–EGFP had a bipolar morphology with a long leading process; they migrated in the direction of the tip of the leading process (Fig. 2A). AMPA titration was performed to assess maximal migration responses. We found that 2 μm AMPA gave maximal migration response and that increasing the AMPA concentration beyond 2 μm did not increase migration (Fig. 2C); therefore, 2 μm was used for all migration experiments. Although speeds varied from cell to cell, for each individual cell the rate of migration and distance traveled by the OPC soma were fairly consistent over the entire imaging period (Fig. 2D). Cells were imaged for an extended period (120 min) before treatment with AMPA. Application of 2 μm AMPA immediately accelerated the migration of OPCs over baseline migration speeds (Fig. 2E). The ability of AMPA to induce increased migration of OPCs in slices supports a physiological role for glutamate receptor activation in OPC migration in vivo.
Figure 2.

AMPA increases migration of OPCs in the P4 cerebellum. A, Time-lapse images of a PLP–EGFP-expressing OPC that migrates toward the direction of the tip of the long leading process. Scale bar, 18 μm. B, Time-lapse images of baseline OPC migration before the addition of AMPA (0–120 min) and after the addition of AMPA (121–240 min). Scale bar, 20 μm. For A and B, yellow asterisks mark the OPC soma, and the elapsed time in minutes is indicated above each image. C, Histogram showing the effects of 0.1–100 μm AMPA on the rate of OPC migration in slices of P4 wild-type PLP-EGFP mouse cerebella. Numbers in parentheses in each column indicate the number of OPCs tested. Error bars indicate SD. Asterisks indicate statistical significance (p < 0.05). D, Sequential changes in the total distance plotted as a function of elapsed time and calculated speed by the OPC soma during each 30 min of the imaging period shown in A. E, Sequential changes in the total distance and average calculated speed during each 30 min of the imaging period by the OPC soma shown in B were plotted as a function of elapsed time before and after application of 2 μm AMPA. Application of 2 μm AMPA immediately accelerated the migration of OPC.
Figure 6.

Summary of cerebellar slice experiments. OPCs deficient in PLP, GluR2, or αv integrin had reduced baseline migration speeds and did not accelerate in response to AMPA treatment of cerebellar slices. A, The average speed of OPC migration was significantly slower in all mutant slices compared with wild-type PLP–EGFP OPCs. B, Differential effects of the application of 2 μm AMPA on the percentage change in migration speed from the baseline speed of PLP–EGFP-expressing OPCs in P4 cerebellum from wild-type, GluR2+/−, PLP−/Y, or αv integrin+/− mice. C, Baseline Ca2+ transients in untreated slices from WT, PLP−/Y, GluR2−/−, or αv integrin+/−. D, Differential effects of the application of 2 μm AMPA on the percentage change in the number of Ca2+ transients from the baseline of OPCs in P4 cerebellum from wild-type, GluR2−/−, PLP−/Y, or αv integrin +/− mice. Each bar represents the average of OPCs from all experiments, and error bars represent SDs. Asterisks indicate statistical significance (p < 0.05).
AMPA increases intracellular Ca2+ signaling in wild-type OPCs
To monitor intracellular calcium signaling in PLP–EGFP-expressing OPCs, cerebellar slices were incubated for 30 min with the cell-permeant acetoxymethyl ester form of 2 μm X-Rhod 1 (Life Technologies), a Ca2+ indicator dye, diluted in the culture medium before performing live imaging experiments. X-Rhod 1 has a long-wavelength of excitation (594 nm) and emission (630 nm) and can be used with EGFP (Bolsover et al., 2001). We examined the effect of loading of 2 μm X-Rhod 1 on baseline OPC migration. In cerebellar slices of wild-type male PLP-EGFP mice without X-Rhod 1, the migration rate of PLP–EGFP-expressing OPCs was 18.5 ± 2.7 μm/h (n = 11), and with X-Rhod 1, the migration rate was 18.1 ± 2.4 μm/h (n = 10), indicating that the loading of 2 μm X-Rhod 1 did not cause any significant noxious effects on OPC migration (data not shown).
Labeling of PLP–EGFP OPCs with 2 μm X-Rhod 1 revealed spontaneous Ca2+ transients at baseline (Fig. 3). The addition of 2 μm AMPA to the slice medium caused a rapid increase in the number (Fig. 3A,C) and amplitude (Fig. 3B,D) of Ca2+ transients in OPCs, which peaked at 20 min after the addition of AMPA. We performed additional experiments to determine whether the increase in transients was attributable to Ca2+ permeation through the AMPA receptor complex or via other mechanisms. In addition to calcium-permeable AMPA receptors, OPCs also express voltage-dependent Ca2+ channels (VDCCs) whose activity is required for PDGF-mediated OPC migration (Bjartmar and Trapp, 2001; Paez et al., 2010). The addition of the L-type Ca2+ channel inhibitor nifedipine (20 μm) significantly decreased the number (Fig. 3C, blue bars) and amplitude (Fig. 3D, blue bars) of spontaneous Ca2+ transients of OPCs in wild-type PLP–EGFP slices by ∼40% from baseline, suggesting that the activity of L-type Ca2+ channels plays a role in the occurrence of spontaneous Ca2+ transients of OPCs. OPC migration was similarly inhibited by nifedipine (data not shown). Nevertheless, it is likely that Ca2+ transients induced by the L-type Ca2+ channels or the AMPA receptor are distinct. Thus, AMPA treatment in the presence of 20 mm nifedipine still increased Ca2+ transients (Fig. 3C,D, brown bars), with nifedipine inducing a comparable decrease (∼40%) in the number and amplitude of Ca2+ transients to that seen in the absence of AMPA. These data suggest that nifedipine blocks calcium entry via an AMPA-independent, L-type Ca2+ channel-dependent mechanism and L-type VDCCs play little role in AMPA-mediated calcium influx.
Figure 3.
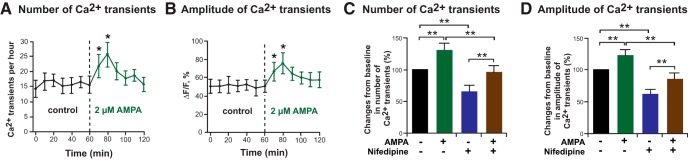
AMPA-induced alteration of number and amplitude of Ca2+ transients in OPCs in P4 cerebellum. A, B, The alterations of number (A) and amplitude (B) of Ca2+ transients of OPCs in P4 cerebellum from wild-type-PLP-EGFP mice were plotted over elapsed time before and after application of 2 μm AMPA. Each value represents the average of 12 OPCs, and error bars represent SDs. Asterisks indicate statistical significance (p < 0.05). C, D, AMPA (2 μm) treatment alone (green bars) increased the number (C) and amplitude (D) of Ca2+ transients in OPCs above baseline (black bars). Treatment with 20 μm nifedipine, an L-type Ca2+ channel inhibitor, reduced the number (C) and amplitude (D) of Ca2+ transients in OPCs in the absence of AMPA (blue bars). When OPCs were treated with 20 μm nifedipine plus 2 μm AMPA (brown bars), there was a reduction in the number (C) and amplitude (D) of Ca2+ transients compared with AMPA treatment alone. The percentage change in number and amplitude of Ca2+ transients of OPCs in P4 cerebellum from wild type was evaluated by dividing the amplitude and number of Ca2+ transients after application of each regent by the amplitude and number of Ca2+ transients before application of each reagent. Each bar represents the average of OPCs from all experiments (AMPA, n = 12; nifedipine, n = 10; AMPA plus nifedipine, n = 13), and error bars represent SDs. Asterisks indicate statistical significance (p < 0.01).
PLP was required for glutamate-induced OPC migration and forms complexes with αv integrin and GluR2 in vivo
To determine whether PLP is required for the neurotransmitter-induced increase in OPC migration, we next asked whether AMPA would increase OPC migration in the absence of PLP. OPC migration was analyzed in cerebellar slices from male PLP null (PLP−/Y) mice (Klugmann et al., 1997; Deshmukh et al., 2013) expressing the PLP–EGFP transgene. PLP null OPCs migrated in untreated cerebellar slices in a manner similar to wild-type OPCs (Fig. 4A), although, on average, their baseline rate of migration was slightly slower than wild-type OPCs (see Fig. 6A). However, in contrast to wild-type OPCs, PLP null cells did not increase their migration rates in response to AMPA (Fig. 4B). AMPA receptor activation of rat OPCs in culture results in increased association of GluR2 with the αv integrin–PLP complex and reduced fibronectin binding (Gudz et al., 2006; Mei et al., 2014). We performed several co-IPs from cerebellar lysates from wild-type P7 pups to determine whether complex formation between PLP, αv integrin, and GluR2 occurred in vivo. When lysates were immunoprecipitated with antibodies against PLP, we detected low levels of GluR1 and robust amounts of GluR2, GluR4, and αv integrin (Fig. 4C). In addition, when αv integrin was immunoprecipitated from wild-type cerebellar lysates, PLP, GluR2, and GluR3 were detected (Fig. 3D). When PLP null lysates were immunoprecipitated with αv integrin antibody, GluR2 was not detected in association with αv integrin, although it was robustly present in cerebellar lysates from PLP null animals (Fig. 3D). In contrast, the GluR3 subunits were associated with αv integrin in both WT and PLP null lysates and potentially an association in other cell types (i.e., neurons) in the cerebellum. The overall expression levels of αv integrin and GluR subunits, as determined by co-IP inputs, were unaffected in PLP null mice (Fig. 4D). These data indicate that this complex does exist in the cerebellum in vivo and that GluR2 association with αv integrin is disrupted in the absence of PLP.
Figure 4.

In the absence of PLP, OPC migration did not increase in response to AMPA and αv integrin did not associate with GluR2. A, Time-lapse images of cerebellar slices obtained from P4 PLP−/Y-PLP-EGFP mice. OPC soma is marked by yellow asterisks. The elapsed time is indicated above each image. Scale bar, 20 μm. B, Sequential changes in the total distance and average calculated speed during each 30 min of the imaging period by the OPC soma shown in A were plotted as a function of elapsed time before and after application of 2 μm AMPA. Application of AMPA did not accelerate the migration of PLP−/Y OPCs. C, Immunoprecipitation of PLP from P7 wild-type cerebellum demonstrated association of GluR2, GluR4, and αv integrin with PLP, minimal association with GluR1, and no association with GluR3. D, Immunoprecipitation of αv integrin from the cerebellum of P7 wild-type and PLP−/Y mice. PLP was detected in the complex in wild-type mice and was absent in PLP null mice. The association of GluR2 with αv integrin was disrupted in PLP−/Y mice. GluR3 was associated with αv integrin in both WT and PLP null mice. GluR4 was not associated with αv integrin in either WT or PLP null mice.
GluR2−/− and αv integrin+/− OPCs did not increase migration in response to AMPA
To examine the roles of the GluR2 AMPA receptor subunit and αv integrin in neurotransmitter-mediated OPC migration, we crossed the PLP-EGFP line with GluR2 null (Iihara et al., 2001) or αv integrin heterozygous mice (Bader et al., 1998). These studies had to be done with αv integrin heterozygous mice because the majority of αv integrin null mice die in utero (Bader et al., 1998) and we were unable to obtain postnatal αv integrin null mice. As with slices from the PLP null mice, OPCs labeled with PLP–EGFP in both GluR2 null (Fig. 5A) and αv integrin (Fig. 5C) heterozygous slices could migrate in cerebellar slices under baseline untreated conditions. When slices were treated with 2 μm AMPA, no increase in OPC migration speed or distance traveled was seen in cerebella from mice null for GluR2 (Fig. 5B) or heterozygous for αv integrin (Fig. 5D). Quantification of OPC migration from multiple slices (15–18 slices per genotype) revealed that at baseline, OPCs from the three mutant mice migrated slightly but significantly slower than wild-type OPCs (Fig. 6A). In response to AMPA, wild-type OPCs increased their migration speed ∼150%, whereas mutant OPCs did not change their migration speed from baseline (Fig. 6B).
Figure 5.

OPCs that were null for GluR2 or deficient in αv integrin did not accelerate their migration rate in response to AMPA in P4 cerebellum. A, Time-lapse images of OPC migration in P4 cerebellum from GluR2−/− PLP-EGFP mouse. Yellow asterisks mark the soma of OPC. The elapsed time is indicated above each image. Application of AMPA (2 μm) did not accelerate the migration of GluR2−/− OPCs. Scale bar, 15 μm. B, Sequential changes in the total distance and calculated speed traveled during each 30 min of the testing period by the OPC soma shown in A were plotted as a function of elapsed time before and after application of 2 μm AMPA. C, Time-lapse images representing OPC migration in the cerebellum of P4 αv integrin+/− PLP-EGFP mice. Application of AMPA (2 μm) did not accelerate the migration of αv integrin+/− OPCs. Scale bar, 10 μm. D, Sequential changes in the total distance and average calculated speed traveled during each 30 min of the testing period by the OPC soma shown in C were plotted as a function of elapsed time before and after application of 2 μm AMPA.
AMPA did not increase Ca2+ signaling in OPCs in the absence of PLP or GluR2 or with αv integrin deficiency
To determine whether there was a failure of AMPA stimulation to alter Ca2+ signaling in the absence of the PLP–αv integrin–AMPA receptor complex, we also performed live Ca2+ imaging on migrating OPCs in PLP−/Y, GluR2−/−, and αv integrin+/− slices. The number of Ca2+ transients at baseline was reduced in PLP−/Y and GluR2−/− OPCs (Fig. 6C). Application of 2 μm AMPA to the medium resulted in an increase in both the number (Fig. 6D) and the amplitude (data not shown) of spontaneous Ca2+ transients of OPCs in P4 cerebellum from wild-type PLP-EGFP mice, but not from GluR2−/−, PLP−/Y, or αv integrin+/− mice. Thus, together with our previous findings (Gudz et al., 2006), in the wild-type condition, AMPA receptor stimulation results in increased association of GluR2 and αv integrin with PLP, which leads to an influx of Ca2+, decreased binding to fibronectin, and increased migration speed both in vitro and in vivo. In the absence of PLP, complex formation was reduced in vivo, leading to slower OPC migration rates at baseline and preventing increased intracellular Ca2+ signaling and enhanced OPC migration in response to glutamate.
AMPA was not chemotactic to migrating OPCs
OPC migration speeds increase with bath application of AMPA of both cultured oligodendrocytes (Gudz et al., 2006) and cerebellar slices (Fig. 2), raising the question of whether AMPA simply increases migration rates or whether glutamate is chemotactic (attractive or repulsive) to OPCs. This difference could have important implications for the physiological role of this response mechanism in OPCs. To determine whether AMPA was attractive or repulsive, OPCs were isolated from mouse oligospheres from wild-type or PLP null neonatal mice and plated on fibronectin, a ligand for αv integrin. We first confirmed the presence or absence of the PLP/DM20 proteins and demonstrated that these cells expressed GluR2 and αv integrin by Western blot (Fig. 7A). To determine if AMPA treatment of OPCs increased the association of αv integrin with PLP, wild-type OPCs were treated with 2 μm AMPA and then cell lysates were immunoprecipitated with antibody against PLP and probed with an antibody against αv integrin. Treatment with AMPA increased the amount of αv integrin associated with PLP (Fig. 7B), indicating that AMPA receptor stimulation increases complex formation between PLP and αv integrin. When WT and PLP−/Y null OPCs were treated with AMPA and co-IPs of αv integrin were performed, there was an increased association of GluR2 with αv integrin in WT OPCs but not in PLP null OPCs (Fig. 7C). We performed a titration of AMPA on OPC migration. WT OPCs increased their migration in response to AMPA, whereas PLP null OPCs did not (Fig. 7E).
Figure 7.

AMPA increased the association of PLP and GluR2 with αv integrin and the migration rate in wild-type but not PLP null OPCs, but it is neither attractive nor repulsive to migratory OPCs. A, OPCs isolated from wild-type or PLP null (−/Y) mouse mixed glia cultures expressed αv integrin (αvI), GluR2, and PLP in culture. B, Treatment of wild-type OPCs with 2 μm AMPA resulted in an increased association of αv integrin with PLP. C, Treatment of WT OPCs, but not PLP null OPCs, with 2 μm AMPA resulted in an increased association of GluR2 with αv integrin. D, Diagram of setup for live imaging in channel slides. To establish gradients for chemotaxis assays shown in F–H, cells were seeded in the middle channel, and control medium or medium containing AMPA was added to individual chambers on either side. E, Dose–response of WT (circles) and PLP−/Y null (squares) OPCs to AMPA. F, Individual tracks of wild-type OPCs from live imaging experiment in channel slide with medium in both chambers. The starting point for each track was placed at the origin. Black lines indicate OPCs whose overall migration was toward the left chamber, whereas red lines indicate OPCs whose overall migration was toward the right chamber. The overall distribution around the origin is uniform, indicating that migration was not directional. G, When 2 μm AMPA was placed in both chambers (bath application), wild-type OPC migration remained nondirectional. H, When 5 μm AMPA was placed only in the left chamber to set up a gradient of 2 μm AMPA across wild-type OPCs in the channel, migration also remained nondirectional. Rayleigh's test for uniform distribution was used, and p > 0.05 for all conditions.
To perform chemotaxis assays, we plated wild-type and PLP null OPCs in a gradient of AMPA using specially designed channel slides (iBidi; Fig. 7D). OPCs were plated on fibronectin in a narrow channel between two larger chambers filled with medium, which allowed us to image OPC migration in medium only (Fig. 7F), in bath applications of AMPA (Fig. 7G), or in a gradient of AMPA (Fig. 7H). By adding 5 μm AMPA to one chamber only, a stable gradient of 2 μm AMPA formed across the channel containing OPCs. Cells were tracked in FIJI using the Manual Tracking plugin (http://rsb.info.nih.gov/ij/plugins/track/track.html). Tracking files were opened with the Chemotaxis Plugin (iBidi), and results were plotted as a trajectory plot, defining the starting point for each cell as the x/y origin (Fig. 7F–H). In all conditions, migration of OPCs was random, or nondirectional (p > 0.05, Rayleigh test for uniformity), indicating that although AMPA increases the rate of OPC migration, it is neither attractive nor repulsive to OPCs in vitro.
AMPA-induced internalization of GluR2 is disrupted in the absence of PLP
AMPA stimulation increases calcium signaling in wild-type OPCs (Fig. 3; Gudz et al., 2006). As GluR2 renders the AMPA receptor less permeable to calcium, we hypothesized that PLP may assist in the internalization of GluR2 after AMPA stimulation. We first examined the expression of AMPA receptor subunits in WT and PLP null OPCs derived from oligospheres (Fig. 8A). GluR1 was not detected. GluR2 and GluR3 were detected in both WT and PLP null OPCs. GluR4 was barely detectable in WT or PLP null OPCs. No significant difference was detected between WT and PLP null protein expression for any of the AMPA receptor subunits (quantification not shown). We then examined expression of GluR2 and GluR3 at the cell surface (Fig. 8B). GluR2 was present in the membrane fraction of WT OPCs, whereas GluR3 was only present in the internal fraction. Actin was used to verify the purity of the membrane fraction. To test effects of AMPA on GluR2 internalization, we plated OPCs derived from oligospheres on fibronectin (10 μg/ml) and treated them with 100 μm AMPA plus 60 μm cyclothiazide, to prevent AMPA receptor desensitization, for 0, 10, 20, 30, 40, or 60 min. The cell surface was then biotinylated, and membrane-bound proteins were separated from cytosolic proteins using Neutravidin beads (Thermo Fisher Scientific). Total, cell-surface (biotinylated), and internal (nonbiotinylated) fractions were analyzed by Western blot for GluR2 and GluR3. Densitometry of GluR2 bands in each of the cell fractions was measured, equalized to total protein, and normalized to baseline (t = 0) at each time point. A one-way ANOVA of the GluR2 values of each normalized cell fraction was conducted to compare the effect of AMPA stimulation over time on GluR2 internalization. In WT cells, the cell-surface GluR2 expression decreased significantly (p < 0.05), peaking at 20 min (p < 0.04), suggesting that GluR2 subunits are being internalized in response to AMPA (Fig. 8C). AMPA stimulation did not significantly change cell-surface expression of GluR2 in the PLP null cells at any time during the experiment (Fig. 8C). There was no significant change over time of GluR2 detection in the internal fraction of both WT and PLP null cells. This could suggest that GluR2 was being degraded after internalization or that the internal pool was so large that small changes were undetectable. We were unable to detect GluR3 in the cell-surface fraction of neither WT nor PLP null OPCs throughout the time course of AMPA treatment. To address the question of whether or not GluR3 was able to be biotinylated, we used cell-permeable biotin to label both the membrane and the cytoplasmic cell fractions and pulled down biotinylated protein with Neutravidin beads. We were able to detect GluR3 by Western blot (data not shown), indicating that GluR3 was capable of biotinylation, and, therefore, the inability to detect GluR3 on the cell surface was because it was not there. No significant changes in the normalized ratio of internal/total GluR3 bands were detected in WT or PLP null cells. We were unable to detect GluR4 in these experiments. The low GluR4 expression in these cells was most likely below the detectable limit in these lysates.
Discussion
We have previously shown that stimulation of neurotransmitter receptors (muscarinic acetylcholine receptors and ionotropic AMPA/kainate glutamate receptors) on rat OPCs in vitro triggers the formation of a complex that includes subunits of the neurotransmitter receptor, integrins, calcium-binding proteins, and, unexpectedly, the myelin PLP (Gudz et al., 2002, 2006). We found that complex formation in vitro is mediated by PLC and results in decreased binding to fibronectin, increased Ca2+ transients, and increased rate of cell movement (Gudz et al., 2002, 2006). Stimulation of glutamate receptors on cultured OPCs activates G-protein-coupled second-messenger systems, including PLC and inositol phosphates, as well as mitogen-activated protein kinase signaling and c-fos expression (Liu et al., 1997, 1999; Gudz et al., 2006). However, as these experiments were performed in cultured cells on artificial extracellular substrates, it remained to be seen if this complex forms in vivo and whether or not complex formation had an impact on OPC migration within the brain. Care must be taken when extrapolating from studies in cultured cells to in vivo function, as it is well established that receptor, transporter, and channel expression in cultured cells can be different from their expression in vivo (Tchélingérian et al., 1995; Snetkov et al., 1996; Genç et al., 2005; Kurejová et al., 2007). This is seen for many different types of cells, but it is particularly a concern for neurons and glial cells, and differences in glutamate receptor expression and subunit composition in oligodendrocytes in culture versus those in situ have been reported (Káradóttir and Attwell, 2007).
To study the OPC migration response to glutamate in a relatively intact microenvironment, we investigated the roles of PLP, αv integrin, and the GluR2 AMPA receptor subunit on OPC migratory responses to AMPA in organotypic cerebellar slices. As with cultured OPCs, we found that wild-type OPCs increased their rate of migration in slices after exposure to the glutamate agonist AMPA. We then looked at OPC responses to AMPA in cerebellar slices from mice null for PLP or GluR2, or heterozygous αv integrin mice. OPCs in mutant slices did not increase their migration in response to AMPA, indicating that the formation of the PLP–αv integrin–GluR2 complex is required for neurotransmitter-induced migration of OPCs. In chemotactic migration studies on cultured OPCs, AMPA treatment had no effect on the direction of migration, indicating that AMPA is neither attractive nor repulsive to OPCs. Interestingly, we found that PLP null OPCs migrated at a slower rate at baseline than wild-type OPCs in slices but faster than wild-type OPCs on purified fibronectin (Harlow et al., 2014). This could result from in vivo availability of other ECM substrates such as laminins, vitronectin, or tenascins that bind OPC integrins and alter migration rates. Further investigations of PLP null OPC migration on other substrates may explain these differences.
We also found that PLP exists in a complex with αv integrin and GluR2 in vivo, presumably in OPCs, and that in the absence of PLP, the association between αv integrin and GluR2 was disrupted in the cerebellum of PLP null mice (Fig. 4D). The inability of PLP null OPCs and oligodendrocytes to respond normally to glutamate released by axons may contribute to the axonal phenotypes seen in PLP null mice (Klugmann et al., 1997; Griffiths et al., 1998; Rosenbluth et al., 2006). PLP null mice have an accumulation of axonal spheroids and eventually axonal degeneration, indicating that PLP null oligodendrocytes fail to fully support the axons they ensheath. This suggests that oligodendrocytes transfer, either by secreted or vesicular packaging, essential molecules to neurons that support their continued survival and normal functioning. It could be that in the absence of PLP, oligodendrocytes are unable to properly react to varying levels of glutamate in the axoglial cleft and, therefore, fail to respond with appropriate trophic support.
Although in wild-type OPCs AMPA stimulation reduced cell-surface expression of GluR2, increased intracellular Ca2+ signaling, and increased OPC migration, we did not see altered Ca2+ signaling or migration in response to AMPA in GluR2−/− OPCs. One might predict, based on studies on neurons, that AMPA receptors lacking GluR2 would be more permeable to Ca2+ (Iihara et al., 2001), so that after AMPA stimulation, there would be an increase in Ca2+ signaling and perhaps an increase in OPC migration in GluR2−/− OPCs. Unexpectedly, however, the numbers of Ca2+ transients in GluR2−/− OPCs were reduced at baseline, indicating that these cells had reduced Ca2+ signaling even in the absence of AMPA. In this global GluR2 null mouse, altered Ca2+ signaling in other cell types in the slices (i.e., neurons) may influence OPCs, complicating the analysis.
It is important to note that both the reduced expression of GluR2 at the cell surface and the increase in intracellular Ca2+ were transient events, both peaking at about 20 min before returning to near baseline levels. This is likely a protective effect as prolonged Ca2+ influx would be cytotoxic to OPCs and result in cell death (Itoh et al., 2002; Deng et al., 2006).
Structurally, PLP shares similarity with the tetraspanin protein family. Tetraspanins function to organize the plasma membrane into tetraspanin-enriched microdomains that, through biochemical interactions, regulate the spatial organization of other transmembrane proteins, including integrins and growth factor receptors, to coordinate various downstream signaling pathways (Bassani and Cingolani, 2012). In addition, many tetraspanins also associate with intracellular signaling molecules, such as phosphatidylinositol kinases and PKC (Hemler, 2005). PLP may act like a tetraspanin in migrating OPCs by connecting transmembrane proteins (neurotransmitter receptors) and cell adhesion molecules (integrins) to cytoplasmic proteins to bring intercellular and intracellular signaling molecules in close proximity, thus organizing biochemical pathways so that OPC migration is enhanced in response to glutamate. In hippocampal neurons, β3 integrin can regulate AMPA receptor subunit composition through endocytosis of the GluR2 subunit (Cingolani et al., 2008). In OPCs, the proteoglycan NG2 has also been shown to complex with GluR2 via glutamate receptor-interacting protein (Stegmüller et al., 2003). Our data also suggest that the increased association of GluR2 in the complex with αv integrin and PLP serves to alter the subunit composition of the AMPA receptor by reducing levels of GluR2 at the surface, which increases calcium permeability and enhances OPC responses to AMPA (Fig. 9).
Figure 9.

Model of signaling complex formation. A, In wild-type OPCs, activation of AMPA receptors leads to the formation of a complex containing PLP–αv integrin and GluR2. After complex formation, there is increased internalization of GluR2, increased intracellular calcium signaling, and reduced fibronectin binding, which leads to increased OPC migration. B, In the absence of PLP, the PLP–αv integrin–GluR2 complex fails to form, and OPCs do not accelerate in response to AMPA receptor stimulation. C, Summary of events after AMPA receptor activation in wild-type cells.
Why would OPCs respond to glutamate with increased migration? Presumably, as axons develop, they release neurotransmitters, which may provide signals that enhance movement of OPCs to the appropriate location, leading to their eventual myelination. Additionally, OPCs persist in the adult brain, and in response to injury, adult OPCs can rapidly proliferate, migrate into demyelinated regions, and contribute to spontaneous remyelination (Shi et al., 1998; Fancy et al., 2004; Cheng et al., 2007). It could be that in response to demyelination and the presence of glutamate in the extracellular space, OPCs that increased their migration would be able to populate areas of demyelination more quickly, before significant expression of the nonpermissive cues for OPC migration, differentiation, and myelination, such as astrogliosis, aberrant deposition of extracellular matrix proteins, and increased expression of inhibitory guidance cues (for review, see Lau et al., 2013; Harlow and Macklin, 2014).
Investigations of the impact of neurotransmitter signaling on oligodendrocytes raise the important question of the physiological role(s) of neurotransmitter receptors in oligodendrocyte development and myelination. During development, OPCs receive synaptic inputs from excitatory hippocampal neurons, which can stimulate Ca2+ currents in OPCs via AMPA receptors (Bergles et al., 2000; De Biase et al., 2010; Etxeberria et al., 2010; Fröhlich et al., 2011; Yang et al., 2013). These synapses could couple axonal activity with internal calcium levels in OPCs, and neurons could thereby regulate the proliferation, migration, or differentiation of OPCs via glutamate release and AMPA receptor signaling. This regulation ceases after OPCs establish contact with axons and begin myelination, since the synaptic inputs from excitatory neurons are lost as the cells mature into oligodendrocytes (Bergles et al., 2000; Paukert and Bergles, 2006; De Biase et al., 2010; Fröhlich et al., 2011; Sakry et al., 2011; Yang et al., 2013).
It must be noted that there is also a pathological impact of neurotransmitter receptor activation leading to neurotransmitter-induced excitotoxicity, oligodendrocyte cell death, and white matter injury (Micu et al., 2006; Ouardouz et al., 2006; Matute, 2007). The responsiveness of OPCs to glutamate may regulate the degree of this pathology. During oligodendrocyte lineage progression, cells alter the subunit composition of their AMPA receptors, which in turn alters their Ca2+ conductance (Itoh et al., 2002; Brand-Schieber and Werner, 2003; Deng et al., 2006). Thus, OPCs and mature oligodendrocytes are differentially susceptible to high levels of glutamate. In very early migratory OPCs, GluR3/4 expression is low, and a high ratio of GluR2 to GluR3/4 in AMPA receptors would make OPCs less sensitive to the excitotoxic effects of glutamate (Itoh et al., 2002). In intermediate O4+ OPCs, GluR3/4 are transiently upregulated, and their assembly into AMPA receptors increases receptor calcium permeability, rendering premyelinating oligodendrocytes the most sensitive to excitotoxic damage and death (McDonald et al., 1998). As the cells mature, GluR3/4 expression decreases and the mature myelinating cells are resistant to glutamate-induced damage (Itoh et al., 2002; Brand-Schieber and Werner, 2003; Leuchtmann et al., 2003; Deng et al., 2006). Based on this expression pattern, glutamate in the microenvironment would not be expected to cause large calcium influxes or excitotoxicity in early migratory OPCs. Once intermediate OPCs near axons differentiate to premyelinating oligodendrocytes and increase the calcium permeability of their AMPA receptors, AMPA signaling could prevent their further proliferation and also halt their differentiation until the appropriate signals are in place to initiate OPC maturation. As mature oligodendrocytes ensheath axons, which are clearly potential sources of high levels of glutamate, their reduced expression of calcium-permeable subunits of AMPA receptors would make them more resistant to glutamate-induced toxicity. During ischemia, glutamate is released by both axons and oligodendrocytes through the reversal of glutamate transporters (Li et al., 1999; Fern and Möller, 2000), and abnormal glutamate homeostasis has been noted in the demyelinating disease multiple sclerosis (Matute et al., 2001; Stojanovic et al., 2014). Thus, understanding how OPCs respond to glutamate and other neurotransmitters has important implications for treatment after white matter injury and disease.
Footnotes
This work was supported by NIH Grant NS25304 (W.B.M.) and a National Multiple Sclerosis Society Postdoctoral fellowship (D.E.H.).The Nkx2.2 monoclonal antibody developed by Jessell and Brenner-Morton was obtained from the Developmental Studies Hybridoma Bank, which was established under the auspices of the NICHD and maintained by The University of Iowa, Department of Biology (Iowa City, IA).
The authors declare no competing financial interests.
References
- Ahlgren SC, Wallace H, Bishop J, Neophytou C, Raff MC. Effects of thyroid hormone on embryonic oligodendrocyte precursor cell development in vivo and in vitro. Mol Cell Neurosci. 1997;9:420–432. doi: 10.1006/mcne.1997.0631. [DOI] [PubMed] [Google Scholar]
- Bader BL, Rayburn H, Crowley D, Hynes RO. Extensive vasculogenesis, angiogenesis, and organogenesis precede lethality in mice lacking all alpha v integrins. Cell. 1998;95:507–519. doi: 10.1016/S0092-8674(00)81618-9. [DOI] [PubMed] [Google Scholar]
- Bagayogo IP, Dreyfus CF. Regulated release of BDNF by cortical oligodendrocytes is mediated through metabotropic glutamate receptors and the PLC pathway. ASN Neuro. 2009;1:e00001. doi: 10.1042/AN20090006. pii. [DOI] [PMC free article] [PubMed] [Google Scholar]
- Barres BA, Lazar MA, Raff MC. A novel role for thyroid hormone, glucocorticoids and retinoic acid in timing oligodendrocyte development. Development. 1994;120:1097–1108. doi: 10.1242/dev.120.5.1097. [DOI] [PubMed] [Google Scholar]
- Bassani S, Cingolani LA. Tetraspanins: interactions and interplay with integrins. Int J Biochem Cell Biol. 2012;44:703–708. doi: 10.1016/j.biocel.2012.01.020. [DOI] [PubMed] [Google Scholar]
- Behar TN, Scott CA, Greene CL, Wen X, Smith SV, Maric D, Liu QY, Colton CA, Barker JL. Glutamate acting at NMDA receptors stimulates embryonic cortical neuronal migration. J Neurosci. 1999;19:4449–4461. doi: 10.1523/JNEUROSCI.19-11-04449.1999. [DOI] [PMC free article] [PubMed] [Google Scholar]
- Bercury KK, Dai J, Sachs HH, Ahrendsen JT, Wood TL, Macklin WB. Conditional ablation of raptor or rictor has differential impact on oligodendrocyte differentiation and CNS myelination. J Neurosci. 2014;34:4466–4480. doi: 10.1523/JNEUROSCI.4314-13.2014. [DOI] [PMC free article] [PubMed] [Google Scholar]
- Bergles DE, Roberts JD, Somogyi P, Jahr CE. Glutamatergic synapses on oligodendrocyte precursor cells in the hippocampus. Nature. 2000;405:187–191. doi: 10.1038/35012083. [DOI] [PubMed] [Google Scholar]
- Bjartmar C, Trapp BD. Axonal and neuronal degeneration in multiple sclerosis: mechanisms and functional consequences. Curr Opin Neurol. 2001;14:271–278. doi: 10.1097/00019052-200106000-00003. [DOI] [PubMed] [Google Scholar]
- Blakemore WF. Regeneration and repair in multiple sclerosis: the view of experimental pathology. J Neurol Sci. 2008;265:1–4. doi: 10.1016/j.jns.2007.03.006. [DOI] [PubMed] [Google Scholar]
- Bolsover S, Ibrahim O, O'luanaigh N, Williams H, Cockcroft S. Use of fluorescent Ca2+ dyes with green fluorescent protein and its variants: problems and solutions. Biochem J. 2001;356:345–352. doi: 10.1042/0264-6021:3560345. [DOI] [PMC free article] [PubMed] [Google Scholar]
- Bradbury EJ, Moon LD, Popat RJ, King VR, Bennett GS, Patel PN, Fawcett JW, McMahon SB. Chondroitinase ABC promotes functional recovery after spinal cord injury. Nature. 2002;416:636–640. doi: 10.1038/416636a. [DOI] [PubMed] [Google Scholar]
- Brand-Schieber E, Werner P. AMPA/kainate receptors in mouse spinal cord cell-specific display of receptor subunits by oligodendrocytes and astrocytes and at the nodes of Ranvier. Glia. 2003;42:12–24. doi: 10.1002/glia.10136. [DOI] [PubMed] [Google Scholar]
- Cambron M, D'Haeseleer M, Laureys G, Clinckers R, Debruyne J, De Keyser J. White-matter astrocytes, axonal energy metabolism, and axonal degeneration in multiple sclerosis. J Cereb Blood Flow Metab. 2012;32:413–424. doi: 10.1038/jcbfm.2011.193. [DOI] [PMC free article] [PubMed] [Google Scholar]
- Cheng X, Wang Y, He Q, Qiu M, Whittemore SR, Cao Q. Bone morphogenetic protein signaling and olig1/2 interact to regulate the differentiation and maturation of adult oligodendrocyte precursor cells. Stem Cells. 2007;25:3204–3214. doi: 10.1634/stemcells.2007-0284. [DOI] [PMC free article] [PubMed] [Google Scholar]
- Cingolani LA, Thalhammer A, Yu LM, Catalano M, Ramos T, Colicos MA, Goda Y. Activity-dependent regulation of synaptic AMPA receptor composition and abundance by beta3 integrins. Neuron. 2008;58:749–762. doi: 10.1016/j.neuron.2008.04.011. [DOI] [PMC free article] [PubMed] [Google Scholar]
- Curtis R, Cohen J, Fok-Seang J, Hanley MR, Gregson NA, Reynolds R, Wilkin GP. Development of macroglial cells in rat cerebellum. I. Use of antibodies to follow early in vivo development and migration of oligodendrocytes. J Neurocytol. 1988;17:43–54. doi: 10.1007/BF01735376. [DOI] [PubMed] [Google Scholar]
- Dai J, Bercury KK, Macklin WB. Interaction of mTOR and Erk1/2 signaling to regulate oligodendrocyte differentiation. Glia. 2014;62:2096–2109. doi: 10.1002/glia.22729. [DOI] [PMC free article] [PubMed] [Google Scholar]
- De Biase LM, Nishiyama A, Bergles DE. Excitability and synaptic communication within the oligodendrocyte lineage. J Neurosci. 2010;30:3600–3611. doi: 10.1523/JNEUROSCI.6000-09.2010. [DOI] [PMC free article] [PubMed] [Google Scholar]
- Deng W, Rosenberg PA, Volpe JJ, Jensen FE. Calcium-permeable AMPA/kainate receptors mediate toxicity and preconditioning by oxygen-glucose deprivation in oligodendrocyte precursors. Proc Natl Acad Sci U S A. 2003;100:6801–6806. doi: 10.1073/pnas.1136624100. [DOI] [PMC free article] [PubMed] [Google Scholar]
- Deng W, Wang H, Rosenberg PA, Volpe JJ, Jensen FE. Role of metabotropic glutamate receptors in oligodendrocyte excitotoxicity and oxidative stress. Proc Natl Acad Sci U S A. 2004;101:7751–7756. doi: 10.1073/pnas.0307850101. [DOI] [PMC free article] [PubMed] [Google Scholar]
- Deng W, Neve RL, Rosenberg PA, Volpe JJ, Jensen FE. Alpha-amino-3-hydroxy-5-methyl-4-isoxazole propionate receptor subunit composition and cAMP-response element-binding protein regulate oligodendrocyte excitotoxicity. J Biol Chem. 2006;281:36004–36011. doi: 10.1074/jbc.M606459200. [DOI] [PubMed] [Google Scholar]
- Deshmukh VA, Tardif V, Lyssiotis CA, Green CC, Kerman B, Kim HJ, Padmanabhan K, Swoboda JG, Ahmad I, Kondo T, Gage FH, Theofilopoulos AN, Lawson BR, Schultz PG, Lairson LL. A regenerative approach to the treatment of multiple sclerosis. Nature. 2013;502:327–332. doi: 10.1038/nature12647. [DOI] [PMC free article] [PubMed] [Google Scholar]
- Ding X, Yan Y, Li X, Li K, Ciric B, Yang J, Zhang Y, Wu S, Xu H, Chen W, Lovett-Racke AE, Zhang GX, Rostami A. Silencing IFN-γ binding/signaling in astrocytes versus microglia leads to opposite effects on central nervous system autoimmunity. J Immunol. 2015;194:4251–4264. doi: 10.4049/jimmunol.1303321. [DOI] [PMC free article] [PubMed] [Google Scholar]
- Etxeberria A, Mangin JM, Aguirre A, Gallo V. Adult-born SVZ progenitors receive transient synapses during remyelination in corpus callosum. Nat Neurosci. 2010;13:287–289. doi: 10.1038/nn.2500. [DOI] [PMC free article] [PubMed] [Google Scholar]
- Fancy SP, Zhao C, Franklin RJ. Increased expression of Nkx2.2 and Olig2 identifies reactive oligodendrocyte progenitor cells responding to demyelination in the adult CNS. Mol Cell Neurosci. 2004;27:247–254. doi: 10.1016/j.mcn.2004.06.015. [DOI] [PubMed] [Google Scholar]
- Fern R, Möller T. Rapid ischemic cell death in immature oligodendrocytes: a fatal glutamate release feedback loop. J Neurosci. 2000;20:34–42. doi: 10.1523/JNEUROSCI.20-01-00034.2000. [DOI] [PMC free article] [PubMed] [Google Scholar]
- Flores AI, Narayanan SP, Morse EN, Shick HE, Yin X, Kidd G, Avila RL, Kirschner DA, Macklin WB. Constitutively active Akt induces enhanced myelination in the CNS. J Neurosci. 2008;28:7174–7183. doi: 10.1523/JNEUROSCI.0150-08.2008. [DOI] [PMC free article] [PubMed] [Google Scholar]
- Fröhlich N, Nagy B, Hovhannisyan A, Kukley M. Fate of neuron-glia synapses during proliferation and differentiation of NG2 cells. J Anat. 2011;219:18–32. doi: 10.1111/j.1469-7580.2011.01392.x. [DOI] [PMC free article] [PubMed] [Google Scholar]
- Frühbeis C, Fröhlich D, Kuo WP, Amphornrat J, Thilemann S, Saab AS, Kirchhoff F, Möbius W, Goebbels S, Nave KA, Schneider A, Simons M, Klugmann M, Trotter J, Krämer-Albers EM. Neurotransmitter-triggered transfer of exosomes mediates oligodendrocyte-neuron communication. PLoS Biol. 2013;11:e1001604. doi: 10.1371/journal.pbio.1001604. [DOI] [PMC free article] [PubMed] [Google Scholar]
- Fu H, Qi Y, Tan M, Cai J, Takebayashi H, Nakafuku M, Richardson W, Qiu M. Dual origin of spinal oligodendrocyte progenitors and evidence for the cooperative role of Olig2 and Nkx2.2 in the control of oligodendrocyte differentiation. Development. 2002;129:681–693. doi: 10.1242/dev.129.3.681. [DOI] [PubMed] [Google Scholar]
- Fünfschilling U, Supplie LM, Mahad D, Boretius S, Saab AS, Edgar JM, Brinkmann BG, Kassmann CM, Tzvetanova ID, Möbius W, Diaz F, Meijer D, Suter U, Hamprecht B, Sereda MW, Moraes CT, Frahm J, Goebbels S, Nave K-AA. Glycolytic oligodendrocytes maintain myelin and long-term axonal integrity. Nature. 2012;485:517–521. doi: 10.1038/nature11007. [DOI] [PMC free article] [PubMed] [Google Scholar]
- Fyffe-Maricich SL, Karlo JC, Landreth GE, Miller RH. The ERK2 mitogen-activated protein kinase regulates the timing of oligodendrocyte differentiation. J Neurosci. 2011;31:843–850. doi: 10.1523/JNEUROSCI.3239-10.2011. [DOI] [PMC free article] [PubMed] [Google Scholar]
- Fyffe-Maricich SL, Schott A, Karl M, Krasno J, Miller RH. Signaling through ERK1/2 controls myelin thickness during myelin repair in the adult central nervous system. J Neurosci. 2013;33:18402–18408. doi: 10.1523/JNEUROSCI.2381-13.2013. [DOI] [PMC free article] [PubMed] [Google Scholar]
- Gallo V, Zhou JM, McBain CJ, Wright P, Knutson PL, Armstrong RC. Oligodendrocyte progenitor cell proliferation and lineage progression are regulated by glutamate receptor-mediated K+ channel block. J Neurosci. 1996;16:2659–2670. doi: 10.1523/JNEUROSCI.16-08-02659.1996. [DOI] [PMC free article] [PubMed] [Google Scholar]
- Genç B, Ulupinar E, Erzurumlu RS. Differential Trk expression in explant and dissociated trigeminal ganglion cell cultures. J Neurobiol. 2005;64:145–156. doi: 10.1002/neu.20134. [DOI] [PMC free article] [PubMed] [Google Scholar]
- Griffiths I, Klugmann M, Anderson T, Thomson C, Vouyiouklis D, Nave KA. Current concepts of PLP and its role in the nervous system. Microsc Res Tech. 1998;41:344–358. doi: 10.1002/(SICI)1097-0029(19980601)41:5<344::AID-JEMT2>3.0.CO;2-Q. [DOI] [PubMed] [Google Scholar]
- Gudz TI, Schneider TE, Haas TA, Macklin WB. Myelin proteolipid protein forms a complex with integrins and may participate in integrin receptor signaling in oligodendrocytes. J Neurosci. 2002;22:7398–7407. doi: 10.1523/JNEUROSCI.22-17-07398.2002. [DOI] [PMC free article] [PubMed] [Google Scholar]
- Gudz TI, Komuro H, Macklin WB. Glutamate stimulates oligodendrocyte progenitor migration mediated via an αv integrin/myelin proteolipid protein complex. J Neurosci. 2006;26:2458–2466. doi: 10.1523/JNEUROSCI.4054-05.2006. [DOI] [PMC free article] [PubMed] [Google Scholar]
- Harlow DE, Macklin WB. Inhibitors of myelination: ECM changes, CSPGs and PTPs. Exp Neurol. 2014;251:39–46. doi: 10.1016/j.expneurol.2013.10.017. [DOI] [PMC free article] [PubMed] [Google Scholar]
- Harlow DE, Saul KE, Culp CM, Vesely EM, Macklin WB. Expression of proteolipid protein gene in spinal cord stem cells and early oligodendrocyte progenitor cells is dispensable for normal cell migration and myelination. J Neurosci. 2014;34:1333–1343. doi: 10.1523/JNEUROSCI.2477-13.2014. [DOI] [PMC free article] [PubMed] [Google Scholar]
- Haydar TF, Wang F, Schwartz ML, Rakic P. Differential modulation of proliferation in the neocortical ventricular and subventricular zones. J Neurosci. 2000;20:5764–5774. doi: 10.1523/JNEUROSCI.20-15-05764.2000. [DOI] [PMC free article] [PubMed] [Google Scholar]
- Hemler ME. Tetraspanin functions and associated microdomains. Nat Rev Mol Cell Biol. 2005;6:801–811. doi: 10.1038/nrm1736. [DOI] [PubMed] [Google Scholar]
- Holtzclaw LA, Gallo V, Russell JT. AMPA receptors shape Ca2+ responses in cortical oligodendrocyte progenitors and CG-4 cells. J Neurosci Res. 1995;42:124–130. doi: 10.1002/jnr.490420114. [DOI] [PubMed] [Google Scholar]
- Hossain S, Liu HN, Fragoso G, Almazan G. Agonist-induced down-regulation of AMPA receptors in oligodendrocyte progenitors. Neuropharmacology. 2014;79:506–514. doi: 10.1016/j.neuropharm.2013.12.020. [DOI] [PubMed] [Google Scholar]
- Huang JK, Jarjour AA, Nait-Oumesmar B, Kerninon C, Williams A, Krezel W, Kagechika H, Bauer J, Zhao C, Baron-VanEvercooren A, Chambon P, ffrench-Constant C, Franklin RJM. Retinoid X receptor gamma signaling accelerates CNS remyelination. Nat Neurosci. 2011;14:45–53. doi: 10.1038/nn.2702. [DOI] [PMC free article] [PubMed] [Google Scholar]
- Iihara K, Joo DT, Henderson J, Sattler R, Taverna FA, Lourensen S, Orser BA, Roder JC, Tymianski M. The influence of glutamate receptor 2 expression on excitotoxicity in Glur2 null mutant mice. J Neurosci. 2001;21:2224–2239. doi: 10.1523/JNEUROSCI.21-07-02224.2001. [DOI] [PMC free article] [PubMed] [Google Scholar]
- Ishii A, Fyffe-Maricich SL, Furusho M, Miller RH, Bansal R. ERK1/ERK2 MAPK signaling is required to increase myelin thickness independent of oligodendrocyte differentiation and initiation of myelination. J Neurosci. 2012;32:8855–8864. doi: 10.1523/JNEUROSCI.0137-12.2012. [DOI] [PMC free article] [PubMed] [Google Scholar]
- Itoh T, Beesley J, Itoh A, Cohen AS, Kavanaugh B, Coulter DA, Grinspan JB, Pleasure D. AMPA glutamate receptor-mediated calcium signaling is transiently enhanced during development of oligodendrocytes. J Neurochem. 2002;81:390–402. doi: 10.1046/j.1471-4159.2002.00866.x. [DOI] [PubMed] [Google Scholar]
- Jansson LC, Akerman KE. The role of glutamate and its receptors in the proliferation, migration, differentiation and survival of neural progenitro cells. J Neural Transm. 2014;121:819–836. doi: 10.1007/s00702-014-1174-6. [DOI] [PubMed] [Google Scholar]
- Joshi DC, Zhang CL, Lin TM, Gusain A, Harris MG, Tree E, Yin Y, Wu C, Sheng ZH, Dempsey RJ, Fabry Z, Chiu SY. Deletion of mitochondrial anchoring protects dysmyelinating shiverer: implications for progressive MS. J Neurosci. 2015;35:5293–5306. doi: 10.1523/JNEUROSCI.3859-14.2015. [DOI] [PMC free article] [PubMed] [Google Scholar]
- Káradóttir R, Attwell D. Neurotransmitter receptors in the life and death of oligodendrocytes. Neuroscience. 2007;145:1426–1438. doi: 10.1016/j.neuroscience.2006.08.070. [DOI] [PMC free article] [PubMed] [Google Scholar]
- Káradóttir R, Cavelier P, Bergersen LH, Attwell D. NMDA receptors are expressed in oligodendrocytes and activated in ischaemia. Nature. 2005;438:1162–1166. doi: 10.1038/nature04302. [DOI] [PMC free article] [PubMed] [Google Scholar]
- Karimi-Abdolrezaee S, Schut D, Wang J, Fehlings MG. Chondroitinase and growth factors enhance activation and oligodendrocyte differentiation of endogenous neural precursor cells after spinal cord injury. PLoS One. 2012;7:e37589. doi: 10.1371/journal.pone.0037589. [DOI] [PMC free article] [PubMed] [Google Scholar]
- Kessaris N, Pringle N, Richardson WD. Specification of CNS glia from neural stem cells in the embryonic neuroepithelium. Philos Trans R Soc Lond B Biol Sci. 2008;363:71–85. doi: 10.1098/rstb.2006.2013. [DOI] [PMC free article] [PubMed] [Google Scholar]
- Kiryu-Seo S, Ohno N, Kidd GJ, Komuro H, Trapp BD. Demyelination increases axonal stationary mitochondrial size and the speed of axonal mitochondrial transport. J Neurosci. 2010;30:6658–6666. doi: 10.1523/JNEUROSCI.5265-09.2010. [DOI] [PMC free article] [PubMed] [Google Scholar]
- Klugmann M, Schwab MH, Pühlhofer A, Schneider A, Zimmermann F, Griffiths IR, Nave KA. Assembly of CNS myelin in the absence of proteolipid protein. Neuron. 1997;18:59–70. doi: 10.1016/S0896-6273(01)80046-5. [DOI] [PubMed] [Google Scholar]
- Kurejová M, Uhrík B, Sulová Z, Sedláková B, Krizanová O, Lacinová L. Changes in ultrastructure and endogenous ionic channels activity during culture of HEK 293 cell line. Eur J Pharmacol. 2007;567:10–18. doi: 10.1016/j.ejphar.2007.04.005. [DOI] [PubMed] [Google Scholar]
- Lau LW, Cua R, Keough MB, Haylock-Jacobs S, Yong VW. Pathophysiology of the brain extracellular matrix: a new target for remyelination. Nat Rev Neurosci. 2013;14:722–729. doi: 10.1038/nrn3550. [DOI] [PubMed] [Google Scholar]
- Lee Y, Morrison BM, Li Y, Lengacher S, Farah MH, Hoffman PN, Liu Y, Tsingalia A, Jin L, Zhang PW, Pellerin L, Magistretti PJ, Rothstein JD. Oligodendroglia metabolically support axons and contribute to neurodegeneration. Nature. 2012;487:443–448. doi: 10.1038/nature11314. [DOI] [PMC free article] [PubMed] [Google Scholar]
- Leuchtmann EA, Ratner AE, Vijitruth R, Qu Y, McDonald JW. AMPA receptors are the major mediators of excitotoxic death in mature oligodendrocytes. Neurobiol Dis. 2003;14:336–348. doi: 10.1016/j.nbd.2003.07.004. [DOI] [PubMed] [Google Scholar]
- Li S, Stys PK. Mechanisms of ionotropic glutamate receptor-mediated excitotoxicity in isolated spinal cord white matter. J Neurosci. 2000;20:1190–1198. doi: 10.1523/JNEUROSCI.20-03-01190.2000. [DOI] [PMC free article] [PubMed] [Google Scholar]
- Li S, Mealing GA, Morley P, Stys PK. Novel injury mechanism in anoxia and trauma of spinal cord white matter: glutamate release via reverse Na+-dependent glutamate transport. J Neurosci. 1999;19:RC16. doi: 10.1523/JNEUROSCI.19-14-j0002.1999. (1–9) [DOI] [PMC free article] [PubMed] [Google Scholar]
- Lin W, Lin Y, Li J, Fenstermaker AG, Way SW, Clayton B, Jamison S, Harding HP, Ron D, Popko B. Oligodendrocyte-specific activation of PERK signaling protects mice against experimental autoimmune encephalomyelitis. J Neurosci. 2013;33:5980–5991. doi: 10.1523/JNEUROSCI.1636-12.2013. [DOI] [PMC free article] [PubMed] [Google Scholar]
- Liu HN, Molina-Holgado E, Almazan G. Glutamate-stimulated production of inositol phosphates is mediated by Ca2+ influx in oligodendrocyte progenitors. Eur J Pharmacol. 1997;338:277–287. doi: 10.1016/S0014-2999(97)81931-0. [DOI] [PubMed] [Google Scholar]
- Liu HN, Larocca JN, Almazan G. Molecular pathways mediating activation by kainate of mitogen-activated protein kinase in oligodendrocyte progenitors. Mol Brain Res. 1999;66:50–61. doi: 10.1016/S0169-328X(99)00009-1. [DOI] [PubMed] [Google Scholar]
- Mallon BS, Shick HE, Kidd GJ, Macklin WB. Proteolipid promoter activity distinguishes two populations of NG2-positive cells throughout neonatal cortical development. J Neurosci. 2002;22:876–885. doi: 10.1523/JNEUROSCI.22-03-00876.2002. [DOI] [PMC free article] [PubMed] [Google Scholar]
- Matute C. Interaction between glutamate signalling and immune attack in damaging oligodendrocytes. Neuron Glia Biol. 2007;3:281–285. doi: 10.1017/S1740925X08000033. [DOI] [PubMed] [Google Scholar]
- Matute C, Alberdi E, Domercq M, Pérez-Cerdá F, Pérez-Samartín A, Sánchez-Gómez MV. The link between excitotoxic oligodendroglial death and demyelinating diseases. Trends Neurosci. 2001;24:224–230. doi: 10.1016/S0166-2236(00)01746-X. [DOI] [PubMed] [Google Scholar]
- McDonald JW, Levine JM, Qu Y. Multiple classes of the oligodendrocyte lineage are highly vulnerable to excitotoxicity. Neuroreport. 1998;9:2757–2762. doi: 10.1097/00001756-199808240-00014. [DOI] [PubMed] [Google Scholar]
- McMahon SS, McDermott KW. Proliferation and migration of glial precursor cells in the developing rat spinal cord. J Neurocytol. 2001;30:821–828. doi: 10.1023/a:1019693421778. [DOI] [PubMed] [Google Scholar]
- Mei F, Fancy SP, Shen YA, Niu J, Zhao C, Presley B, Miao E, Lee S, Mayoral SR, Redmond SA, Etxeberria A, Xiao L, Franklin RJ, Green A, Hauser SL, Chan JR. Micropillar arrays as a high-throughput screening platform for therapeutics in multiple sclerosis. Nat Med. 2014;20:954–960. doi: 10.1038/nm.3618. [DOI] [PMC free article] [PubMed] [Google Scholar]
- Micu I, Jiang Q, Coderre E, Ridsdale A, Zhang L, Woulfe J, Yin X, Trapp BD, McRory JE, Rehak R, Zamponi GW, Wang W, Stys PK. NMDA receptors mediate calcium accumulation in myelin during chemical ischaemia. Nature. 2006;439:988–992. doi: 10.1038/nature04474. [DOI] [PubMed] [Google Scholar]
- Narayanan SP, Flores AI, Wang F, Macklin WB. Akt signals through the mammalian target of rapamycin pathway to regulate CNS myelination. J Neurosci. 2009;29:6860–6870. doi: 10.1523/JNEUROSCI.0232-09.2009. [DOI] [PMC free article] [PubMed] [Google Scholar]
- Ohno N, Chiang H, Mahad DJ, Kidd GJ, Liu L, Ransohoff RM, Sheng ZH, Komuro H, Trapp BD. Mitochondrial immobilization mediated by syntaphilin facilitates survival of demyelinated axons. Proc Natl Acad Sci U S A. 2014;111:9953–9958. doi: 10.1073/pnas.1401155111. [DOI] [PMC free article] [PubMed] [Google Scholar]
- O'Meara RW, Ryan SD, Colognato H, Kothary R. Derivation of enriched oligodendrocyte cultures and oligodendrocyte/neuron myelinating co-cultures from post-natal murine tissues. J Vis Exp. 2011;pii:3324. doi: 10.3791/3324. [DOI] [PMC free article] [PubMed] [Google Scholar]
- Ouardouz M, Malek S, Coderre E, Stys PK. Complex interplay between glutamate receptors and intracellular Ca2+ stores during ischaemia in rat spinal cord white matter. J Physiol. 2006;577:191–204. doi: 10.1113/jphysiol.2006.116798. [DOI] [PMC free article] [PubMed] [Google Scholar]
- Paez PM, Fulton DJ, Spreur V, Handley V, Campagnoni AT. Multiple kinase pathways regulate voltage-dependent Ca2+ influx and migration in oligodendrocyte precursor cells. J Neurosci. 2010;30:6422–6433. doi: 10.1523/JNEUROSCI.5086-09.2010. [DOI] [PMC free article] [PubMed] [Google Scholar]
- Paukert M, Bergles DE. Synaptic communication between neurons and NG2+ cells. Curr Opin Neurobiol. 2006;16:515–521. doi: 10.1016/j.conb.2006.08.009. [DOI] [PubMed] [Google Scholar]
- Pedraza CE, Monk R, Lei J, Hao Q, Macklin WB. Production, characterization, and efficient transfection of highly pure oligodendrocyte precursor cultures from mouse embryonic neural progenitors. Glia. 2008;56:1339–1352. doi: 10.1002/glia.20702. [DOI] [PMC free article] [PubMed] [Google Scholar]
- Pende M, Holtzclaw LA, Curtis JL, Russell JT, Gallo V. Glutamate regulates intracellular calcium and gene expression in oligodendrocyte progenitors through the activation of DL-alpha-amino-3-hydroxy-5-methyl-4-isoxazolepropionic acid receptors. Proc Natl Acad Sci U S A. 1994;91:3215–3219. doi: 10.1073/pnas.91.8.3215. [DOI] [PMC free article] [PubMed] [Google Scholar]
- Platel JC, Lacar B, Bordey A. GABA and glutamate signaling: homeostatic control of adult forebrain neurogenesis. J Mol Histol. 2007;38:303–311. doi: 10.1007/s10735-007-9103-8. [DOI] [PMC free article] [PubMed] [Google Scholar]
- Qi Y, Cai J, Wu Y, Wu R, Lee J, Fu H, Rao M, Sussel L, Rubenstein J, Qiu M. Control of oligodendrocyte differentiation by the Nkx2.2 homeodomain transcription factor. Development. 2001;128:2723–2733. doi: 10.1242/dev.128.14.2723. [DOI] [PubMed] [Google Scholar]
- Rakic P, Komuro H. The role of receptor/channel activity in neuronal cell migration. J Neurobiol. 1995;26:299–315. doi: 10.1002/neu.480260303. [DOI] [PubMed] [Google Scholar]
- Reynolds R, Wilkin GP. Development of macroglial cells in rat cerebellum. II. An in situ immunohistochemical study of oligodendroglial lineage from precursor to mature myelinating cell. Development. 1988;102:409–425. doi: 10.1242/dev.102.2.409. [DOI] [PubMed] [Google Scholar]
- Rosenbluth J, Nave KA, Mierzwa A, Schiff R. Subtle myelin defects in PLP-null mice. Glia. 2006;54:172–182. doi: 10.1002/glia.20370. [DOI] [PubMed] [Google Scholar]
- Sakry D, Karram K, Trotter J. Synapses between NG2 glia and neurons. J Anat. 2011;219:2–7. doi: 10.1111/j.1469-7580.2011.01359.x. [DOI] [PMC free article] [PubMed] [Google Scholar]
- Salter MG, Fern R. NMDA receptors are expressed in developing oligodendrocyte processes and mediate injury. Nature. 2005;438:1167–1171. doi: 10.1038/nature04301. [DOI] [PubMed] [Google Scholar]
- Setzu A, Lathia JD, Zhao C, Wells K, Rao MS, ffrench-Constant C, Franklin RJ. Inflammation stimulates myelination by transplanted oligodendrocyte precursor cells. Glia. 2006;54:297–303. doi: 10.1002/glia.20371. [DOI] [PubMed] [Google Scholar]
- Shi J, Marinovich A, Barres BA. Purification and characterization of adult oligodendrocyte precursor cells from the rat optic nerve. J Neurosci. 1998;18:4627–4636. doi: 10.1523/JNEUROSCI.18-12-04627.1998. [DOI] [PMC free article] [PubMed] [Google Scholar]
- Snetkov VA, Hirst SJ, Ward JP. Ion channels in freshly isolated and cultured human bronchial smooth muscle cells. Exp Physiol. 1996;81:791–804. doi: 10.1113/expphysiol.1996.sp003977. [DOI] [PubMed] [Google Scholar]
- Starkey ML, Bartus K, Barritt AW, Bradbury EJ. Chondroitinase ABC promotes compensatory sprouting of the intact corticospinal tract and recovery of forelimb function following unilateral pyramidotomy in adult mice. Eur J Neurosci. 2012;36:3665–3678. doi: 10.1111/ejn.12017. [DOI] [PMC free article] [PubMed] [Google Scholar]
- Stegmüller J, Werner H, Nave KA, Trotter J. The proteoglycan NG2 is complexed with alpha-amino-3-hydroxy-5-methyl-4-isoxazolepropionic acid (AMPA) receptors by the PDZ glutamate receptor interaction protein (GRIP) in glial progenitor cells. Implications for glial-neuronal signaling. J Biol Chem. 2003;278:3590–3598. doi: 10.1074/jbc.M210010200. [DOI] [PubMed] [Google Scholar]
- Stidworthy MF, Genoud S, Li WW, Leone DP, Mantei N, Suter U, Franklin RJ. Notch1 and Jagged1 are expressed after CNS demyelination, but are not a major rate-determining factor during remyelination. Brain. 2004;127:1928–1941. doi: 10.1093/brain/awh217. [DOI] [PubMed] [Google Scholar]
- Stojanovic IR, Kostic M, Ljubisavljevic S. The role of glutamate and its receptors in multiple sclerosis. J Neural Transm. 2014;121:945–955. doi: 10.1007/s00702-014-1188-0. [DOI] [PubMed] [Google Scholar]
- Suzuki SO, Goldman JE. Multiple cell populations in the early postnatal subventricular zone take distinct migratory pathways: a dynamic study of glial and neuronal progenitor migration. J Neurosci. 2003;23:4240–4250. doi: 10.1523/JNEUROSCI.23-10-04240.2003. [DOI] [PMC free article] [PubMed] [Google Scholar]
- Tchélingérian JL, Monge M, Le Saux F, Zalc B, Jacque C. Differential oligodendroglial expression of the tumor necrosis factor receptors in vivo and in vitro. J Neurochem. 1995;65:2377–2380. doi: 10.1046/j.1471-4159.1995.65052377.x. [DOI] [PubMed] [Google Scholar]
- Tyler WA, Gangoli N, Gokina P, Kim HA, Covey M, Levison SW, Wood TL. Activation of the mammalian target of rapamycin (mTOR) is essential for oligodendrocyte differentiation. J Neurosci. 2009;29:6367–6378. doi: 10.1523/JNEUROSCI.0234-09.2009. [DOI] [PMC free article] [PubMed] [Google Scholar]
- Wahl SE, McLane LE, Bercury KK, Macklin WB, Wood TL. Mammalian target of rapamycin promotes oligodendrocyte differentiation, initiation and extent of CNS myelination. J Neurosci. 2014;34:4453–4465. doi: 10.1523/JNEUROSCI.4311-13.2014. [DOI] [PMC free article] [PubMed] [Google Scholar]
- Yang QK, Xiong JX, Yao ZX. Neuron-NG2 cell synapses: novel functions for regulating NG2 cell proliferation and differentiation. Biomed Res Int. 2013;2013:402843. doi: 10.1155/2013/402843. [DOI] [PMC free article] [PubMed] [Google Scholar]
- Yuan X, Eisen AM, McBain CJ, Gallo V. A role for glutamate and its receptors in the regulation of oligodendrocyte development in cerebellar tissue slices. Development. 1998;125:2901–2914. doi: 10.1242/dev.125.15.2901. [DOI] [PubMed] [Google Scholar]
- Zambonin JL, Zhao C, Ohno N, Campbell GR, Engeham S, Ziabreva I, Schwarz N, Lee SE, Frischer JM, Turnbull DM, Trapp BD, Lassmann H, Franklin RJ, Mahad DJ. Increased mitochondrial content in remyelinated axons: implications for multiple sclerosis. Brain. 2011;134:1901–1913. doi: 10.1093/brain/awr110. [DOI] [PMC free article] [PubMed] [Google Scholar]
- Zhang Y, Argaw AT, Gurfein BT, Zameer A, Snyder BJ, Ge C, Lu QR, Rowitch DH, Raine CS, Brosnan CF, John GR. Notch1 signaling plays a role in regulating precursor differentiation during CNS remyelination. Proc Natl Acad Sci U S A. 2009;106:19162–19167. doi: 10.1073/pnas.0902834106. [DOI] [PMC free article] [PubMed] [Google Scholar]