Abstract
The tensile strength of ordinary water such as tap water or seawater is typically well below 1 bar. It is governed by cavitation nuclei in the water, not by the tensile strength of the water itself, which is extremely high. Different models of the nuclei have been suggested over the years, and experimental investigations of bubbles and cavitation inception have been presented. These results suggest that cavitation nuclei in equilibrium are gaseous voids in the water, stabilized by a skin which allows diffusion balance between gas inside the void and gas in solution in the surrounding liquid. The cavitation nuclei may be free gas bubbles in the bulk of water, or interfacial gaseous voids located on the surface of particles in the water, or on bounding walls. The tensile strength of these nuclei depends not only on the water quality but also on the pressure–time history of the water. A recent model and associated experiments throw new light on the effects of transient pressures on the tensile strength of water, which may be notably reduced or increased by such pressure changes.
Keywords: cavitation, cavitation nuclei, tensile strength, surface nanobubbles
1. Classical models of cavitation nuclei
The tensile strength of plain water is governed by cavitation nuclei. They are usually modelled as spherical gas bubbles present in the bulk of water, and the tensile strength of such bubbles was determined by Blake [1] as the limit of the quasi-static stable balance of the far-field pressure and the Laplace pressure with the gas and vapour pressures inside the bubble. However, a basic problem for the existence of a free gas bubble in water is that, because of diffusion of gas, it is inherently unstable—either gas dissolved in the water diffuses into the bubble, and by buoyancy it drifts to the upper boundary of the volume of water, or the bubble shrinks at an increasing rate by diffusion of gas from the bubble into the water because surface tension raises the pressure inside the bubble and it dissolves [2]. Thus, a stabilizing mechanism is required for a gas bubble to survive in water saturated with gas at the prevailing pressure.
Cavitation bubbles typically develop at water–solid interfaces [3], and to obtain stability of an interfacial cavitation nucleus Harvey et al. [4] modelled it as a gaseous void located at the bottom of a hydrophobic conical crevice in the surface of the submerged solid surface. The gas–water interface of the void was assumed to be attached to the sidewalls of the crevice at the proper hydrophobic contact angle, and at a position that satisfied gas diffusion balance across the bubble surface. This model allowed a residual gaseous void to be preserved also during moderate pressurization of the water, thereby explaining that gaseous nuclei could survive in water. However, pressure increase up to 1090 bar for 15–30 min forced gas micro-nuclei into solution and raised the boiling point to at least 202°C, i.e. its tensile strength was increased to at least 15 bar. Similar results were obtained by Knapp [5], who found the tensile strength to increase at pressurization up to approximately 350 bar—and it was preserved after as much as 19 days. Likewise, Strasberg [6] found that static pre-pressurization up to a few bar increased the tensile strength by about 4 bar per bar of pressurization, while, at a subsequent pressure decrease, the tensile strength went down by only as much as the pressure reduction, the testing being made ultrasonically. The crevice model has received much attention and has been developed notably in [7,8]. However, though most surfaces have an irregular shape on a micrometre level [9], hydrophobic surfaces with crevices are not characteristic of solid surfaces generally. An alternative model of bubble stabilization was suggested by Fox & Herzfeld [10], who assumed that, during the shrinking of a free gas bubble, organic molecules form a complete skin on its surface, preventing further diffusion of gas from the bubble into the water.
The tensile strength of water is normally very low, but, ensuring scrupulous cleanliness in his experimental work and using pure distilled water of low gas content, Briggs [11] obtained a maximum tensile strength of 277 bar at 10°C. This suggests that actually contamination is the decisive factor for the tensile strength of water, and that cavitation nuclei are normally gaseous voids—free bubbles or interfacial voids—stabilized by a skin of alien components. Amphiphilic molecules are likely candidates [12,13].
2. Free gas bubbles
Decisive experiments with free bubbles were presented by Johnson & Cooke [14], who at atmospheric conditions studied the shrinking of gas bubbles produced in filtered seawater. They observed that some bubbles dissolved spontaneously, and at increasing speed as their radius diminished, as predicted by Epstein & Plesset [2], while other bubbles suddenly stopped their shrinking and were stabilized within a range of diameters from approximately 0.7 to 13.5 µm, the maximum of their number density being at 3–4 µm. However, over 22 h this maximum shifted towards the group of smallest size. From their photographs it is apparent that the stabilized bubbles were not perfectly spherical, but at pressure reduction they expanded and became spherical. Returning to atmospheric pressure, the bubbles were again stabilized, though with a slightly different non-spherical shape. With increasing pressure, the shape and size of the stabilized bubbles were increasingly affected, and eventually they collapsed, each leaving a particle made of skin (figure 1).
Figure 1.
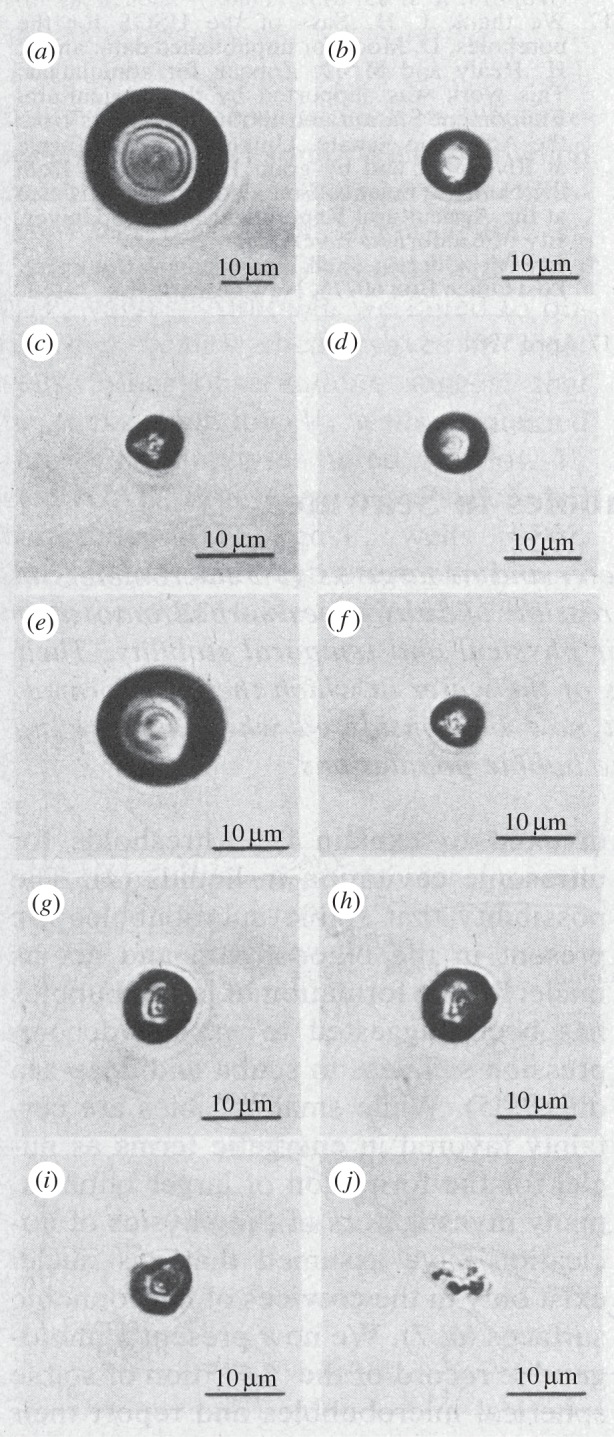
(a–c) A gas bubble in air-saturated seawater at 22°C and at atmospheric pressure, shrinking until stabilization; (d,e) the stable bubble (c) when exposed to increasing tensile stress and (f) when returning to a stable condition at atmospheric pressure. (g) A second gas bubble, stabilized at atmospheric pressure; (h) then pressurized at 0.28 m of water; (i) when pressurized at 0.69 m of water; and (j) at 0.83 m of water the bubble has collapsed into a particle. (Reproduced with permission from [14]. Copyright © American Association for the Advancement of Science.)
The fact that the stabilized bubbles were not spherical shows that they were in diffusion balance with the surrounding water at the prevailing pressure. This might be achieved by a skin of molecularly open structure, connecting planar water–gas interface elements, or the gas bubbles might be covered by an ampliphilic skin as suggested by Yount [12], who developed the variable permeability (VP) model for such a skin—the amphiphilic character and its permeability being decisive.
The skin left at the collapse of a stabilized gas bubble when pressurized beyond its stability limit might itself act as a cavitation nucleus, perhaps still harbouring some gas and having a tensile strength notably higher than the originally stabilized gas bubble.
The tensile strengths of the skin-stabilized bubbles observed by Johnson and Cooke can be calculated to cover a range of tensile strengths from 1.1 to 0.014 bar, i.e. values commonly found for plain water, by assuming diffusion balance across the skin at stabilization and applying the Blake formulae [1] to these bubbles [15].
3. Interfacial nuclei
3.1. Solid–water interfaces
As observed by [3] cavitation bubbles grow from sites on solid–water interfaces such as bounding walls. However, because of the presence of particles inside the bulk of water, solid–water interfaces are usually also present here. These particles cover a wide spectrum of sizes and shapes [9] and they carry cavitation nuclei. A perfectly hydrophobic spherical particle of radius R would cause cavitation for (pv−p∞) > 2γ/R (where p∞ is the far-field pressure, pv is the vapour pressure and γ is the surface tension constant of the water). However, inter-atomic forces between the water molecules and the real solid surface cause a higher tensile strength than the one set up by surface tension forces at a vapour cavity alone. Actually, most solid surfaces are more or less hydrophilic, but interfacial gas molecules may cause weak spots, present as interfacial nanobubbles. In computer simulations, Xia et al. [16] showed that an ice-like interfacial water layer is created on a submerged Pt surface at 300 K, but outside the very first layer of water molecules the structure quickly shifts into that of bulk water. As expected, this is the case also for many common materials.
Keller [17] measured a maximum of tensile strength for unfiltered tap water at 10°C for different degrees of gas saturation and system pressures, while the tensile strength went down dramatically when the temperature approached 0°C (figure 2a). This was also what Briggs [11] had measured for highly purified water, though in Briggs' measurements the critical tensile stresses were about two orders of magnitude higher than in Keller's measurements (figure 2b). Thus, the temperature for achieving the maximum of tensile strength was not related to the highly different water qualities used in the two experimental cases, and Keller noted this characteristic feature of cavitation inception in his experimental work. Theoretically, and in experiments where solid walls are not included, the tensile strength of H2O does not show such a maximum at 10°C—it increases, or at least it remains high when the temperature approaches 0°C (figure 2c) [18]. This discrepancy calls for an explanation.
Figure 2.

(a) Measured tensile strength of tap water versus temperature by Keller [17] at system pressure P1 and degree of gas saturation ε. (Reproduced with permission from [17]. Copyright © Technical University München/Obernach, Germany.) (b) For highly purified water by Briggs [11]. (Reproduced with permission from [11]. Copyright © AIP Publishing LLC.) (c) Theoretical cavitation pressures (-TS): dotted line, thin wall approximation, solid line, density functional theory (Speedy), dashed line, TIP5P equation of state. (Reproduced with permission from [18]. Copyright © American Physical Society.)
The water molecule, H2O, is built from an oxygen atom and two hydrogen atoms, bonded by covalent O–H bonds of length 0.0958 nm and with a H–O–H angle of 104° 27′. The covalent bonds change the electron density distribution of the individual atoms and make the water molecule polar. Its electrical interaction with other water molecules can be described by a four-point model in which a positive charge +η · e is located at each of the hydrogen atoms, and a negative charge −η · e is located on each side of the H–O–H plane near to the oxygen atom, so that the four point charges form a tetrahedron. The van der Waals diameter of this molecule is 0.28 nm [19]. When two water molecules are brought into contact a hydrogen bond connects O− in one of the molecules to H+ in the other. In this way, a water molecule may connect with up to four other water molecules. The O–O distance between two such molecules is 0.28 nm.
At atmospheric pressure, liquid water shifts into the solid state of crystalline hexagonal ice-Ih when the temperature drops below 0°C. In this structure, each water molecule has four nearest neighbours, arranged so that the unit cell has two layers of hexagonally ordered water molecules, separated by 0.74 nm from each other (figure 3). The structure is a very open one, and ice allows gas molecules to be embedded. In the crystalline structure the thermal energy is connected to molecular vibrations around fixed equilibrium positions of the molecules, but when the temperature exceeds 0°C these vibrations break the hydrogen bonds of the lattice, and the liquid state is reached. Here the hydrogen bonds incessantly shift between the molecules, which move around between each other, trying to connect. The solid–liquid transition makes the ice-Ih structure collapse, but hexagonal features are maintained between the shifting groups of water molecules, and liquid water reaches its maximum density not until at 4°C. The number of nearest neighbours rises to n = 4.4. (In a close-packed hexagonal structure n = 12.) Thus, liquid water has a density that is about 10% higher than that of ice, but it still has an open structure of hexagonal character which allows gas molecules in solution. When the temperature is increased, the enthalpy is increased and the density goes down. At 100°C, the entropy increases as the liquid turns into vapour and the water molecules move freely among each other. These are bulk water features of water, but at a solid surface the first interfacial water layer is adsorbed, at least at low to moderate temperatures, to the solid surface, and its structure depends on the structure of the solid. The reduction of the kinetic energy of the adsorbed water molecules spreads to the adjacent liquid structure. This interfacial structure is liquid, but different from that of water.
Figure 3.
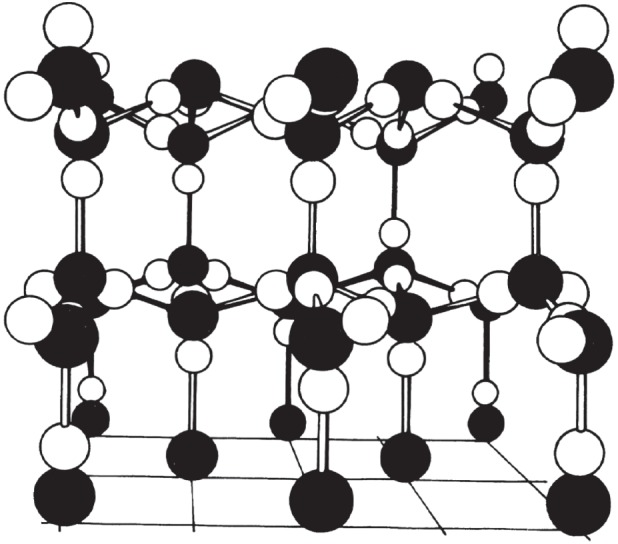
Crystal structure of hexagonal ice (ice-Ih). Filled-in circles represent oxygen and open circles hydrogen. (Reproduced with permission from [19]. Copyright © Royal Society of Chemistry.)
The simulations carried out by Xia et al. [16] of Pt–water interfaces at 300 K (27°C) actually show that the interfacial water molecules bond to the Pt atoms, and a monomolecular water layer with a solid, ice-like character is formed—but it does not have the structure of ice-Ih. The solid surface also affects the next layer, though at 300 K it remains liquid, and the third layer is affected too, though only slightly. If the temperature is lowered towards 0°C the thermal energy of the water molecules is reduced, and the water layer beyond the one in direct contact with the solid surface is increasingly stabilized. However, in the next layer the bonding is between water molecules, which tend to set up the structure of ice-Ih, but does not match the atomic structure on the solid surface. Thereby the bonds between the innermost interfacial water layers are strained, in particular if gas molecules are also present, i.e. the interface is hydrophobized, and its tensile strength is reduced. The temperature limit for such weakening of the interfacial solid–liquid bonding seems to be approximately 10°C, but molecular dynamics simulations of interfacial water at these low temperatures are desirable.
Xia et al.'s Pt–water interface is not representative for the materials causing cavitation in real life, but common surfaces such as SiO2 likewise adsorb water and expectedly have an ice-like interfacial water structure comparable to the one calculated for Pt–water. In Keller's [17] as well as in Briggs' [11] experiments, glass tubes were used for the test equipment, and particles may have been from sand. Thus, the maximum tensile strength at 10°C may be specific to SiO2.
3.2. Tensile strength of particles
Greenspan & Tschiegg [20] filtered away motes from distilled water and found that the tensile strength of water, measured by acoustic cavitation at 43 kHz, increased as the size of the motes became smaller, until at 0.2 µm a tensile strength of more than 200 bar could be sustained for seconds. Likewise, the tensile strength was increased when the gas content in the water was reduced, but when filtered to mote sizes smaller than 0.2 µm the gas content did not affect the tensile strength. The motes filtered away could have been particles as well as stabilized gas bubbles, but 0.2 µm gas bubbles would not have caused such high tensile strength. We conclude that solid particles were responsible for the tensile strength, and that the cavitation nuclei were interfacial gas bubbles much smaller than the particles themselves. A numerical relationship between particle size and tensile strength was not reported by Greenspan and Tschiegg. The intensity level of the sound field at cavitation inception depended on the time of exposure to this field, the level decreasing with increasing exposure time because of rectified diffusion—an indication that tensile strength is dependent on the pressure–time history of the nuclei [21].
Another effect of pressure is revealed by comparing nozzle flow experiments by Marschall et al. [22] with lithotripter experiments by Arora et al. [23]. Marschall et al. measured the tensile strength of tap water, filtered to a tensile strength of approximately 1.3 bar by removing natural motes larger than 1 µm and subsequently seeding the water with almost spherical particles with very smooth surfaces. Hydrophobic 3 µm particles were unable to cause cavitation, i.e. their tensile strength was above 1.3 bar, a result that can be attributed to the surface shape and smoothness. However, with 20 µm particles inception occurred at 0.7 bar, and with 76 µm particles it occurred at 0.5 bar. Thus, the tensile strength of these very perfect particles decreased when the particle size increased, and inception occurred from nuclei much smaller than the particles themselves, 0.5 bar of tensile strength corresponding to a critical bubble radius of approximately 2 µm only. With hydrophilic 30 µm particles, the tensile strength was 0.9 bar, i.e. it was increased, but not by very much. The cavitation nuclei were gaseous interfacial voids much smaller than the particles themselves.
To measure the tensile strength of water Arora et al. also used the hydrophilic 30 µm particles, actually from the same batch, and seeded them into Milli-Q water that was used in lithotripter experiments. Here a compressive pulse of peak intensity of approximately 240 bar preceded a tensile tail of approximately 70 bar. Cavitation could not be achieved with these particles. This indicates that the cavitation nuclei were suppressed by the compressive pulse. Using instead almost spherical particles with a rough surface, inception occurred from one, sometimes more, surface locations on the particles at tensile stresses of approximately 100 bar—and this led to ejection of the particle at high speed from the cavitation bubble it had itself generated (figure 4). These nuclei had critical radii of approximately 10 nm [23,24].
Figure 4.
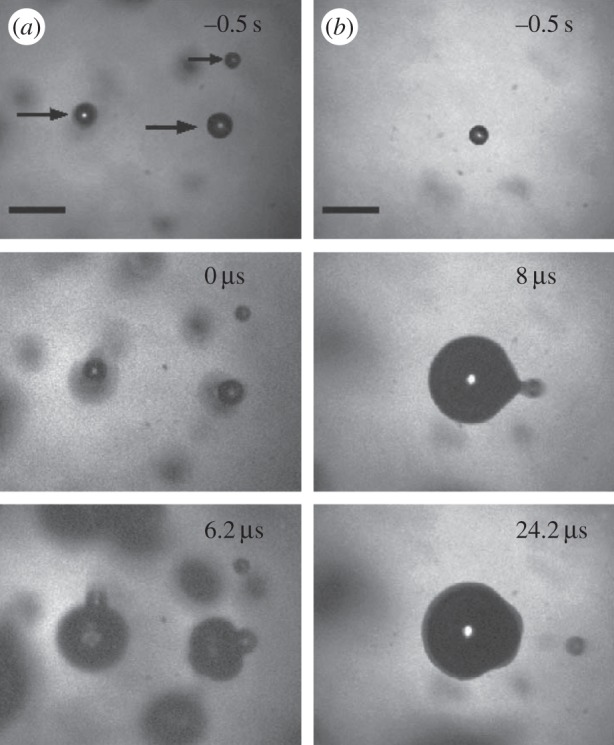
Two three-frame sequences of the explosive growth of cavitation bubbles from spherical particles exposed to a lithotripter pulse. The upper frames show particles before arrival of the tensile pulse at time t = 0, followed in the middle and the lower rows by the bubble growths over time, and ejection of the particles from the bubbles they had themselves generated. Bar length 200 µm. (Reproduced with permission from [23]. Copyright © American Physical Society.)
In the two experiments the water qualities were very different, but in particular the techniques for tensile stressing of the water were different, and the great difference in tensile strength indicates the volatile character of this quantity.
3.3. Observations of interfacial cavitation nuclei
As cavitation nuclei on solid surfaces are of micrometre size or smaller, they are difficult to study by optical techniques, but since the late 1980s first scanning tunnelling microscopy (STM), and subsequently in particular atomic force microscopy (AFM), offered the possibility of such studies. STM was used by Song et al. [25] to investigate the surface topography of grounded and polished tungsten (W) specimens in air and when covered with water, and also W surfaces with deposits of titanium nitrate (TiN) were studied using sharp tungsten tips. It was found that, in water, the surfaces appeared notably smoother than when scanned in air. This was attributed to the presence of gaseous voids at topographic pits and valleys on the submerged surface, the tip recording the liquid interface enveloping the irregularities of the specimen surface (figure 5a,b). The largest structures on the solid surface had width/depth at the 100 nm/10 nm scale and were produced during specimen preparation. Actually, it should not be possible to perform STM on W surfaces and TiN surfaces with a W tip, neither in air nor in water, because they oxidize into WO2 and TiO2 and, therefore, they are essentially non-conductive. However, when scanning is done in air under atmospheric conditions a monolayer of water molecules, and undoubtedly also unspecified contamination substances, is adsorbed to the specimen and tip surfaces. Such layers have allowed stray electrons, passing the oxide layers over larger areas, to be transferred along the interfaces to and from the tip–specimen gap, thereby making it possible to record even drained oxidized surfaces at very low current. This interpretation is supported by the low values of the tunnelling barrier signal found at the water–air interface (Φ1/2 ≈ 0.2 eV1/2), obtained by distance-modulating the gap between the tip and specimen during scanning. The distance was so small that the adsorbed water layers on the tip and specimen were in contact and the distance modulations affected the current only moderately. When operating in water the tip–specimen distance was notably larger than that in air (probably of the order of a nanometre), so that the interfacial water layers on the tip and specimen were separated, thereby allowing only a genuine tunnelling current and a correspondingly higher tunnelling barrier signal (Φ1/2 ≈ 0.6 eV1/2).
Figure 5.
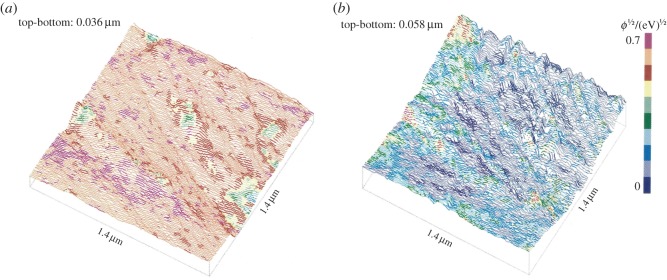
The same element of the surface of a W specimen recorded with a W tip (a) when submerged in water, and (b) subsequently in air. Note the smoothness of the surface recorded in water compared with that in air. Scanned area: 1400 × 1400 nm. Colours indicate tunnelling barrier height. (Reproduced with permission from [25]. Copyright © Elsevier.) (Online version in colour.)
The existence of interfacial voids of various sizes at water–WO2 interfaces is also apparent from figure 6 [26]. Figure 6a shows a W specimen surface which is scanned along both sides of the edge of a drop of water placed on the solid surface, the colouring (online) representing the tunnelling barrier signal. The line-scans start in the upper left corner in an area submerged beneath the drop where 0.4 eV1/2 < Φ1/2 < 0.6 eV1/2. The upper half of the scanned specimen area shows a smooth interface, characteristic of a solid surface submerged in water. As the STM tip moves towards the specimen front it reaches the drop edge in the middle of the scan, and from here it is the drained solid surface that is recorded, with approximately 0.1 < Φ1/2 < 0.2 eV1/2. Here the recorded roughness is increased, and a valley is seen to stretch beneath the drop. In figure 6b, the same area is recorded after being drained. The colouring here represents height: high positions are bright, low positions are dark. The surface roughness of the specimen is evident, and the valley stretches deep into the area previously covered by water. Thus, gaseous cavitation nuclei of very different strengths are revealed on the corrugated submerged solid–water interface. Song et al. [25] also investigated Au surfaces by STM using a Pt tip. Here genuine tunnelling from metal to metal occurred at the Au–air as well as at the Au–water interfaces, and, therefore, the STM technique was unable to reveal interfacial voids that may have been there.
Figure 6.
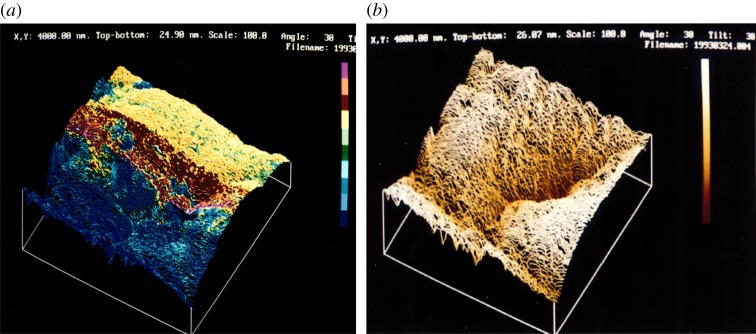
W specimen surface scanned with a W tip (a) near the edge of a drop of water (front half of surface drained, rear half covered with water; colours indicate tunnelling barrier height) and (b) subsequently when drained (totally drained surface; colours indicate topographic height). Scanned area: 1400 × 1400 nm [26]. (Online version in colour.)
A better technique for investigation of gaseous voids on solid surfaces became available with AFM that was developed in the years after STM, and AFM has been widely used for the study of interfacial gas bubbles, primarily on crystallographically planar hydrophobic, or hydrophobized, submerged surfaces; see the topical review by Seddon & Lohse [27]. Very flat nanobubbles of diameters typically of 50–1000 nm and heights of 5–50 nm [28] have been observed (figure 7a); and on surface-coated silicon irregularly shaped flat, allegedly gaseous areas of extension of about 1 µm and a height of about 2 nm only, named micro-pancakes, have been found, and these have been found to be stable for extended periods of time.
Figure 7.
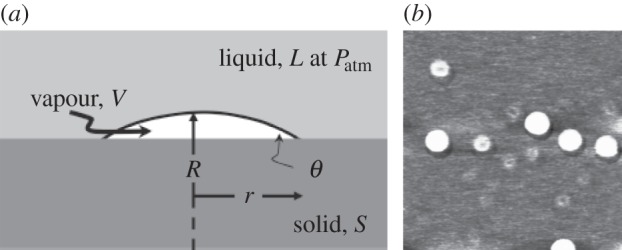
(a) Schematic of an interfacial nanobubble. θ ∼ 16°,  . (Reproduced with permission from [29]. Copyright © American Chemical Society.) (b) AFM tapping mode image of stable nanobubbles on a mica surface in water. Image size 1 × 1 µm. (Reproduced with permission from [30]. Copyright © AIP Publishing LLC.)
The surface nanobubbles were first recorded by Lou et al. [30] by tapping-mode AFM scanning of a water–mica interface (figure 7b). Later a variety of substrates such as highly orientated pyrolytic graphite (HOPG), gold (Au), polystyrene and silicon (Si) hydrophobized by surface coatings were used as the basis of studies of nanobubble formation. The micropancakes, first observed by Zhang et al. [31], were recorded on surface-coated silicon as well as on HOPG.
The stability in time of surface nanobubbles formed on decanethiol-coated gold surfaces in a closed environment was studied experimentally by Zhang et al. [32]. At exposure of such bubbles to water that was sub-saturated with gas, the bubbles were found to be pinned along their three-phase locus of contact during very slow shrinking, and thus primarily their height was shrinking. The shrinking was strongly dependent on the degree of gas saturation of the water in the enclosure. A one-dimensional Epstein–Plesset-type model of the diffusion of gas from the surface nanobubble into the liquid was also presented. For a bubble of contact radius 1 µm and a surface radius of curvature 2.6 µm the bubble lifetime was calculated to be of the order of 104 s at a saturation level of 0.999. A free spherical gas bubble with the same initial gas content was calculated to dissolve in about 10 s. However, such a gas bubble would have an initial radius of only 0.424 µm and its initial Laplace pressure would be much higher than that in the surface nanobubble. As noted by the authors the radius of curvature of the free bubble shrinks during dissolution and its Laplace pressure grows, while the opposite happens with the pinned surface nanobubble during its dissolution, which is decisive for the dramatic difference. The authors found that contamination was unlikely to have influenced their experimental results. However, the origin of surface nanobubble pinning is not clear, but it is ascribed to chemical and geometrical surface heterogeneities. Subsequently, Lohse & Zhang [33] showed theoretically that, in a supersaturated liquid, pinned surface nanobubles are stable to dissolution. For a given bubble contact line diameter the bubble height grows or shrinks until the supersaturation pressure corresponds to the Laplace pressure set up by the bubble surface curvature, thereby establishing a diffusion balance across the interface. In a closed environment, i.e. at constant supersaturation, the surface nanobubbles have an infinite lifetime.
A study by Weijs & Lohse [34] considered the diffusion of gas from a surface nanobubble to the atmosphere through a water layer. They found that, because of their pinned contact line, surface nanobubbles dissolve by diffusion over time, depending on the thickness of the water layer, but on a much longer time scale than free bubbles in an infinite liquid.
The question of contamination of a HOPG surface, submerged as well as drained, was studied experimentally by Berkelaar et al. [35]. They found that nanobubble-like objects of polydimethylsiloxane (PDMS) could form from solution when the surface was drained by evaporation from water that had been exposed to plastic material containing PDMS. These objects corresponded to those observed using two different experimental techniques for the study of a submerged HOPG surface in a gas-depleted environment. Thus, contamination must be considered an important and tricky factor when studying surface nanobubbles.
Interfacial surface nanobubbles as well as micropancakes seem to be potential cavitation nuclei, but, in real life, water as well as solid surfaces is always contaminated by a variety of substances. It is appropriate therefore to focus again on contamination, as already done by Fox & Herzfeld [10], Yount [12] and Ducker [29].
4. Model of a skin-stabilized interfacial cavitation nucleus
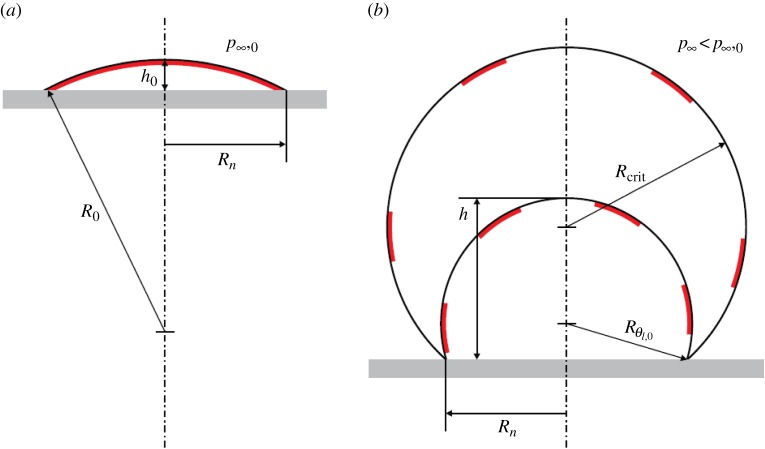
Based on the large number of observations discussed above, a model of skin-stabilized interfacial cavitation nuclei was recently presented by Andersen & Mørch [36]. In this model, the cavitation nuclei are supposed to be the same shape as the very flat surface nanobubbles found by AFM (see figure 7a), i.e. they are spherical caps, and they are taken to be covered by an amphiphilic skin which allows them to be in diffusion balance with the surrounding water. Thus, the initial pressure inside such a bubble pg,0 + pv = p∞,0, where pg,0 is the gas pressure, pv is the vapour pressure and p∞,0 is the initial far-field pressure, the skin giving the bubble an effective initial surface tension coefficient of γeff,0 = 0 [15]. Such a skin-stabilized interfacial cavitation bubble is shown in figure 8a, and an angle of attachment θ0 = 17° is assumed. The bubble has a radius of attachment Rn, which in the model presented is taken to be constant, and the initial bubble height is h0. These parameters define the initial surface radius of curvature R = R0 of the bubble.
Figure 8.
(a) Skin-stabilized interfacial gas bubble and (b) the bubble during exposure to tensile stress. (Reproduced with permission from [36]. Copyright © Cambridge University Press.) (Online version in colour.)
If we reduce the far-field pressure quasi-statically to p∞ < p∞,0 the bubble grows to h = h(t) with R = R(t) and the skin breaks into thin islands which are of constant total area, floating on the expanded liquid bubble surface, which connects to the sides of the solid-like islands at an angle of 90°. For simplicity, elasticity and tensile strength of the skin are neglected. The added surface area has the surface tension coefficient of clean water γ, and as a consequence the expanded bubble has an effective surface tension coefficient (omitting the indication of time dependency)
| 4.1 |
while the gas pressure
| 4.2 |
Such an expanded bubble is shown during growth in figure 8b. Assuming that the mass of gas in the bubble remains constant, its critical radius is reached when
| 4.3 |
and with h* = h/Rn it leads to
 |
4.4 |
which determines the critical bubble height hcrit for a given (Rn,h0) and thereby Rcrit. The tensile strength TS of the bubble
| 4.5 |
is then found from
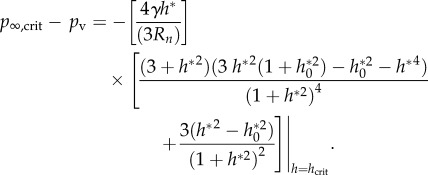 |
4.6 |
For the interfacial bubble in figure 8 with θ0 = 17°, p∞,0 = 1 bar, the relationship between TS and Rn is shown in figure 9. We note that for Rn > 1 µm TS < 1 bar, a result that fits well with general expectations, but from figure 8a,b we also see that the angle of attachment of the skin-stabilized bubble shifts from the low initial value of θ0 to much higher values before inception occurs at θl,crit. The above assumption of a constant Rn during bubble growth does not hold if the contact angle θl of the expanding bubble exceeds that of solid–gas–water equilibrium contact θequil after the skin is broken. When this happens the contact angle θequil determines the bubble contact instead of Rn which grows as inception is approached—and the tensile strength of the skin-stabilized interfacial gas bubble is reduced. Diffusion of gas into the bubble during tensile stressing also contributes to this, in particular, if the tensile stress grows slowly, or if the nucleus is exposed to repeated straining events that do not lead to inception. These effects make interfacial cavitation nuclei on substrates, which are not highly hydrophilic, lose tensile strength during expansion towards critical conditions. Therefore, if the tensile strength is determined experimentally from the growth of a supercritical cavitation bubble, the TS value found is lower than that of the skin-stabilized nucleus originally in equilibrium on the solid–water interface.
Figure 9.
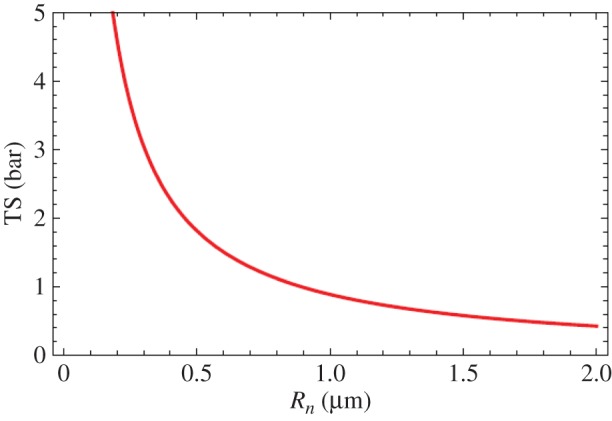
Tensile strength (TS) versus contact radius (Rn) for skin-stabilized interfacial gas bubbles in equilibrium at p∞,0 = 1 bar at a contact angle of θ0 = 17°. (Reproduced with permission from [36]. Copyright © Cambridge University Press.) (Online version in colour.)
When a cavity grows beyond critical conditions and later collapses, the skin floating on its surface as well as its gas content is carried away from the site of the original cavitation nucleus—it is depleted.
4.1. Experiments on tensile strength of interfacial cavitation nuclei
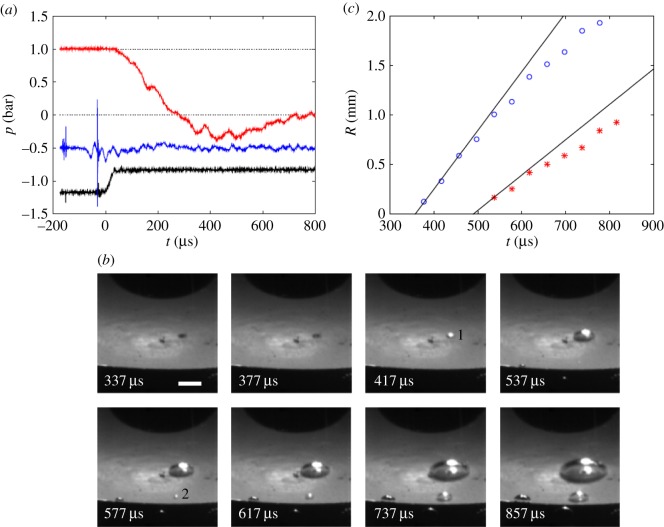
In connection with the above model Andersen & Mørch [36] presented cavitation experiments using tensile pulses (T-pulses) of rise time from 150 to 650 µs. From video recordings of the bubble growth, the tensile strength TS was determined for the individual nuclei which caused cavity development centrally on the concave, painted aluminium surface of the container bottom when it was abruptly accelerated downwards. The water used was Millipore Elix water, but the equipment was simply laboratory cleaned before use, i.e. the bottom had a natural surface. It was found that on the undamaged surface the sites of cavity nucleation shifted from one location to another in successive experiments, while at a surface damage inception occurred repeatedly from nearby positions within the damaged area, until eventually it moved away from the damaged area. Towards the end of 18 successive experiments the whole region observed was depleted of nuclei that could be activated. The tensile strength was calculated from video recordings of the bubble growth by use of the Rayleigh–Plesset equation, which just after cavitation inception reduces to
| 4.7 |
where ρl is the density of water. It was observed that, when in an experiment more than one interfacial cavitation event occurred, a weak nucleus might turn supercritical after the stronger one had passed inception (figure 10) as well as before. Thus, the experiments reveal that the tensile strength of cavitation nuclei generally decreases during their growth towards critical conditions, and that a cavitation nucleus on a smooth surface is depleted when it has generated a cavitation event. Further, at repeated events of tensile stressing, nuclei develop from new sites to reach a tensile strength low enough to allow inception—until eventually the solid–water interface is depleted of nuclei.
Figure 10.
(a) The tensile pulse (upper, red curve) which generated (b) the cavitation events 1 and 2, produced from nuclei of tensile strengths TS1 = 0.53 bar (calculated from the initial tangent to the curve of blue circles in (c)) and TS2 = 0.19 bar (calculated from the initial tangent to the red asterisks in (c)), respectively. Each frame is 128 × 128 pixels2. 1 pixel = 84 µm horizontally. (c) Bubble radii versus time show that the weaker nucleus reached critical size approximately 140 µs after the stronger one, revealing that the tensile strength of cavitation nuclei decreases during tensile stressing towards critical conditions. In (a) the blue middle curve is the accelerometer signal. The black lower curve is a ‘light on’ signal used for determination of the time of inception on the video. (Reproduced with permission from [36]. Copyright © Cambridge University Press.) (Online version in colour.)
5. Pressurization model for a skin-stabilized interfacial gas bubble
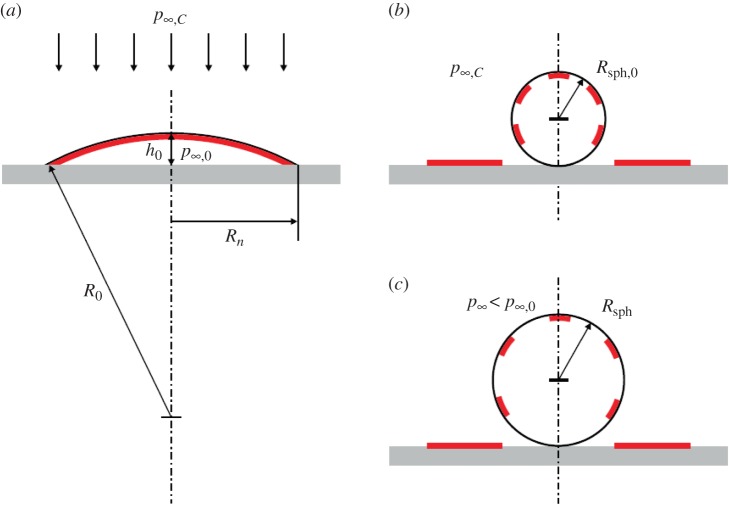
Now the question is what happens to the skin-stabilized interfacial bubble shown in figure 8a if it is pressurized? A slow pressure rise will allow the gas in the bubble to go into solution, and the skin is deposited on the solid surface. However, at a steep pressure rise diffusion is negligible and the bubble collapses as illustrated in figure 11. The front of the wave arrives simultaneously all over the bubble surface (figure 11a) and the pressure of p∞,C makes the bubble collapse from the rim towards the bubble centre. Here a spherical gas bubble of radius Rsph,0 is formed. During the collapse, the skin is deposited on the solid surface until eventually the spherical bubble breaks off, carrying the remaining skin on its surface, where it floats as islands. When the spherical bubble is created only a fraction α0 of its surface is covered by skin (figure 11b), it has an effective surface tension γeff,sph,0 > 0, and it is unstable. The coverage factor shifts when subsequently the bubble starts changing size because of diffusion of gas out of the bubble, and also if the pressure in the liquid changes. Rsph,0 depends on p∞,C through
 |
5.1 |
Figure 11.
(a) Pressurization wave arriving at a skin-stabilized interfacial bubble, which (b) transforms into a spherical non-stabilized bubble, skin covered by only a fraction α0. (c) At subsequent exposure to tensile stress it expands and loses tensile strength over time by diffusion of gas. (Reproduced with permission from [36]. Copyright © Cambridge University Press.) (Online version in colour.)
For the initial interfacial bubble in figure 8a having h0/Rn = 0.15, θ0 = 17°, p∞,0 = pg,0 = 1 bar we find Rsph,0 versus p∞,C as shown in figure 12 (lower, blue curve).
Figure 12.
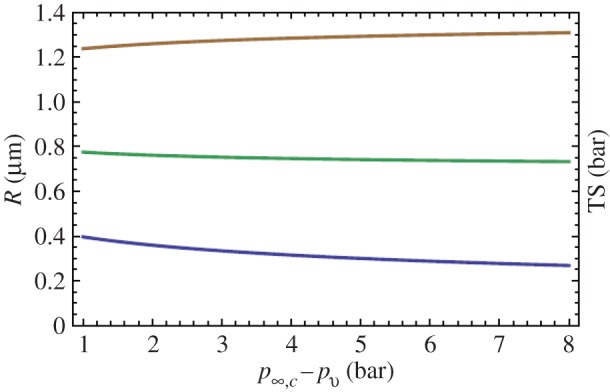
Lower curve (blue): bubble radius Rsph,0 versus level of pressurization p∞,C. Middle curve (green): associated critical radius Rsph,crit,0. Upper curve (brown): tensile strength TSsph,0 for a spherical bubble produced by pressurization to p∞,C of the interfacial skin-stabilized bubble of Rn = 1.6 µm, p∞,0 = 1 bar. (Reproduced with permission from [36]. Copyright © Cambridge University Press.) (Online version in colour.)
We see that a flat interfacial bubble of contact radius Rn = 1.6 µm transforms into a spherical bubble of radius Rsph,0 from 0.4 µm to 0.3 µm when pressurized up to 8 bar. And its tensile strength is shifted from TS = 0.5 bar to TSsph,0 ≈ 1.3 bar. The shift of the shape of the bubble and its gas content, which is constant during the transition, are decisive for the shift of tensile strength when the non-stabilized spherical bubble is created, not the level of pressurization. If the duration of the compressive pulse is extended, diffusion of gas out of the pressurized bubble raises its tensile strength, but if the pulse shifts into tension that exceeds the prevailing tensile strength of the bubble, cavitation inception occurs. At values of tensile stress insufficient to cause inception gas will diffuse into the bubble over time, its tensile strength is gradually lost, and inception may occur at a later time.
High-frequency pressure oscillations, superposed on the basic pulse, will cause rectified diffusion, but it has an effect only at large numbers of oscillations, unless the prevailing tensile strength of the bubble is exceeded in the tensile phase, and inception occurs.
In a normal medical lithotripter pulse the leading compressive phase has a peak pressure of 200–300 bar and a duration of approximately 2 µs, followed by a notably weaker tensile tail [23]. During such high pressurization the gas in a usual interfacial bubble may go into solution right at the bubble wall, leaving a nucleus of tensile strength too high for the peak of the tensile tail to cause cavitation, but the gas reverts to the nucleus during its exposure to tension [37]. This may explain the experimental results of Borkent et al. [38] interpreted as superstability of surface nanobubbles.
5.1. Experiments on pulse pressurization of interfacial cavitation nuclei
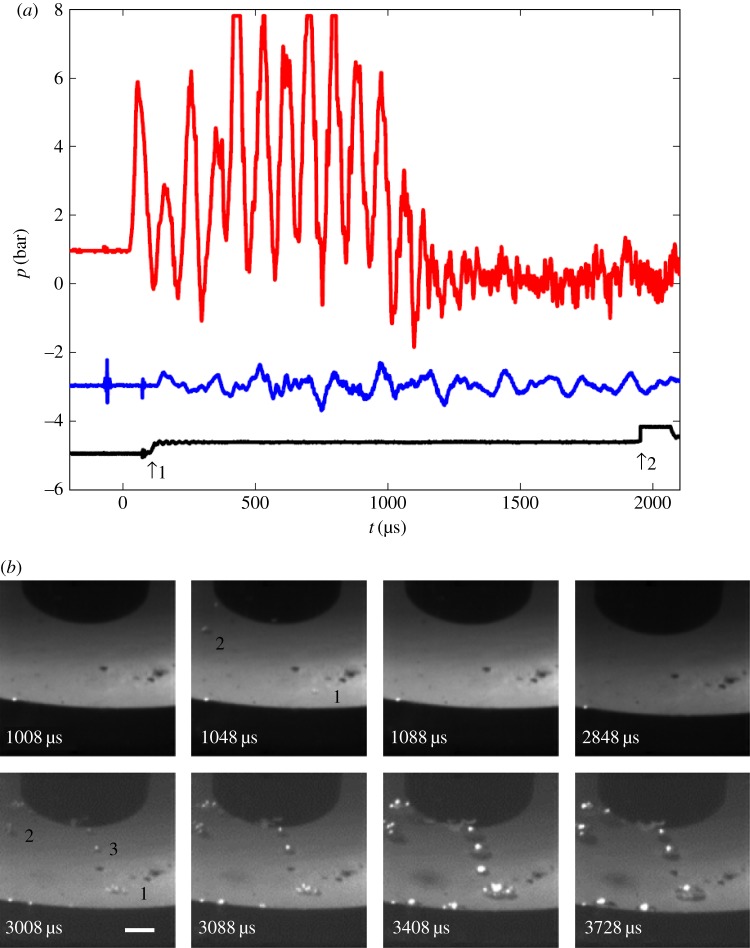
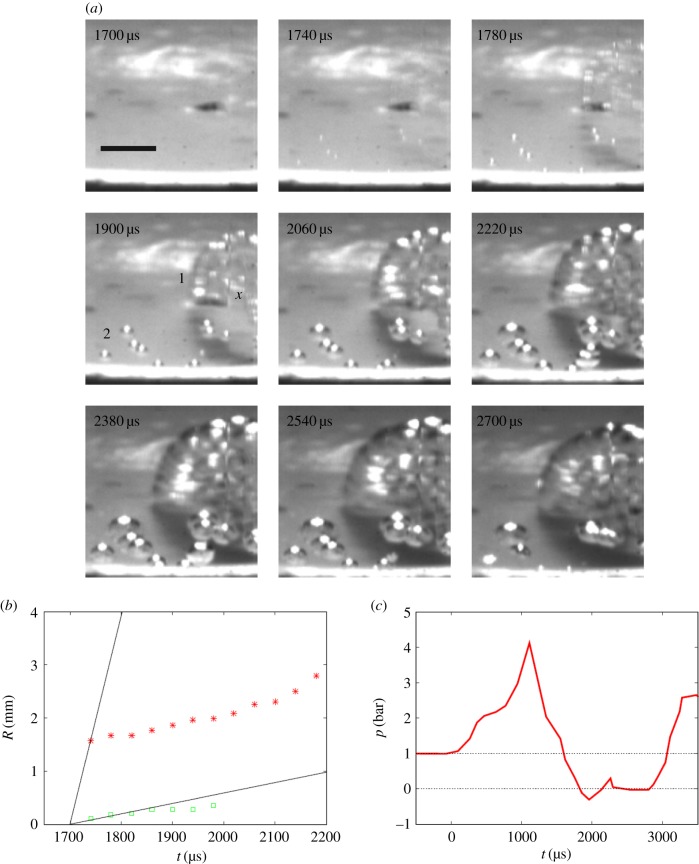
Andersen & Mørch [36,39] produced pulsed pressurization by dropping their water-filled container onto a steel block, producing a compressive pulse (C-pulse) of maximum intensity about 3–4 bar centrally at the bottom and of duration 1.1 or 1.7 ms, followed by a tensile tail. During pressurization strong approximately 11 kHz resonance oscillations were superposed on the basic compressive pulse (figure 13a). A tensile pulse (T-pulse) of rise time down to about 70 µs could be imposed at a chosen time during or after the compressive pulse. In most experiments, recorded at a framing rate of 25 000 frames s−1, the strongest high-frequency (HF) pressure oscillations caused single-frame cavitation events during pressurization (figure 13b). Assuming parabolic growth and collapse of these cavities, a lower limit of the tensile strength during pressurization could be calculated (figure 14). Lower-limit values of TS in the range 1–3 bar were revealed just after pressurization onset, and later during the 1100 µs of pressurization, values of 5–8 bar were calculated in subsequent single-frame events. In two cases with a compressive pulse duration of approximately 1700 µs, single-frame cavitation was absent, but explosive bubble growth at TS values estimated to be about 23 bar was obtained when the tensile pulse was imposed at the end of the compressive pulse, probably coinciding with the tensile phase of a HF pressure oscillation that was filtered away in the pressure recordings, carried out approximately 70 mm from the cavitation event (figure 15).
Figure 13.
(a) Pressurization signal (red curve), measured about 21 mm above the cavitation events. Blue curve: accelerometer signal. Black curve: 1. jump = flash light on, 2. jump = indicator for tensile pulse. (b) Video frames with the single-frame cavitation events ‘1’ of TS1 = 5.4 bar and ‘2’ of TS2 > TS1 at t = 1048 µs, produced by high-frequency (HF) pressure oscillations superposed on the pressurization pulse. Steady bubble development from nuclei of low TS including new bubbles (TS3 = 0.1 bar) starts approximately 1000 µs after the arrival of a strong tensile pulse at t ≈ 1920 µs. ‘Old’ nuclei now appear as clusters. Length of horizontal scale bar 2 mm. (Reproduced with permission from [36]. Copyright © Cambridge University Press.) (Online version in colour.)
Figure 14.
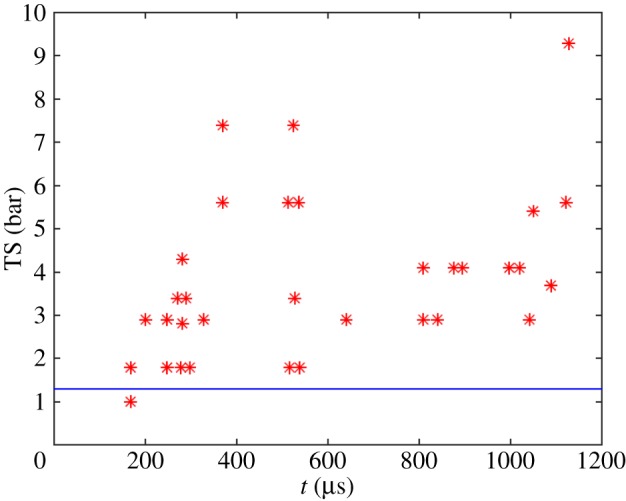
The tensile strength of water during pressurization (as, for example, in figure 13a) determined from single- and double-frame cavitation events, caused by superposed HF pressure oscillations. The horizontal line (blue) is the TS value for Rsph,0 = 0.35 µm at p∞,C − pv = 2 bar in figure 12. (Reproduced with permission from [36]. Copyright © Cambridge University Press.) (Online version in colour.)
Figure 15.
(a) Video of explosive cavitation event, bubble 1, but slow growth of bubble 2. (b) The initial growth rate of bubble 1 (red asterisks) gives TS = 23 bar, while bubble 2 (green squares) has a TS < 1 bar. (c) Associated HF-filtered C-pulse with a subsequent T-pulse generated at t ≈ 1700 µs. The pressure was measured 71 mm from the bottom centre. (Reproduced with permission from [36]. Copyright © Cambridge University Press.) (Online version in colour.)
When the pressurization pulse shifted into tensile stress (figure 13), the tensile strength achieved during pressurization was quickly lost. The gas in the interfacial cavitation nuclei, which were transformed into spherical bubbles of radius Rsph,0 at pressurization onset, is assumed to have gone into solution in the liquid during pressurization, but at exposure to tensile stress in the tail of the pulse, the gas quickly reverted to the nuclei. At continued tensile stressing, the tensile strength dropped further by diffusion of gas from the liquid into the nuclei (figure 13b).
6. Conclusion
The observation by Johnson & Cooke [14] that free gas bubbles in seawater were stabilized by a skin is the key to understanding also the stabilization of interfacial cavitation nuclei. The model of skin-stabilized cavitation nuclei by Andersen & Mørch [36] explains the observation that interfacial nuclei lose tensile strength during stressing towards critical conditions. The base radius of the bubble contact with the solid surface grows during bubble expansion towards critical conditions unless the solid surface is strongly hydrophilic, and at low growth rates gas diffusion also contributes. This links the critical size of cavitation nuclei in ordinary water, which has a low tensile strength, to the much smaller stable nanobubbles observed by scanning probe microscopy techniques. Thus, cavitation nuclei are dependent on their pressure–time history [21]. The model as well as the experiments shows that cavitation nuclei on smooth surfaces are depleted at cavitation inception.
Further, the model of skin-stabilized interfacial cavitation nuclei opens up an understanding of the experimentally observed shifts of tensile strength when water is exposed to pressurization, pulsed as well as static, and to their time dependency.
Competing interests
I declare I have no competing interests.
Funding
I received no funding for this study.
References
- 1.Blake FG. 1949. The onset of cavitation in liquids: I. Technical Memorandum no. 12. Acoustics Research Laboratory, Harvard University, Cambridge, MA.
- 2.Epstein PS, Plesset MS. 1950. On the stability of gas bubbles in liquid-gas solutions. J. Chem. Phys. 18, 1505–1509. ( 10.1063/1.1747520) [DOI] [Google Scholar]
- 3.Berthelot M. 1850. Sur quelques phenomenes de dilation forcee de liquides. Ann. Chim. Phys. 30, 232–237. [Google Scholar]
- 4.Harvey EN, Whiteley AH, McElroy WD, Peace DC, Barnes DK. 1944. Bubble formation in animals II. J. Cell. Comp. Physiol. 24, 23–34. ( 10.1002/jcp.1030240103) [DOI] [Google Scholar]
- 5.Knapp RT. 1958. Cavitation and nuclei. Trans. ASME 80, 1315–1324. [Google Scholar]
- 6.Strasberg M. 1959. Onset of ultrasonic cavitation in tap water. J. Acoust. Soc. Am. 31, 163–176. ( 10.1121/1.1907688) [DOI] [Google Scholar]
- 7.Atchley AA, Prosperetti A. 1989. Crevice model of nucleation. J. Acoust. Soc. Am. 86, 1065–1084. ( 10.1121/1.398098) [DOI] [Google Scholar]
- 8.Borkent BM, Gekle S, Prosperetti A, Lohse D. 2009. Nucleation threshold and deactivation mechanisms of nanoscopic cavitation nuclei. Phys. Fluids 21, 102003 ( 10.1063/1.3249602) [DOI] [Google Scholar]
- 9.Crum LA. 1979. Tensile strength of water. Nature 278, 148–149. ( 10.1038/278148a0) [DOI] [Google Scholar]
- 10.Fox FE, Herzfeld KF. 1954. Gas bubbles with organic skin as cavitation nuclei. J. Acoust. Soc. Am. 26, 984–989. ( 10.1121/1.1907466) [DOI] [Google Scholar]
- 11.Briggs LJ. 1950. Limiting negative pressure in water. J. Appl. Phys. 21, 721–722. ( 10.1063/1.1699741) [DOI] [Google Scholar]
- 12.Yount DE. 1979. Skins of varying permeability: a stabilization mechanism for gas cavitation nuclei. J. Acoust. Soc. Am. 65, 1429–1439. ( 10.1121/1.382930) [DOI] [Google Scholar]
- 13.Yount DE. 1997. On the elastic properties of the interfaces that stabilize gas cavitation nuclei. J. Colloid Interface Sci. 193, 50–59. ( 10.1006/jcis.1997.5048) [DOI] [PubMed] [Google Scholar]
- 14.Johnson BD, Cooke RC. 1981. Generation of stabilized microbubbles in seawater. Science 213, 209–211. ( 10.1126/science.213.4504.209) [DOI] [PubMed] [Google Scholar]
- 15.Mørch KA. 2007. Reflections on cavitation nuclei in water. Phys. Fluids 19, 072104 ( 10.1063/1.2747210) [DOI] [Google Scholar]
- 16.Xia X, Perera L, Essman U, Berkowitz ML. 1995. The structure of water at platinum/water interface. Molecular dynamics computer simulations. Surf. Sci. 335, 401–415. [Google Scholar]
- 17.Keller AP. 1980. Schlussbericht über das Forschungsvorhaben ‘Beginnende Kavitation, Zugspannungen in Flüssigkeiten’. Laboratory for Hydraulic Engineering and Water Resources Management, Technical University München/Obernach, Germany.
- 18.Herbert E, Balibar S, Caupin F. 2006. Cavitation pressure in water. Phys. Rev. E 74, 041603 ( 10.1103/PhysRevE.74.041603) [DOI] [PubMed] [Google Scholar]
- 19.Franks F. 1983. Water. London, UK: Royal Society of Chemistry. [Google Scholar]
- 20.Greenspan M, Tschiegg CE. 1967. Radiation-induced acoustic cavitation; apparatus and some results. J. Res. Natl Bur.Stand. C 71C, 299–312. ( 10.6028/jres.071C.024) [DOI] [Google Scholar]
- 21.Trevena DH. 1982. Time effects in cavitation experiments. J. Phys. D 15, L111–L114. ( 10.1088/0022-3727/15/9/002) [DOI] [Google Scholar]
- 22.Marschall HB, Mørch KA, Keller AP, Kjeldsen M. 2003. Cavitation inception by almost spherical solid particles in water. Phys. Fluids 15, 545–553. ( 10.1063/1.1535940) [DOI] [Google Scholar]
- 23.Arora M, Ohl C-D, Mørch KA. 2004. Cavitation inception on microparticles: a self-propelled particle accelerator. Phys. Rev. Lett. 92, 174501 ( 10.1103/PhysRevLett.92.174501) [DOI] [PubMed] [Google Scholar]
- 24.Borkent BM, Arora M, Ohl C-D, de Jong N, Versluis M, Lohse D, Mørch KA, Klaseboer E, Khoo BC. 2008. The acceleration of solid particles subjected to cavitation nucleation. J. Fluid Mech. 610, 157–182. ( 10.1017/S002211200800253X) [DOI] [Google Scholar]
- 25.Song JP, Mørch KA, Carneiro K, Thölén AR. 1993. STM investigations of solid surfaces in water and air. Surf. Sci. 296, 299–309. ( 10.1016/0039-6028(93)90026-G) [DOI] [Google Scholar]
- 26.Mørch KA, Song JP. 1993. STM for investigation of cavitation nuclei in liquids. In Proc. 1993 Int. Conf. on Scanning Tunneling Microscopy, STM'93, Beijing, China, 9–13 August 1993. New York, NY: American Vacuum Society. [Google Scholar]
- 27.Seddon JRT, Lohse D. 2011. Nanobubbles and micropancakes: gaseous domains on immersed substrates. J. Phys. 23, 133001 ( 10.1088/0953-8984/23/13/133001) [DOI] [PubMed] [Google Scholar]
- 28.Zhang XH, Quinn A, Ducker WA. 2008. Nanobubbles at the interface between water and a hydrophobic solid. Langmuir 24, 4756–4764. ( 10.1021/la703475q) [DOI] [PubMed] [Google Scholar]
- 29.Ducker WA. 2009. Contact angle and stability of interfacial nanobubbles. Langmuir 25, 8907–8910. ( 10.1021/la902011v) [DOI] [PubMed] [Google Scholar]
- 30.Lou S-T, Ouyang Z-Q, Zhang Y, Li X-J, Hu J, Li M-Q, Yang F-J. 2000. Nanobubbles on solid surfaces imaged by atomic force microscopy. J. Vacuum Sci. Technol. B 18, 2573–2575. ( 10.1116/1.1289925) [DOI] [Google Scholar]
- 31.Zhang XH, Zhang X, Sun J, Zhang Z, Li G, Fang H, Xiao X, Zeng X, Hu J. 2007. Detection of novel gaseous states at the highly oriented pyrolytic graphite-water interface. Langmuir 23, 1778–1783. ( 10.1021/la062278w) [DOI] [PubMed] [Google Scholar]
- 32.Zhang X, Chan DYC, Wang D, Maeda N. 2013. Stabiliy of interfacial nanobubbles. Langmuir 29, 1017–1023. ( 10.1021/la303837c) [DOI] [PubMed] [Google Scholar]
- 33.Lohse D, Zhang X. 2015. Pinning and gas oversaturation imply stable single surface nanobubbles. Phys. Rev. E 91, p031003(R). ( 10.1103/PhysRevE.91.031003) [DOI] [PubMed] [Google Scholar]
- 34.Weijs JH, Lohse D. 2013. Why surface nanobubbles live for hours. Phys. Rev. Lett. 110, 054501 ( 10.1103/PhysRevLett.110.054501) [DOI] [PubMed] [Google Scholar]
- 35.Berkelaar RP, Dietrich E, Kip GAM, Kooij ES, Zandvliet HJW, Lohse D. 2014. Exposing nanobubble-like objects to a degassed environment. Soft Matter 10, 4947–4950. ( 10.1039/c4sm00316k) [DOI] [PubMed] [Google Scholar]
- 36.Andersen A, Mørch KA. 2015. Cavitation nuclei in water exposed to transient pressures. J. Fluid Mech. 771, 424–448. ( 10.1017/jfm.2015.185) [DOI] [Google Scholar]
- 37.Mørch KA. 2009. Cavitation nuclei: experiments and theory. J. Hydrodyn. 21, 176–189. ( 10.1016/S1001-6058(08)60135-3) [DOI] [Google Scholar]
- 38.Borkent BM, Dammer SM, Schönherr H, Vancso GJ, Lohse D. 2007. Superstability of surface nanobubbles. Phys. Rev. Lett. 98, 204502 ( 10.1103/PhysRevLett.98.204502) [DOI] [PubMed] [Google Scholar]
- 39.Andersen A, Mørch KA. 2012. Tensile strength of water exposed to pressure pulses. In Proc. 8th Int. Symp. on Cavitation (CAV2012), Singapore, 13–16 August 2012, pp. 540–545. Singapore: Research Publishing Services.


