

Abstract
Background
Legionella pneumophila (Lp) is a water-borne opportunistic pathogen. In water, Lp can survive for an extended period of time until it encounters a permissive host. Therefore, identifying genes that are required for survival in water may help develop strategies to prevent Legionella outbreaks.
Results
We compared the global transcriptomic response of Lp grown in a rich medium to that of Lp exposed to an artificial freshwater medium (Fraquil) for 2, 6 and 24 hours. We uncovered successive changes in gene expression required for the successful adaptation to a nutrient-limited water environment. The repression of major pathways involved in cell division, transcription and translation, suggests that Lp enters a quiescent state in water. The induction of flagella associated genes (flg, fli and mot), enhanced-entry genes (enh) and some Icm/Dot effector genes suggests that Lp is primed to invade a suitable host in response to water exposure. Moreover, many genes involved in resistance to antibiotic and oxidative stress were induced, suggesting that Lp may be more tolerant to these stresses in water. Indeed, Lp exposed to water is more resistant to erythromycin, gentamycin and kanamycin than Lp cultured in rich medium. In addition, the bdhA gene, involved in the degradation pathway of the intracellular energy storage compound polyhydroxybutyrate, is also highly expressed in water. Further characterization show that expression of bdhA during short-term water exposure is dependent upon RpoS, which is required for the survival of Lp in water. Deletion of bdhA reduces the survival of Lp in water at 37 °C.
Conclusions
The increase of antibiotic resistance and the importance of bdhA to the survival of Lp in water seem consistent with the observed induction of these genes when Lp is exposed to water. Other genes that are highly induced upon exposure to water could also be necessary for Lp to maintain viability in the water environment.
Electronic supplementary material
The online version of this article (doi:10.1186/s12864-015-1869-6) contains supplementary material, which is available to authorized users.
Keywords: Legionella pneumophila, Survival, Freshwater, Stringent response, Transcriptome, Antibiotic resistance, bdhA
Background
Legionella pneumophila (Lp) is a Gram-negative bacterium that inhabits natural freshwater environments and man-made water systems. Lp has a broad host range and is able to replicate in different species of amoeba, ciliated protozoa and slime mold [1]. Importantly, it is also able to infect humans, resulting in a potentially fatal illness called Legionnaires’ disease (LD) [2]. Human infection occurs through inhalation of aerosols originating from Legionella-contaminated sources, such as cooling towers, air conditioning and heating systems, fountains and even showers [3]. Upon entry into alveolar macrophages, Lp prevents fusion with lysosomes, modulates host cell trafficking, forms a Legionella-containing vacuole and then starts intracellular multiplication [4]. In recent years, the occurrence rate of LD has been reported to be on the increase in many countries [5]. In the US, the incidence rate of LD increased by 192 % over the last decade [6]. In Europe, France, Italy and Spain consistently have the highest number of reported cases, with 7.06 to 11.7 cases per thousand in 2011 [7]. Most of these are sporadic cases, either community-acquired, nosocomial or travel-associated [8]. Nevertheless, outbreak of LD in which a large population gets exposed to contaminated aerosols from a point-source is of great concern. Investigations of previous outbreaks show that the dispersal distance of Lp from cooling towers and air scrubbers can be greater than 10 km [9, 10].
Many bacteria, such as Bacillus megaterium, Salmonella enteritidis, Staphylococcus aureus and Vibrio cholera, die steadily upon exposure to freshwater [11, 12]. Chandran et al. [13] showed that the colony-forming units (CFU) of Escherichia coli and Vibrio parahaemolyticus decreased by 7 logs after 27 days of exposure to lake water. In contrast, Lp is able to survive for a prolonged period of time in freshwater despite the lack of nutrients [14–17]. In an earlier study, Lp exposed to drinking water and creek water had a mere 2 log reduction in CFU counts and still maintained 3 × 10⁶ CFU/ml after an incubation time of 1.5 years [18]. The ability of Lp to survive in water for long periods is essential for the colonization of water systems, allowing it to persist until optimal conditions and permissive hosts for its growth are encountered. Survival in water is, therefore crucial for the transmission of Lp to the human host. In turn, it is important to understand the genetic factors of Lp that allow its prolonged survival in water. This knowledge may allow future development of strategies that prohibit the survival of Lp in water systems and eventually help control Legionella outbreaks.
Lp possesses approximately 3000 genes, in which 2434 genes are commonly found in all six strains [19]. As a human pathogen, the genes involved in virulence have been extensively studied [20–23]. Two major secretion systems, the Lsp type II secretion system (T2SS) and the Icm/Dot type IVB secretion system (T4BSS), translocate more than 300 effector proteins into the host cell and are critical for the virulence of Lp [24]. Moreover, many other genes act as virulence factors that directly contribute to host cell infection (e.g., mip, enhABC) or as virulence regulators (e.g., rpoS, cpxR and letA) [25–29]. Apart from the virulence genes, a recent study has showed that at least 597 genes are essential for optimal growth of Lp in rich medium [30]. However, the functions of many Lp genes still remains unknown. To date, only a few genes are known to be important for the survival of Lp in water. Söderberg et al. [17] studied the survival of lspD, lspE, lspF and pilD mutants in tap water and concluded that the T2SS is important for Lp to maintain survival at temperatures between 4 and 17 °C. Recently, our group has shown that the sigma factor RpoS and the stringent response (RelA and SpoT) are required for the survival of Lp in water [31].
Given the lack of knowledge and the associated risk to public health, it is necessary to identify more Lp genes that are required for survival in water. Bacteria typically respond to environmental changes through transcriptomic reorganization, where they express genes that are essential for coping with the new condition and repress genes that are no longer required, or that are detrimental [32, 33]. Comparison of transcriptional changes using microarrays can be used to identify candidate genes needed in a particular condition [34–36]. Recently, this technique has been used to identify a new gene, iroT, involved in ferrous ion transport based on the transcriptomic profile of Lp in an iron restricted condition [37].
In this study, we use a transcriptomic approach to identify genes that are potentially involved in the survival of Lp in water. Since bacteria tend to have immediate transcriptomic responses within the first few hours upon exposure to stressful conditions [38], the transcriptomic response of Lp to water was studied at an early time point (2 h), an intermediate time point (6 h) and a late time point (24 h). Genes involved in adaptation and regulatory functions are induced in water, while those involved in energy metabolism and translation are repressed. In particular, our analysis shows that bdhA is strongly expressed upon exposure to water, and the deletion of bdhA reduces the survival of Lp in water at 37 °C.
Results
Survival of Lp in Fraquil
In order to ensure reproducibility, an artificial freshwater medium was used to perform the transcriptomic analysis. The freshwater medium Fraquil was selected for this purpose since it mimics the composition of freshwater in North America [39]. The survival of the wild-type strain JR32 in Fraquil at 25 °C is shown in Fig. 1a. The population of Lp in Fraquil was stable for at least five weeks.
Fig. 1.
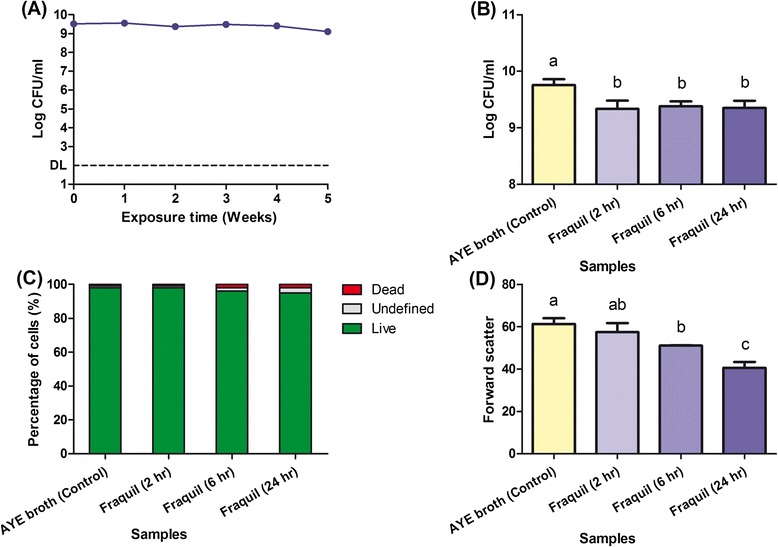
Lp survives well in water at 25 °C. a CFU counts of JR32 during five weeks of exposure to Fraquil. DL indicates the detection limit at 100 CFU/ml. b CFU counts of JR32 cultured in AYE broth or exposed to Fraquil. All samples were at an OD600 of 1.0. Data shows the mean +/− SD of three biological replicates. Different letters on the bars indicate significant differences between the samples according to Tukey's test (p < 0.05). c Percentage of live, undefined or dead JR32 cells cultured in AYE broth or exposed to Fraquil. Live/Dead staining was used with flow cytometry to determine the status of 5000 cells in each sample. d Forward scatter (FSC) of JR32 cultured in AYE broth or exposed to Fraquil. Each sample had three biological replicates and the mean FSC signal of 5000 cells in each replicate was detected by flow cytometry
For the transcriptomic analysis, JR32 was first cultured in ACES-buffered yeast extract (AYE) broth to exponential phase in triplicate and 1 ml samples were harvested to serve as controls. Then, the cells were washed three times with Fraquil and re-suspended in Fraquil at a final OD600 of 1.0. The three re-suspensions were transferred to vessels of a BIOSTAT® Q Plus bioreactor to control temperature and dissolved oxygen. Samples were taken after 2, 6 and 24 h of exposure (treatment) and compared to controls grown in AYE broth. At each time point, we performed both CFU counts and Live/Dead staining. Although both AYE samples and Fraquil samples were at the same optical density, the CFU counts of JR32 exposed to Fraquil were consistently lower, albeit by a very small margin, than JR32 from AYE broth (Fig. 1b). There were no significant differences in CFU counts between the Fraquil samples at the different time points tested. Flow cytometry analysis of Live/Dead staining was used to evaluate the percentage of viable cells and showed that there were no differences between samples (Fig. 1c). Taking into account CFU counts and cell staining, Lp showed no significant survival defects within the first 24 h of exposure to Fraquil.
Based on the flow cytometry data, a steady reduction in the forward scatter (FSC) was observed in JR32 upon exposure to Fraquil (Fig. 1d). The lowest average FSC signal was observed in Fraquil samples after 24 h (the longest exposure time). Since the FSC signal is proportional to particle size [40], this result indicates that Lp undergoes a gradual reduction in cell size after exposure to water.
Transcriptomic response of Lp exposed to water
In order to understand the genetic regulation of Lp during short-term exposure to water, we performed a transcriptomic analysis through DNA microarray hybridization. RNA was extracted from exponential phase (Control) and Fraquil-treated (Treatment) samples and the data of each treatment was compared with the control.
Compared to JR32 growing in AYE broth, the expression of 2080 annotated genes and 201 predicted sRNA encoding sequences changed significantly (log2 ratio of Treatment/Control >1 or < −1, p < 0.05), in at least one time point (2, 6 or 24 h) after exposure to Fraquil (Additional file 1). A progressive transcriptomic change over time is clearly seen in the heat map showing the induction and repression of genes (Fig. 2). The percentages of significantly up- and down-regulated genes increased from 2 to 6 h of water exposure, while more genes were significantly down-regulated than up-regulated after 24 h (Fig. 3a). There were 13.1 % up-regulated genes and 15.7 % down-regulated genes after 2 h of water exposure, demonstrating the rapid transcriptional responses of Lp upon exposure to Fraquil.
Fig. 2.
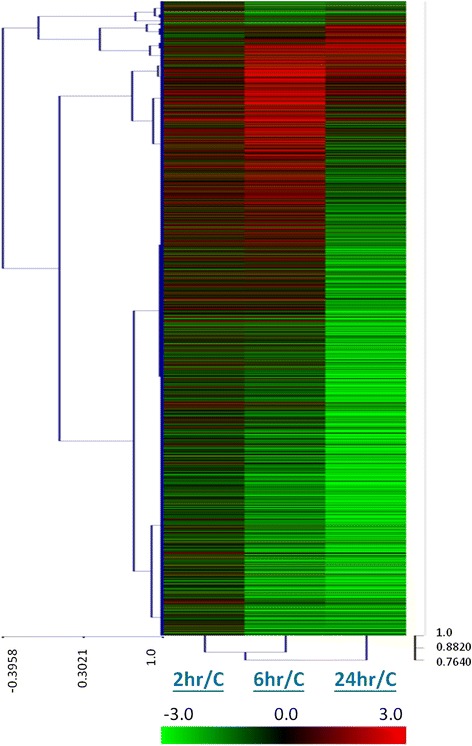
Progressive transcriptomic changes of Lp in water. The global gene expression of JR32 after 2, 6 and 24 h exposure to Fraquil in comparison with the control cultured in AYE broth is shown in the heat map. The hierarchical clustering shows the similarities between samples. The genes that were up-regulated are shown in red and those down-regulated are shown in green
Fig. 3.
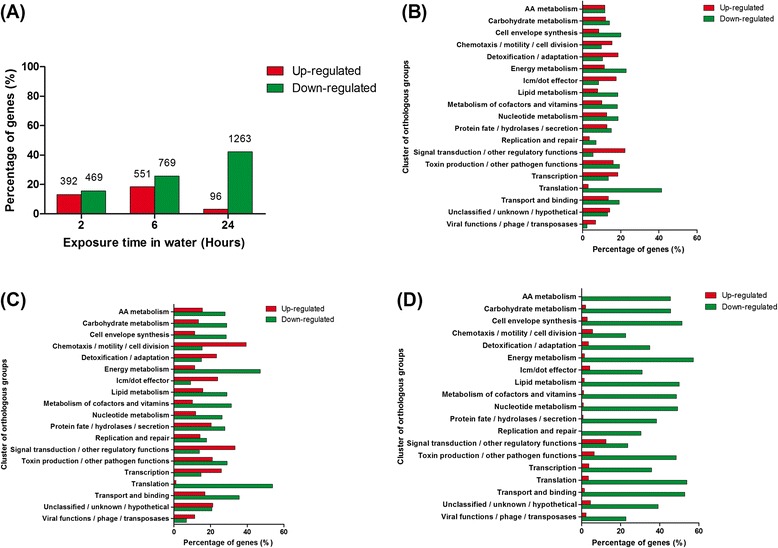
Many Lp genes are shut down after 24 h of exposure to water. a Percentage of genes significantly up-regulated or down-regulated after 2, 6 and 24 h of exposure to Fraquil. The numbers on the top of each bar represent the number of genes differently expressed (Log2 < −1 or >1, p < 0.05) over a total of 2994 annotated genes from the original genome annotation. Cluster of orthologous groups analysis of JR32 genes after (b) 2 h, (c) 6 h and (d) 24 h of exposure to Fraquil is shown. Up-regulated genes are shown in red and down-regulated genes are shown in green
Genes that were differentially expressed after water exposure were categorized into orthologous groups. After 2 and 6 h of water exposure, seven of the 19 orthologous groups had a higher percentage of up-regulated genes (Fig. 3b and c). These orthologous groups are “chemotaxis/motility/cell division”, “detoxification/adaptation”, “icm/dot effector”, “signal transduction/other regulatory functions”, “transcription”, “unclassified/unknown/hypothetical” and “viral functions/phage/transposases”. In contrast, all 19 orthologous groups showed major down-regulation of genes after 24 h of water exposure (Fig. 3d). At each time point, “energy metabolism”, “translation” and “transport and binding” remained the top three orthologous groups with the highest percentage of down-regulated genes. Examples of genes in these orthologous groups are listed in Table 1 and 2 and will be discussed later.
Table 1.
Selected genes significantly down-regulated in water
| Log2 ratioa | |||||
|---|---|---|---|---|---|
| Functional class and protein | Locus tag | Gene | 2 hr/C | 6 hr/C | 24 hr/C |
| Cell division | |||||
| Cell division protein | lpg2610 | ftsA | −1.12 | −2.93 | |
| Cell division protein | lpg2611 | ftsQ | −1.18 | −1.28 | −4.43 |
| Cell division protein | lpg2615 | ftsW | −2.34 | −5.59 | |
| Energy metabolism | |||||
| ATP synthase F0, A subunit | lpg2988 | atpB | −1.38 | −2.58 | −3.49 |
| ATP synthase F0, C subunit | lpg2987 | atpE | −1.27 | −2.58 | |
| ATP synthase F0, I subunit | lpg2989 | atpI | −1.13 | −2.51 | |
| ATP synthase F1, alpha subunit | lpg2984 | −1.77 | −1.71 | ||
| ATP synthase F1, beta subunit | lpg2982 | atpD | −1.19 | −2.53 | −2.44 |
| ATP synthase F1, epsilon subunit | lpg2981 | atpC | −1.67 | −4.33 | |
| ATP synthase F1, gamma subunit | lpg2983 | atpG | −1.36 | −2.16 | −2.60 |
| ATP synthase F1,delta subunit | lpg2985 | atpH | −1.89 | −2.15 | |
| Cytochrome c oxidase, subunit I | lpg2896 | −1.71 | −3.10 | ||
| Cytochrome c oxidase, subunit II | lpg2897 | −2.38 | −3.10 | ||
| Cytochrome c | lpg2898 | −1.16 | −1.64 | ||
| NADH dehydrogenase I, A subunit | lpg2789 | nuoA | −1.56 | −3.42 | −6.44 |
| NADH dehydrogenase I, B subunit | lpg2788 | nuoB2 | −4.60 | −6.26 | −8.44 |
| NADH dehydrogenase I, C subunit | lpg2787 | nuoC | −1.16 | −3.34 | −4.65 |
| NADH dehydrogenase I, H subunit | lpg2782 | nuoH | −1.72 | −3.71 | −6.66 |
| NADH dehydrogenase I, I subunit | lpg2781 | nuoI | −1.00 | −2.82 | −4.16 |
| Succinate dehydrogenase | lpg0528 | sdhC | −2.94 | ||
| Succinate dehydrogenase | lpg0530 | sdhA | −2.48 | ||
| Succinate dehydrogenase | lpg0531 | sdhB | −1.01 | −2.93 | |
| Ubiquinol-cytochrome c reductase | lpg2704 | petB | −1.66 | −5.08 | |
| Ubiquinol-cytochrome c reductase | lpg2705 | petA | −1.46 | −2.54 | |
| Signal transduction/other regulatory functions | |||||
| Response regulator | lpg1912 | letS | −1.15 | ||
| Response regulator | lpg2646 | letA | −4.02 | −3.57 | −5.46 |
| Toxin production/other pathogen functions | |||||
| Macrophage infectivity potentiator | lpg0791 | mip | −1.22 | −2.04 | |
| Transcription | |||||
| DNA-directed RNA polymerase alpha subunit | lpg0354 | rpoA | −2.70 | −3.95 | |
| DNA-directed RNA polymerase beta subunit | lpg0322 | rpoB | −1.74 | −2.63 | |
| DNA-directed RNA polymerase beta' subunit | lpg0323 | rpoC | −2.83 | ||
| RNA polymerase sigma-32 factor | lpg2667 | rpoH | −2.09 | ||
| Translation | |||||
| 30S ribosomal protein S13 | lpg0351 | rpsM | −2.57 | −4.22 | −5.00 |
| 30S ribosomal protein S20 | lpg2636 | rpsT | −3.86 | −4.43 | −6.92 |
| 30S ribosomal protein S6 | lpg1592 | rpsF | −2.99 | −4.18 | −4.84 |
| 30S ribosomal protein S7 | lpg0325 | rpS7 | −2.43 | −3.36 | −3.89 |
| 50S ribosomal protein L15 | lpg0348 | rplO | −1.76 | −3.37 | −3.21 |
| 50S ribosomal protein L16 | lpg0336 | rplP | −2.49 | −3.73 | −3.21 |
| 50S ribosomal protein L28 | lpg0479 | rpmB | −2.00 | −2.89 | −3.40 |
| 50S ribosomal protein L6 | lpg0344 | rplF | −2.49 | −3.81 | −3.47 |
| Translation elongation factor G | lpg0326 | fusA | −2.45 | −2.59 | |
| Translation elongation factor Ts | lpg1713 | tsf | −1.40 | −1.20 | |
| Translation initiation factor IF-1 | lpg1770 | infA | −2.47 | −3.69 | −5.00 |
| Translation initiation factor IF-3 | lpg2713 | infC | −3.20 | −3.29 | |
| tRNA-Gly | lpg2292 | −3.05 | −3.10 | −3.76 | |
| tRNA-Met | lpg0797 | −2.99 | −3.68 | −5.53 | |
| tRNA-Phe | lpg1929 | −3.29 | −3.63 | −4.44 | |
| tRNA-Pro | lpg1866 | −3.54 | −4.49 | −5.83 | |
| Transport and binding | |||||
| Amino acid antiporter | lpg1658 | −2.19 | −3.66 | −5.86 | |
| Amino acid antiporter | lpg1691 | −2.89 | −3.61 | −4.31 | |
| Amino acid antiporter | lpg1917 | −2.51 | −4.11 | −4.80 | |
| Amino acid permeases | lpg0970 | −1.91 | −3.42 | −5.45 | |
| Amino acid permease family protein | lpg0228 | −2.77 | −5.41 | −6.13 | |
| Amino acid transporter | lpg0049 | −3.27 | |||
| Ferrous iron transporter | lpg2658 | feoA | −2.56 | −2.80 | −4.47 |
| Ferrous iron transporter | lpg2657 | feoB | −3.10 | −5.23 | |
| DotA | lpg2686 | dotA | −1.35 | ||
| DotC | lpg2675 | dotC | −1.40 | −2.29 | −4.72 |
| DotD | lpg2674 | dotD | −1.46 | −3.67 | |
| DotK | lpg0447 | lphA | −2.59 | −1.69 | −5.16 |
| IcmB (DotO) | lpg0456 | icmB | −3.00 | ||
| IcmC (DotE) | lpg0453 | icmC | 1.27 | −1.11 | |
| IcmF | lpg0458 | icmF | −1.13 | ||
| IcmH (DotU) | lpg0459 | icmH | −2.95 | −2.42 | −5.33 |
| IcmJ (DotN) | lpg0455 | icmJ | −1.69 | ||
| IcmK (DotH) | lpg0450 | icmK | −2.10 | −4.11 | |
| IcmL (DotI) | lpg0449 | icmL | −1.93 | −5.42 | |
| IcmL homolog | lpg0708 | −2.65 | |||
| IcmL homolog | lpg0383 | −2.81 | |||
| IcmM (DotJ) | lpg0448 | icmM | −2.57 | ||
| IcmO (DotL) | lpg0446 | icmO | 2.07 | −1.50 | |
| IcmQ | lpg0444 | icmQ | −1.36 | ||
| IcmR | lpg0443 | icmR | −2.16 | ||
| IcmS | lpg0442 | icmS | −2.43 | ||
| IcmT | lpg0441 | icmT | 1.39 | 1.79 | −1.09 |
| IcmV | lpg2687 | icmV | 1.00 | −1.89 | |
| IcmW | lpg2688 | icmW | −3.09 | ||
| IcmX (IcmY) | lpg2689 | icmX | −1.41 | ||
| Type IV pilus biogenesis protein | lpg0927 | pilM | −2.04 | ||
| Type IV pilus biogenesis protein | lpg0928 | pilN | −1.36 | −2.74 | |
| Type IV pilus biogenesis protein | lpg0930 | pilP | −3.66 | ||
aOnly values that were significantly different than the control are shown
Table 2.
Selected genes significantly up-regulated in water
| Log2 ratioa | |||||
|---|---|---|---|---|---|
| Functional class and protein | Locus tag | Gene | 2 hr/C | 6 hr/C | 24 hr/C |
| Chemotaxis/motility | |||||
| Flagellar assembly protein | lpg1790 | fliO | 5.35 | ||
| Flagellar basal body rod protein | lpg1221 | flgG | 2.38 | 3.01 | |
| Flagellar biosynthesis sigma factor | lpg1782 | fliA | 3.34 | 1.53 | |
| Flagellar biosynthetic protein | lpg1788 | fliQ | 2.75 | ||
| Flagellar biosynthetic regulator | lpg1784 | flhF | 3.46 | ||
| Flagellar hook protein | lpg1219 | flgE | 4.17 | 3.79 | |
| Flagellar L-ring protein | lpg1222 | flgH | 2.13 | ||
| Flagellar motor protein | lpg2318 | motA | 1.63 | ||
| Flagellar motor protein | lpg1780 | motB | 2.72 | ||
| Flagellar motor protein | lpg1781 | motC | 4.02 | ||
| Flagellar motor switch protein | lpg1792 | fliM | 3.48 | 1.44 | |
| Flagellar P-ring protein | lpg1223 | flgI | 2.99 | ||
| Flagellin | lpg1340 | fliC | 1.22 | 1.71 | |
| Detoxification/adaptation | |||||
| Alkylhydroperoxidase | Lpg2349 | ahpD | 2.63 | 2.25 | |
| Alkylhydroperoxide reductase | lpg2350 | ahpC | 1.74 | 1.64 | |
| Alkylhydrogen peroxide reductase | lpg2965 | ahpC | 1.62 | 1.85 | |
| Heat shock protein | lpg2024 | dnaJ | 1.56 | 1.96 | |
| Heat shock protein | lpg2817 | yrfI | 1.62 | 2.77 | |
| Aminoglycoside 6-adenylyltransferase | lpg2151 | 1.80 | 3.01 | 2.11 | |
| Spectinomycin phosphotransferase | lpg1492 | 1.74 | 1.73 | ||
| Stress-induced protein | lpg2011 | 3.81 | 5.97 | ||
| Superoxide dismutase | lpg2348 | sodC | 2.45 | 2.88 | |
| Universal stress protein A | lpg0935 | 1.59 | |||
| Icm/dot effector | |||||
| Coiled-coil-containing protein | lpg1488 | legC5 | 1.75 | 1.05 | |
| F-box protein | lpg2144 | legAU13 | 1.07 | 1.74 | 2.11 |
| Hypothetical | lpg0096 | ceg4 | 2.69 | 2.16 | |
| Hypothetical | lpg2591 | ceg33 | 3.35 | 4.83 | |
| Hypothetical | lpg1290 | lem8 | 1.59 | 2.48 | 2.20 |
| Hypothetical | lpg1496 | lem10 | 1.51 | 2.79 | 3.28 |
| Protein SdhA | lpg0376 | sdhA | 1.31 | 1.60 | |
| Protein SidA | lpg0621 | sidA | 2.47 | ||
| Sid related protein-like | lpg2157 | sdeA | 2.33 | 1.60 | |
| UBOX-containing protein | lpg2830 | legU2 | 1.35 | 2.34 | |
| UVB-resistance protein | lpg1976 | legG1 | 1.66 | 1.65 | |
| Lipid metabolism | |||||
| 3-hydroxybutyrate dehydrogenase | lpg2316 | bdhA | 2.40 | 1.31 | |
| Other functions | |||||
| 6S RNA | ssrS | 3.65 | 3.55 | ||
| RsmY | rsmY | 2.57 | |||
| RsmZ | rsmZ | 1.58 | 1.80 | ||
| Signal transduction/other regulatory functions | |||||
| Response regulator TutC | lpg2146 | 2.39 | 1.10 | ||
| Sensor histidine kinase | lpg0230 | pleD | 2.95 | 2.27 | |
| Sensor protein LuxN | lpg2734 | 1.23 | 1.89 | ||
| Sensory box protein, GGDEF/EAL domain | lpg0029 | rre41 | 1.33 | 1.07 | |
| Sensory box protein, GGDEF/EAL domain | lpg1025 | yegE | 1.37 | 4.85 | 2.16 |
| Serine/threonine-protein kinase | lpg0208 | pkn5 | 1.25 | ||
| Sigma 54 modulation protein YhbH | lpg1206 | 3.95 | 4.04 | ||
| Signal transduction protein | lpg0156 | 3.11 | 5.19 | ||
| Toxin production / other pathogen functions | |||||
| Enhanced entry protein EnhA | lpg1336 | enhA | 1.10 | 2.06 | |
| Enhanced entry protein EnhA | lpg1386 | 1.28 | 1.31 | ||
| Enhanced entry protein EnhA | lpg2641 | enhA | 2.57 | 3.75 | |
| Enhanced entry protein EnhA | lpg0910 | enhA | 1.72 | 3.18 | |
| Enhanced entry protein EnhB | lpg2640 | enhB | 2.40 | ||
| Enhanced entry protein EnhC | lpg1172 | 2.58 | 5.87 | ||
| Enhanced entry protein EnhC | lpg1356 | 2.70 | 2.88 | ||
| RtxA | lpg0645 | 1.57 | 3.04 | ||
| Transcription | |||||
| DNA binding protein | lpg2441 | 1.79 | |||
| RNA polymerase sigma-54 factor | lpg0477 | 1.44 | |||
| Transcription repair coupling factor | lpg0954 | mfd | 2.04 | 2.14 | |
| Transcriptional regulator | lpg0586 | 1.24 | 3.75 | 4.48 | |
| Transcriptional regulator, ArsR family | lpg2723 | 3.63 | 1.18 | ||
| Transcriptional regulator, AsnC family | lpg1486 | 2.33 | |||
| Transcriptional regulator, DeoR family | lpg2167 | 1.76 | |||
| Transcriptional regulator, LuxR family | lpg2524 | 1.52 | 1.73 | ||
| Transcriptional regulator, LysR family | lpg2138 | 3.58 | 4.21 | ||
| Transcriptional regulator, MarR family | lpg2140 | 1.80 | 1.90 | ||
| Transport and binding | |||||
| IcmC (DotE) | lpg0453 | icmC | 1.27 | −1.11 | |
| IcmC homolog (DotV) | lpg0472 | 2.06 | 2.69 | ||
| IcmD (DotP) | lpg0454 | icmD | 1.25 | 1.77 | |
| IcmO (DotL) | lpg0446 | icmO | 2.07 | −1.50 | |
| IcmP (DotM) | lpg0445 | icmP | 2.15 | 3.54 | |
| IcmT | lpg0441 | icmT | 1.39 | 1.79 | −1.09 |
| IcmV | lpg2687 | icmV | 1.00 | −1.89 | |
| Erythromycin resistance protein/ABC transporter | lpg1616 | uup | 1.86 | 1.61 | |
| Multidrug resistance protein/efflux pump | lpg0257 | 2.67 | 3.09 | ||
| Multidrug resistance protein/efflux pump | lpg0429 | oprM | 1.12 | 1.65 | |
| Multidrug resistance protein/efflux pump | lpg2189 | ygjT | 1.76 | 2.28 | −1.85 |
| Viral functions/phage/transposases | |||||
| Prophage regulatory protein | lpg2563 | 1.22 | |||
| Transposase | lpg2120 | 2.01 | |||
| Transposase | lpg2363 | 1.65 | |||
aOnly values that were significantly different than the control are shown
Validation of microarray results by RT-qPCR
To validate the results of the microarray analysis, the expression profiles of ten different genes were confirmed by reverse transcription quantitative PCR (RT-qPCR) using 16 s rRNA as an internal control [41, 42]. These ten genes were selected from eight different orthologous groups.
According to the microarray data, six of the selected genes (lpg0586, lpg0846, lpg1206, lpg1659, lpg2316 (bdhA) and lpg2524) were significantly up-regulated in water at two or all three time points, while the remaining four genes (lpg0025, lpg0890, lpg1284 and lpg2487) were significantly down-regulated (Fig. 4a). The RT-qPCR results for these 10 genes are shown in Fig. 4b. Despite some differences, the general expression profiles were conserved between the microarray and RT-qPCR data, which validates the former.
Fig. 4.
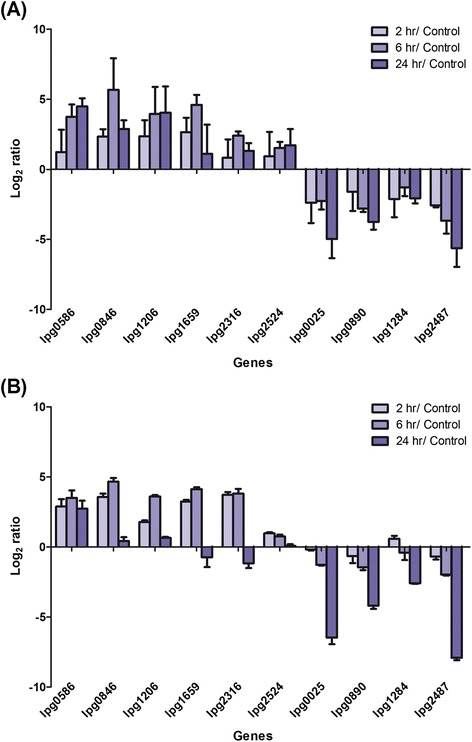
Microarray data is validated by RT-qPCR. Transcriptomic changes of ten selected JR32 genes upon water exposure shown by (a) microarray analysis and (b) RT-qPCR. Results are shown as the log2 ratio between the samples exposed to Fraquil for 2, 6 or 24 h and the control cultured in AYE broth
Antibiotic resistance of Lp subsequent to water exposure
Many genes involved in detoxification and adaptation were induced in water, including some associated with antibiotic resistance, such as an aminoglycoside 6-adenylyltransferase, a spectinomycin phosphotransferase, an erythromycin transporter and several efflux pumps (Table 2). The induction of these genes may increase the resistance of water-exposed Lp to antibiotics. To investigate this hypothesis, we compared the antibiotic resistance of Lp cultured in AYE broth to exponential phase and those exposed to Fraquil for 24 h. In both cases, we compared the CFU counts with and without the addition of a β-lactam (ampicillin), two aminoglycosides (gentamycin and kanamycin) and a macrolide (erythromycin). In order to determine the impact of temperature on antibiotic resistance, Lp was grown in AYE and exposed to Fraquil at both 25 °C and 37 °C prior to testing resistance.
There were no significant differences in the CFU counts between AYE-grown and Fraquil-exposed Lp treated with ampicillin (Fig. 5). Lp grown in AYE at 37 °C was more susceptible to erythromycin than Lp grown in AYE at 25 °C or Lp exposed to Fraquil at either temperature. Lp exposed to Fraquil was significantly more resistant to gentamycin than Lp grown in AYE broth, regardless of the temperature. Moreover, exposure to 37 °C seems to slightly increase susceptibility to gentamycin. Lp was more resistant to kanamycin after exposure to Fraquil than when grown in AYE, and this difference was more pronounced at 37 °C. Overall, Lp is more resistant to aminoglycosides after exposure to Fraquil, which is consistent with our prediction based on the transcriptomic data. Incubation temperature also seems to affect antibiotic resistance, especially against erythromycin.
Fig. 5.
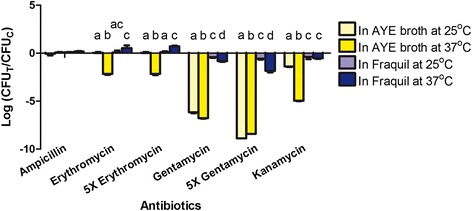
Lp exposed to water is more resistant to antibiotics. CFU changes of Lp cultured in AYE broth or exposed to Fraquil at 25 or 37 °C after antibiotic treatments. The antibiotics used include ampicillin, erythromycin, gentamycin and kanamycin, all at 100 μg/ml. 5X indicates a five times concentration of erythromycin and gentamycin (500 μg/ml) were used as well. The data are expressed as the log transformation of CFUs in treated wells (CFUT) divided by the CFUs in the control wells without antibiotics (CFUC). A negative value indicates a CFU reduction upon treatment. Data shows the mean +/− SD of three biological replicates. Different letters on the bars indicate significant differences between different samples in a particular treatment according to Tukey's test (p < 0.05). CFU changes between different treatments were not compared
Importance of bdhA for the survival of Lp in water
Genes that are significantly induced upon exposure to Fraquil may be important for Lp to survive in water. Upon this premise, the highly up-regulated bdhA gene was selected for further characterization. A deletion mutant of bdhA (ΔbdhA) and its complement (SPF236) were constructed. For the complementation, bdhA was cloned downstream of the Ptac promoter on pMMB207c. The wild-type strain KS79, ΔbdhA, SPF236 without isopropyl-β-D-thiogalactopyranoside (IPTG) (not induced) and SPF236 with 1 mM IPTG (induced) were exposed to Fraquil at 25 and 37 °C. CFU counts were monitored weekly and their survival was also assessed by Live/Dead staining after 19 weeks of exposure, when the CFUs of all strains at 37 °C dropped below the detection limit.
No survival defects were observed in the mutant strain compared to the wild-type or the complements in Fraquil at 25 °C (Fig. 6a). However, a minor reduction (1 log) in the CFU counts was observed in all strains after 20 weeks of water exposure. An overall faster drop in CFUs was observed in all strains at 37 °C, compared to 25 °C (Fig. 6b). The bdhA mutant strain showed a more rapid reduction in CFUs than the wild-type strain. This phenotype was complemented by expression of bdhA from the Ptac promoter in the presence of IPTG (SPF236 with IPTG). The CFU count of SPF236 without IPTG was similar to the bdhA mutant strain. Therefore, bdhA seems to be required for the survival of Lp in water at 37 °C.
Fig. 6.
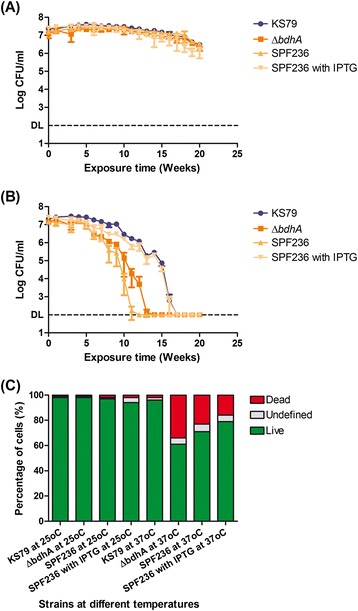
bdhA is important for long-term survival of Lp in water. Weekly CFU counts of the wild-type KS79, ΔbdhA and its complement SPF236 with and without IPTG exposed to Fraquil at (a) 25 °C and (b) 37 °C. 1 mM IPTG was used to induce bdhA on the plasmid of the complemented strain. Data show the mean +/− SD of three biological replicates. DL: Detection limit. c Percentage of live, undefined or dead cells of KS79, ΔbdhA and its complement SPF236 with and without IPTG. Live/Dead staining analysed by flow cytometry was performed after the strains were exposed to Fraquil for 19 weeks at 25 and 37 °C
Since the CFU counts of all strains exposed to 37 °C decreased below the detection limit after 19 weeks of water exposure, we sought to determine if the cells entered a viable but non-culturable (VBNC) state at this time point [43]. To this end, we used a Live/Dead staining procedure together with flow cytometry. At 25 °C, no significant differences in the percentage of viable cells were observed between strains (Fig. 6c), which is consistent with the CFU counts. On the other hand, the wild-type strain showed a small fraction of dead cells at 37 °C, which is not significant compared to 25 °C. In comparison, only 61 % cells of the bdhA mutant strain were stained as viable. The complemented strain exposed to water in the presence of IPTG had a higher percentage of viable cells but was still lower than that of the wild-type strain. Taken together with the CFU counts, our results show that Lp enters a VBNC state after 19 weeks of exposure to Fraquil at 37 °C.
Regulation of bdhA by RpoS
Hovel-Miner et al. [44] showed that the expression of bdhA in a rich medium is regulated by RpoS when Lp reaches the post-exponential phase. Moreover, transcriptomic analysis of the rpoS mutant in water suggests that the expression of bdhA is RpoS-dependant [31]. Therefore, we investigated this possibility of RpoS regulation of bdhA by using a green fluorescent protein (GFP) reporter assay [45]. Briefly, a plasmid carrying the PbdhA-GFP transcriptional fusion was constructed (pSF53) and transformed into JR32 and the rpoS mutant (JR32 pSF53 and rpoS pSF53). JR32 harbouring the pXDC31 plasmid, which expresses GFP from the Ptac promoter in the presence of IPTG, was used as positive control. JR32 and rpoS mutant strains with a plasmid containing no promoter upstream of the GFP encoding sequence (JR32 pSF78, rpoS pSF78) served as negative controls. Each strain was exposed to AYE broth or Fraquil for 24 h and the level of GFP in terms of green fluorescence signal was measured by flow cytometry.
A significantly higher level of GFP was found to be expressed in KS79 pSF53 exposed to Fraquil than that exposed to AYE broth, suggesting that the promoter of bdhA was more highly induced after 24 h in water (Fig. 7). This induction is consistent with the up-regulation of bdhA (lpg2316) observed in JR32 exposed to water for the same period of time during the transcriptomic analysis (Table 2). GFP expression in rpoS pSF53 was higher than in the negative controls under both conditions, but it was significantly lower than that of KS79 pSF53. In addition, no significant differences were found between rpoS pSF53 in AYE broth compared to Fraquil. These findings confirm that expression of bdhA in Lp is positively regulated by RpoS.
Fig. 7.
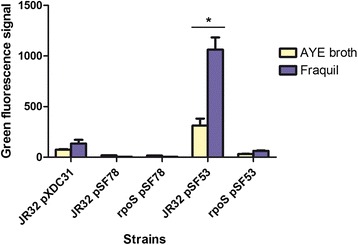
bdhA is highly induced in water and regulated by rpoS. Green fluorescence signal of five different strains after 24 h of exposure to AYE broth or Fraquil. JR32 pSF78, rpoS pSF78, JR32 pSF53 and rpoS pSF53 represent SPF265, SPF221, SPF266 and SPF211, respectively. JR32 pXDC31 was induced with 1 mM IPTG. Each sample had three biological replicates and the mean green fluorescence signal of 5000 cells in each replicate was detected by flow cytometry
Discussion
As a bacterium that lives in aqueous environments, Lp is frequently exposed to various stresses, such as fluctuations in temperature, pH and levels trace metals, as well as nutrient limitation [46]. Nutrient limitation, in particular, is a major concern as the nutrient levels in freshwater rarely fits the growth requirement of Lp, which is an auxotroph for at least eight amino acids [1, 47]. In the absence of essential nutrients or suitable hosts, Lp cannot grow, but can still persist in water for over one year [18]. Previous work has shown that the T2SS is important for the survival of Lp in water at low temperature [17]. However, no studies have investigated the global transcriptomic response of Lp to freshwater. In response to this knowledge gap, we performed a transcriptomic analysis to study the changes in gene expression of Lp exposed to Fraquil, an artificial freshwater medium composed of trace amounts of salts and metals, compared to Lp grown in rich medium (AYE broth). Since Lp in stationary phase culture is under nutrient limitation and stresses, using it as the control may hinder the opportunity to identify important genes for its survival in water. Therefore, Lp in the exponential phase of growth was used as the control.
In Fraquil, Lp maintained a stable population for at least 35 days and did not show any growth (Fig. 1a). Nevertheless, a significant reduction in cell size was found within 24 h of water exposure (Fig. 1d), which might be an adaptative response of Lp to nutrient limitation. In fact, the reduction of cell size is commonly observed in bacteria experiencing environmental stresses, such as nutrient limitation, suboptimal pH and low temperatures [48–52]. For example, the cell length of V. parahaemolyticus under starvation decreased drastically from 3.4 to 2.0 μm within 24 h [53]. Such a morphological change is believed to be a strategy to minimize the metabolic requirements for cell maintenance [54]. The mature intracellular form (MIF) of Lp, produced after passage through HeLa cells and Tetrahymena tropicalis, also shows a reduction in cell size, suggesting that this morphological change may be a response of Lp to nutrient limitation [55, 56].
The transcriptomic study of Lp revealed significant changes in gene expression following exposure to Fraquil. Since Fraquil does not contain any carbon sources that Lp can use, it is unable to grow in this medium (Fig. 1a). Consistent with this observation, expression of several amino acid transporters was induced in water (Table 1). Therefore, the reduced expression of three cell division proteins, such as ftsA, ftsQ and ftsW, was expected (Table 1). Moreover, bacteria tend to shut down major metabolic pathways when under starvation [57, 58]. Following exposure to water, genes involved in the electron transport chain (NADH dehydrogenase, succinate dehydrogenase, and cytochromes) and eight genes encoding subunits of the ATP synthase were significantly repressed (Table 1). This suggests a lower level of energy metabolism and thus, reduced metabolic activity in Lp, as the down-regulation of ATP synthase is usually found in dormant bacteria with a lower cellular ATP level [59]. Furthermore, compared to the control growing in AYE broth, the total RNA extracted from Lp exposed to water dropped markedly after 2 h and reduced to only one tenth of the control after 24 h (data not shown). This finding is consistent with the down-regulation of rpoA, rpoB and rpoC, which encode subunits of RNA polymerase, potentially resulting in less RNA polymerase available to bind to DNA and initiate transcription (Table 1).
In addition, most of the genes encoding 30S ribosomal proteins, 50S ribosomal proteins, translation initiation factors, translation elongation factors as well as tRNAs were down-regulated in water in two or all three time points tested (Table 1). In total, the expression of eight rpm genes, 18 rps genes and 19 rpl genes was significantly reduced (only some of these genes are shown in Table 1). In addition, lpg1206 was strongly induced in water. This gene encodes a homolog of YhbH, which is a short hibernation promoting factor (HPF) with a highly conserved function in γ-Proteobacteria [60]. Short HPF stabilizes the dimerization of two 70S ribosomes into a translationally inactive 100S ribosome by a ribosome modulation factor, resulting in ribosome hibernation [61]. Ribosome hibernation is commonly found in bacteria experiencing nutrient limitation and is rapidly reversible when nutrients become available once again [62, 63]. In E. coli, a mutant unable to form 100S ribosomes survived poorly in the post-exponential phase [64]. Therefore, it is possible that the up-regulation of lpg1206 in Lp may allow the formation of 100S ribosomes to maintain long-term survival in water, and the ability to resume growth or intracellular multiplication.
Our findings suggest that the translational machinery of Lp is shut down following exposure to water, which is a typical characteristic of the bacterial stringent response [65]. The stringent response is the reallocation of cellular resources in bacteria under nutrient limitation, by prohibiting the synthesis of DNA, stable RNAs, ribosomal proteins and membrane components, and activating the synthesis of factors involved in amino acid synthesis, glycolysis and stress resistance [65]. The massive transcriptomic changes during the stringent response are mediated by the synthesis and accumulation of guanosine tetraphosphate (ppGpp) and guanosine pentaphosphate (pppGpp), which are called (p)ppGpp collectively [65]. The stringent response in Lp has been studied in detail. Under amino acid limitation, the binding of uncharged tRNAs to the A site in ribosomes triggers the ribosomal-associated RelA protein to synthesize (p)ppGpp [29, 66, 67]. SpoT, the second stringent response protein, can also synthesize (p)ppGpp in response to other signals, such as perturbation of fatty acid synthesis [67, 68]. SpoT possesses a hydrolase activity as well, and therefore, regulates the level of (p)ppGpp and is necessary to terminate the stringent response [67]. In Lp, the stringent response, and the RelA and SpoT proteins are necessary for replication inside host cells and initiation of the transmissive phase [67, 68]. Our results clearly show a repression of the translational machinery, cell replication and changes in metabolic processes, which are consistent with the general transcriptional modulations caused by (p)ppGpp [69]. In addition, we have recently shown that the stringent response is required for the survival of Lp in water [31].
Due to the imminent shutdown of the translational machinery following water exposure, the important genes should be induced early on to allow the synthesis of their products when Lp is still translationally active. Therefore, in order to identify genes essential to maintain long-term survival in water, we examined those that are highly up-regulated within 24 h, a time point when a major metabolic shutdown started to appear. First, many genes associated with the biosynthesis of flagella, including different assembly, regulatory and structural proteins, are up-regulated in Lp exposed to water (some are listed in Table 2). This response is comparable to the response of Lp that reaches the late replicative phase inside host cells. Due to exploitation of host cell resources and consequent lack of nutrients, the transmissive phase of Lp is triggered, leading to the expression of virulence-associated traits such as flagella formation and other factors to promote release from the host [70, 71].
Many genes induced at early time points possess a function related to detoxification and adaptation (Fig. 3). Genes involved in resistance to oxidative stress were induced, including sodC, ahpC and ahpD. We also observed the induction heat shock proteins in water (Table 2). In E. coli, heat shock proteins are known to be induced by starvation [72]. They increase bacterial tolerance against various stresses by degrading and reactivating damaged proteins [73]. Therefore, it is plausible that the up-regulation of these genes may help Lp to persist in water under starvation conditions. In addition, many genes involved in antibiotic resistance were induced at early time points, including lpg1492 (spectinomycin phosphotransferase), lpg1616 (erythromycin transporter), lpg2151 (aminoglycoside 6-adenylyltransferase), and several efflux pumps (lpg0257, lpg0429, lpg1892, lpg2189). Increased resistance to antibiotics is a hallmark of Lp MIFs [55]. This phenomenon was also described after incubation of Lp in Acanthamoeba castellanii buffer at pH 6.5 [74]. Antibiotic resistance genes may be important for Lp to compete against antibiotic-producing microorganisms residing in water. In water, Lp is more resistant to gentamycin and kanamycin (aminoglycosides) than when it is cultured in rich medium (Fig. 5). Water-exposed Lp is also more resistant to erythromycin, but only at a temperature of 37 °C. Since all these antibiotics target the ribosome, it is also possible that the increased resistance is due to a decrease in translational activity, and not solely because of the expression of resistance genes.
Differential expression of some genes involved in virulence was also apparent. Despite the repression of 22 of the 26 structural genes of the Icm/Dot secretion system (Table 1), the expression of many Icm/Dot effectors was increased in water (Table 2). In addition, the enhanced-entry genes enhA and enhB, and several of the enhC homologs, as well as the rtxA toxin were induced in water at early time points. On the other hand, the macrophage infectivity potentiator gene, mip, was significantly down regulated in water. It is not clear at this point if these changes in expression of virulence genes affect the intracellular multiplication of Lp in host cells after incubation in water. We are currently investigating this possibility.
Many genes involved in transcriptional regulation were up-regulated, including numerous transcriptional regulators from different families, DNA binding proteins, a transcription repair coupling factor and the alternative sigma factor σ54 (RpoN) (Table 2). Interestingly, RpoN is important for the induction of fliA and other flagellar genes [70]. Consistent with previous observations, our results show up-regulation of both σ54 and flagellar genes in water.
Several response regulators, sensory proteins and signal transduction proteins involved in “signal transduction/other regulatory functions” were also up-regulated. Among these, many genes encoding proteins harbouring GGDEF/EAL domains were induced in water (some are listed in Table 2). These proteins are involved in the production and destruction of the second messenger c-di-GMP, and several of them have been shown to play a role in the interaction of Lp with host cells [75]. Some of them could play a role in sensing exposure to water and regulating the appropriate response. Moreover, expression of the two-component system LetA/S was reduced in water, while expression of the small RNAs RsmY and RsmZ under its control was increased. These sRNAs are necessary to relieve CsrA-mediated repression of transmissive phase traits upon starvation inside host cells [76]. Our results suggest that some of the genes repressed by CsrA could be involved in the survival of Lp in water. Interestingly, a link has been made between LetA/S, RpoS and (p)ppGpp [31, 44, 77, 78]. It is noteworthy that expression of the 6S RNA was also induced in water. 6S RNA binds to the RNA polymerase (RNAP) holoenzyme and inhibits its binding to promoters [79]. Since the affinity of 6S RNA to the RNAP depends on sigma factors, 6S RNA can shut down specific transcriptional programs. In E. coli, the σ70 regulon is turned off in the presence of 6S RNA [80]. In Lp, deletion of 6S RNA reduces fitness during intracellular growth [81]. Expression of 6S RNA in water could help Lp to switch between different transcriptomic programs, but further investigation is needed to confirm its involvement. There are also many other sRNAs that are differentially regulated, but since their targets are unknown, it is not yet possible to predict specific functions.
Within the highly up-regulated genes in water, we characterized bdhA, which is involved in the polyhydroxybutyrate (PHB) cycle [82]. PHB is an important storage polymer in bacteria, which is synthesized as a carbon and energy reserve in the presence of external nutrients and is consumed during starvation [83]. The bdhA gene encodes 3-hydroxybutyrate dehydrogenase, which oxidizes depolymerised PHB into acetoacetate and produces reducing power in the form of NADH [84]. Acetoacetate can, then, be further processed into acetyl-CoA, which enters the tricarboxylic acid cycle [84]. bdhA is dispensable for Lp growth in the presence of external nutrients, as mutations in this gene do not result in any observable growth defects in AYE broth [30]. However, Aurass et al. [85] demonstrated that a bdhA-patD mutant strain of Lp is defective in breaking down PHB accumulated during growth in a rich medium, resulting in a higher level of cellular PHB than the wild-type. In addition, this mutant has defects in intracellular growth in amoeba and in human macrophages [85]. Therefore, we hypothesize that bdhA is important for Lp to survive in water, enabling the extraction of carbon and reducing power from PHB in order to allow cell maintenance in the absence of an external energy source. Our results show that the deletion of bdhA reduces the survival of Lp in water. The ΔbdhA strain lost culturability and seems to have entered the VBNC state earlier, resulting in a higher percentage of mortality after 19 weeks of water exposure at 37 °C compared to the wild-type. This survival defect was successfully complemented, supporting the hypothesis that Lp needs BdhA for the complete degradation of PHB in order to maintain long-term survival in water. It is noteworthy that the difference in survival between ΔbdhA and the wild-type was only observed at 37 °C but not at 25 °C. Since the samples were exhausted after 20 weeks of sampling, we could not determine if the observed difference was eventually be mirrored at 25 °C after a longer period of water exposure. It is possible that survival at 37 °C requires more energy for cell maintenance than at 25 °C because of a higher metabolic rate, protein turnover and overall damage, and thus, the advantage conferred by BdhA is more apparent at the higher temperature.
In addition, we investigated the regulation of bdhA expression by RpoS when Lp is exposed to water. RpoS is a well-known regulator of the response to nutrient limitation [86]. Recently, we have shown that the stringent response and the sigma factor RpoS are necessary for the survival of Lp in water [31]. Based on a GFP reporter assay, we found that bdhA is positively regulated by RpoS following exposure to water (Fig. 7). This is consistent with the findings of Hovel-Miner et al. [44], which show that, in a rich medium, bdhA in Lp is positively regulated by RpoS in the post-exponential phase.
Conclusions
Our study reveals, for the first time, the global transcriptomic changes of Lp in water. Repression of major pathways, such as cell division, transcription and translation, suggests that Lp enters a quiescent state in water. The induction of the enhanced-entry genes (enh) and some Icm/Dot effectors suggests that Lp may be primed to infect a suitable host. Similarly, many genes involved in resistance to antibiotics and oxidative stress, as well as genes involved in the heat shock response were induced. Furthermore, the bdhA gene involved in the degradation pathway of the intracellular energy storage compound PHB is highly expressed and positively regulated by RpoS during short-term exposure to water. This gene was found to be important for maintaining long-term survival of Lp in water. There is no doubt that many of the genes highly induced upon exposure to water are also necessary for the short and/or long-term survival of Lp in water.
Methods
Bacterial strains and media
The JR32 strain used in this study is a derivative of Lp Philadelphia-1, which is a clinical isolate from the first recognized outbreak of Legionnaires’ disease in 1976 [87]. All Lp strains used in this study were derived from JR32 (Table 3). The rpoS mutant strain LM1376 was constructed by Hales and Shuman [88]. Unless specified otherwise, Lp was cultured on charcoal yeast extract (CYE) agar at 37 °C for 3 days [89]. The media were supplemented with 10 μg/ml gentamycin, 25 μg/ml kanamycin, and/or 1 mM IPTG when appropriate.
Table 3.
Bacterial strains used in this study
| Name | Relevant genotype | Reference |
|---|---|---|
| Legionella pneumophila strain Phiadelphia-1 | ||
| JR32 | SmR, r− m+ | [101] |
| JR32 pXDC31 | JR32 pXDC31, Ptac-GFP+, CmR | [102] |
| KS79 | JR32 ΔcomR | [99] |
| LM1376 | JR32 rpoS::Tn903dGent, GmR | [88] |
| SPF132 | KS79 pXDC39, CmR | This work |
| SPF194 | KS79 ΔbdhA, GmR | This work |
| SPF211 | LM1376 pSF53, GmR CmR | This work |
| SPF221 | LM1376 pSF78, GmR CmR | This work |
| SPF236 | SPF194 pSF67, CmR | This work |
| SPF265 | JR32 pSF78, CmR | This work |
| SPF266 | JR32 pSF53, CmR | This work |
| Escherichia coli | ||
| DH5α | supE44 ΔlacU169 (Φ80 lacZΔM15) hsdR17 recA1 endA1 gyrA96 thi-1 relA1 | Invitrogen |
| pBBR1-MCS5 | DH5α, GmR | [103] |
| pMMB207c | DH5α, pMMB207 ΔmobA, CmR | [104] |
| pXDC39 | DH5α, pMMB207c, ΔPtac, ΔlacI | Xavier Charpentier |
| pSF53 | DH5α, PbdhA-GFP in pXDC39, CmR | This work |
| pSF67 | DH5α, pMMB207c-bdhA, CmR | This work |
| pSF78 | DH5α, GFP in pXDC39, CmR | This work |
Escherichia coli DH5α was used for plasmid construction. E. coli was cultured in Luria-Bertani (LB) broth or on LB agar at 37 °C overnight, which were supplemented with 25 μg/ml chloramphenicol when appropriate.
The artificial freshwater medium Fraquil was made with ultra-pure Milli-Q water supplemented with salts and trace metals, at a final concentration of 0.25 μM CaCl2, 0.15 μM MgSO4, 0.15 μM NaHCO3, 10 nM K2HPO4, 0.1 μM NaNO3, 10 nM FeCl3, 1 nM CuSO4, 0.22 nM (NH4)6Mo7O24, 2.5 nM CoCl2, 23 nM MnCl2, and 4 nM ZnSO4 [39].
Transcriptomic analysis by microarray
Sample collection. JR32 was first cultured on CYE plate at 37 °C for 3 days. The colonies were suspended in AYE broth at an OD600 of 0.1. Three replicates of this culture were grown under shaking (250 rpm) at 25 °C. Samples for RNA extraction, Live/Dead staining and CFU count were collected from each replicate when the culture reached exponential phase (OD600 of 1.0). Then, the remaining culture was centrifuged and washed with Fraquil three times before re-suspending in Fraquil to an OD600 of 1.0. Each replicate was then transferred to a BIOSTAT® Q Plus bioreactor vessel (Satorius Stedim Biotech). The temperature was kept constant at 25 °C. Dissolved oxygen was kept constant at around 80 %, by using a stirrer (100 rpm) and injection of air (0.1 bar). Samples for RNA extraction, Live/Dead staining and CFU counts were collected from the vessels after 2, 6 and 24 h of water exposure.
RNA purification and labelling. Cells in each sample were pelleted and RNA was extracted using TRIzol reagent (Ambion) according to the manufacturer’s protocol. RNA was then treated with Turbo DNase (Ambion) for 30 min and purified by standard acid phenol extraction [90]. Purified RNA was checked by a NanoDrop® spectrophotometer and PCR to estimate the quantity and quality, as well as to confirm purity. As described by Faucher and Shuman [91], fifteen μg of purified RNA was reverse transcribed into cDNA using random hexamers, aminoallyl dUTP (Invitrogen) and Superscript II reverse transcriptase (Life Sciences) before labeling with Alexa Fluor 647 (Invitrogen). gDNA extracted from JR32 was labelled with Alexa Fluor 546 (Invitrogen) by random priming as described previously [91].
Microarray design and hybridization. Gene-specific 50-mer oligonucleotides were designed based on the genome of Lp strain Philadelphia-1 using OligoWiz software version 2.2.0 [92, 93]. The probes were designed to hybridize to the center of the target RNAs and prokaryotic settings with default parameters were used. The microarray was produced by photolithography by MYcroarray [94]. Four replicates of each probe as well as the negative and positive probes designed by MYcroarray were included on the DNA microarray. The platform is described in GEO accession number GPL19458. The labelled cDNA and gDNA, used as a reference channel, were hybridized onto the microarray as described previously [91]. The microarray was scanned with an InnoScan microarray scanner (Innopsys) and the data collected was normalized [95, 96]. Statistical analysis between the control (JR32 cultured in AYE broth) and treatments (JR32 exposed to Fraquil for 2, 6 or 24 h) was performed using a paired, one-tailed Student’s t-test. The genes with a log2 ratio of Treatment/Control >1 or < −1 and p < 0.05 were considered differentially expressed. The complete dataset was deposited in GEO (GSE63622).
RT-qPCR
RNA was extracted and purified from JR32 exposed to AYE broth and Fraquil as described above. Each control or treatment consisted of three biological replicates. One μg of RNA was used for reverse transcription reactions along with a negative control without reverse transcriptase. For qPCR reactions, eleven sets of gene-specific primers were designed with the IDT primer design software [97] (Table 4) and their amplification efficiency were proven to be >85 %. qPCR was performed on an iQ™5 Multicolor Real-Time PCR Detection System (Bio-Rad) using iTaq universal SYBR green supermix (Bio-Rad) according to manufacturer’s protocol. The 16S rRNA gene was used as a reference to normalize the data. Fold change was calculated as described previously [98] and then presented as a log2 ratio of Treatment/Control.
Table 4.
Primer sequences used in this study
| Name | Purpose | Sequence (5’➔3’)a |
|---|---|---|
| 16 s_QF | 16 s rRNA qPCR | AGAGATGCATTAGTGCCTTCGGGA |
| 16 s_QR | 16 s rRNA qPCR | ACTAAGGATAAGGGTTGCGCTCGT |
| 25_QF | lpg0025 qPCR | ATTCCCATCGCCATTTAGAG |
| 25_QR | lpg0025 qPCR | CAACCCGAGAGGTAACTAATAC |
| 586_QF | lpg0586 qPCR | GTGGCGTTCCAGTTTGT |
| 586_QR | lpg0586 qPCR | CTGTCCAGGCAGCATAAC |
| 846_QF | lpg0846 qPCR | GGTAGAAGGCGATGGTTATC |
| 846_QR | lpg0846 qPCR | GCCTTCCGGTGGTAATAAA |
| 890_QF | lpg0890 qPCR | CCTTCCAATCCCATGCTAAAG |
| 890_QR | lpg0890 qPCR | GTCAAATCCGAGTTCAAGAGG |
| 1206_QF | lpg1206 qPCR | GCGTCATGAGGATTCTATTCG |
| 1206_QR | lpg1206 qPCR | GGCCTGTAAATCGTATCAGAC |
| 1284_QF | lpg1284 qPCR | GTTTATCTCAGAGCGGCAAG |
| 1284_QR | lpg1284 qPCR | GACATCCTCCAAAGGCTTATC |
| 1659_QF | lpg1659 qPCR | CGGTCACTCTTTGGTATATGTC |
| 1659_QR | lpg1659 qPCR | CTGATTGACTGGATCGAACATC |
| 2316_QF | lpg2316 qPCR | GCCATGTAGCAGAGGAAATC |
| 2316_QR | lpg2316 qPCR | CTTTATCCACGCCCTGATTG |
| 2487_QF | lpg2487 qPCR | TCTGTATCTCGGAGCCTATG |
| 2487_QR | lpg2487 qPCR | GTGGCCTAAACCTGATCTTG |
| 2524_QF | lpg2524 qPCR | CGCCTGGTATAAAGAACTGC |
| 2524_QR | lpg2524 qPCR | GAGGCGAAGGTAACCATTTC |
| bdhA_UpF | Mutant | AGTTCAATACAATCCTTGGTCGC |
| bdhA_UpR | Mutant | CACGAATTCCTTTTACTATCCTTGTCATTG |
| bdhA_GnF | Mutant | CGCGAATTCAACGGCATGATGAACCTGAAT |
| bdhA_GnR | Mutant | CACTCTAGATTAGGTGGCGGTACTTGGGTC |
| bdhA_DownF | Mutant | CGCTCTAGAACAACCATGACTCGAACTAAAAAATCT |
| bdhA_DownR | Mutant | CTTTTGAAGACAATTCCGTTTCAT |
| Com_bdhA_F | Complement | CGCGAGCTCGACAAGGATAGTAAAAGAATGAAACTGAAG |
| Com_bdhA_R | Complement | CGCTCTAGATCATGGTTGTTTACTCCATGAACC |
| PromF | Complement | CGTATAATGTGTGGAATTGTGAG |
| pXDC39-F | GFP assay | GCTTCCACAGCAATGGCATCC |
| GFP-R | GFP assay | TGTCGACAGGTAATGGTTGTC |
| GFP_bdhA_F | GFP assay | CGCTCTAGACATAGGGATATCAACCACTACG |
| GFP_bdhA_R | GFP assay | CGCTCTAGATCTTTTACTATCCTTGTCATTG |
aThe underlined bases indicate different enzyme restriction sites
Antibiotic resistance test
Cultures of JR32 in AYE broth (OD600 of 0.1) were incubated under shaking (250 rpm) at 25 and 37 °C until they reached the exponential phase (OD600 of 1.0). For each culture, a 21 ml sample was used for antibiotic exposure and the remainder was centrifuged and washed with Fraquil three times before re-suspending in Fraquil to an OD600 of 1.0. The samples were left to incubate in the same condition as before (250 rpm, 25 or 37 °C). After 24 h, a 21 ml sample was again collected from each culture for antibiotic exposure. The procedure of antibiotic exposure was adapted from a previous study [74]. Briefly, one ml aliquots were put in 21 wells (triplicates for control and each of the six treatments) of a 24-well plate (Sarstedt). No antibiotics were added to the control. The six treatments were 100 μg/ml ampicillin, 100 or 500 μg/ml erythromycin, 100 or 500 μg/ml gentamycin and 100 μg/ml kanamycin. The plate was then incubated at 37 °C for 40 min, and the changes in CFU counts between the controls and the treatments were calculated.
Mutant construction and complementation
For the construction of the bdhA deletion mutant, SPF194, 1 kb of the sequences upstream and downstream of bdhA were first amplified from KS79 using Taq polymerase (Invitrogen), using the primer sets bdhA_UpF/bdhA_UpR and bdhA_DownF/bdhA_DownR, respectively (Table 4). A gentamycin cassette was amplified from pBBR1-MCS5 using the primer set bdhA_GnF/bdhA_GnR (Table 4). Both bdhA_UpR and bdhA_GnF contain an EcoRI restriction site, while bdhA_GnR and bdhA_DownF contain an XbaI restriction site. All three fragments were digested with EcoRI and/or XbaI (NEB) before ligating with T4 DNA ligase (NEB). The ligation mixture was amplified by PCR using Phusion taq polymerase (NEB) to amplify the 3 kb mutant allele and the purified amplicon was introduced into KS79 through natural transformation [99]. KS79 is constitutively competent due to the lack of comR, a negative regulator of competence. The recombinants were selected for gentamycin resistance and successful deletion of bdhA was validated by PCR.
For the construction of complemented strain, SPF236, the bdhA gene was first amplified from KS79 using primers Com_bdhA_F and Com_bdhA_R, which contain SacI or XbaI restriction sites, respectively. The location of SacI and XbaI restriction site in pMMB207c allowed the bdhA gene to be inserted downstream of the Ptac promoter, allowing the expression of bdhA to be induced by IPTG. The amplicon and the pMMB207c plasmid were both digested with SacI and XbaI (NEB) before ligating with T4 DNA ligase (NEB). The ligation mixture was transformed into competent E. coli DH5α and the transformants were selected for chloramphenicol resistance. The presence of bdhA in the plasmid extracted from transformants was validated by PCR using the primers PromF, which hybridizes to the Ptac promoter in pMMB207c, and Com_bdhA_R. Subsequently, this plasmid pSF67 was introduced into SPF194 by electroporation as described by Chen et al. [100] and selected for gentamycin and chloramphenicol resistance before validation by PCR.
Survival in Fraquil
The wild-type strain KS79, the bdhA mutant (SPF194) and the complemented strain (SPF236) were first suspended in Fraquil to an OD600 of 0.1. One ml of this culture was mixed with 4 ml of fresh Fraquil, transferred to a 25 cm2 plastic flask (Sarstedt) and incubated at 25 or 37 °C. Three replicates were prepared for KS79, ΔbdhA, the bdhA complement, as well as the bdhA complement induced with 1 mM IPTG (Fisher Scientific). The culturability of Lp in water was determined weekly by CFU counts on CYE plates. After 19 weeks, the viability was assessed with Live/Dead staining as described below, using KS79 as the control.
Live/Dead staining
The BacLight™ LIVE/DEAD® bacterial viability kit (Life Technologies) was used to stain the controls and samples according to the manufacturer’s protocol. The Guava easyCyte flow cytometer (EMD Millipore) was used for data acquisition and analysis. Stained Fraquil was used as a blank for instrument setting. Freshly cultured JR32 was used as the live control and JR32 boiled in a water bath for 10 min was used as the dead control for data analysis. Both controls and samples were diluted to an OD600 of 0.01 before staining and flow cytometry analysis.
GFP reporter assay
The JR32 strain carying pXDC31 containing the Ptac promoter upstream of the GFP encoding sequence was used as the positive control. For the construction of negative control strains, the plasmids pXDC39 (pMMB207c without Ptac) and pXDC31 were first extracted from SPF132 and JR32 pXDC31, respectively, before digesting with SacI and XmnI (NEB). The GFP encoding sequence from pXDC31 was gel purified and ligated with the digested pXDC39 using T4 DNA ligase (NEB). The ligation mixture was transformed into competent E. coli DH5α and the transformants were selected for chloramphenicol resistance. The presence of the GFP sequence in the plasmid extracted from transformants was validated by PCR using the primers pXDC39-F and GFP-R. Subsequently, this plasmid, pSF78, was introduced into JR32 and LM1376 (rpoS mutant) by electroporation to produce SPF265 and SPF221, respectively. Because of the lack of a promoter upstream of the GFP encoding sequence, these two strains do not express GFP.
For the construction of GFP reporter strains, the 500 bp sequence upstream of bdhA, containing the promoter region, was first amplified from KS79 using the primer set GFP_bdhA_F/GFP_bdhA_R with an XbaI restriction site at the 5’ ends. The amplicon and the plasmid pSF78 were digested with XbaI (NEB) and ligated with T4 DNA ligase (NEB). The ligation mixture was transformed into E. coli DH5α and the transformants were selected for chlorampheniol resistance. The presence and correct orientation of the inserted promoter in plasmid extracted from transformants were validated by PCR using GFP_bdhA_F and GFP-R. Subsequently, this plasmid, pSF53, was introduced into KS79 or LM1376 by electroporation to produce SPF266 and SPF211, respectively. The location of the XbaI restriction site in pSF78 allowed the promoter region of bdhA (PbdhA) to be inserted upstream of the GFP encoding sequence, thus the induction of PbdhA would result in GFP expression.
For the GFP reporter assay, JR32 pXDC31, SPF265, SPF221, SPF266 as well as SPF211 were suspended in AYE broth at an OD600 of 0.1 and in Fraquil at an OD600 of 1.0. IPTG (1 mM) was added to the JR32 pXDC31 cultures. All cultures, with three biological replicates each, were incubated at 25 °C and 250 rpm for 24 h, at which point those in AYE broth had reached the exponential phase (OD600 of around 1.0). All samples were diluted to an OD600 of 0.01 before measuring the green fluorescence signal by flow cytometry.
Availability of supporting data
The complete microarray data supporting the results of this article is available in the Gene Expression Omnibus repository, [GSE63622; http://www.ncbi.nlm.nih.gov/geo/query/acc.cgi?acc=GSE63622].
Acknowledgments
This work was supported by the NSERC Discovery grant 418289–2012 and John R. Evans Leaders Fund – Funding for research infrastructure from the Canadian Foundation for Innovation to SPF. We would like to thank Dr. Xavier Charpentier for the pXDC39 strain.
Abbreviations
- AYE
ACES-buffered yeast extract
- CFU
Colony-forming units
- CYE
Charcoal yeast extract
- FSC
Forward scatter
- GFP
Green fluorescent protein
- HPF
Hibernation promoting factor
- IPTG
Isopropyl-β-D-thiogalactopyranoside
- LD
Legionnaires’ disease
- Lp
Legionella pneumophila
- MIF
Mature intracellular form
- PHB
Polyhydroxybutyrate
- (p)ppGpp
Guanosine tetraphosphate and guanosine pentaphosphate
- RNAP
RNA polymerase
- RT-qPCR
Reverse transcription quantitative PCR
- T2SS
Type II secretion system
- T4BSS
Type IVB secretion system
- VBNC
Viable but non-culturable
Additional file
Lp genes that are significantly up- or down-regulated in water. (XLSX 366 kb)
Footnotes
Competing interests
The authors declare that they have no competing interests.
Authors’ contributions
LL conducted the experiments. NM constructed the pSF78 strain and HT constructed the SPF194 strain. LL and SPF wrote the manuscript and NM and HT reviewed it. All authors read and approved the final manuscript.
Contributor Information
Laam Li, Email: laam.li@mail.mcgill.ca.
Nilmini Mendis, Email: nissanka.mendis@mail.mcgill.ca.
Hana Trigui, Email: hana.trigui@mcgill.ca.
Sébastien P. Faucher, Phone: 514-398-7886, Email: sebastien.faucher2@mcgill.ca
References
- 1.Fields BS, Benson RF, Besser RE. Legionella and Legionnaires' disease: 25 years of investigation. Clin Microbiol Rev. 2002;15(3):506–26. doi: 10.1128/CMR.15.3.506-526.2002. [DOI] [PMC free article] [PubMed] [Google Scholar]
- 2.Fraser DW, Tsai TR, Orenstein W, Parkin WE, Beecham HJ, Sharrar RG, Harris J, Mallison GF, Martin SM, McDade JE. Legionnaires' disease: description of an epidemic of pneumonia. New Engl J Med. 1977;297(22):1189–97. doi: 10.1056/NEJM197712012972201. [DOI] [PubMed] [Google Scholar]
- 3.Mittal R, Agrawal A, Roach R, Buckley T, Tiwari AK. Acquired Legionnaire’s disease through aerosolization of water from natural sources. Trans Clin Biol. 2013;1(1):6–9. doi: 10.14259/tcb.v1i1.61. [DOI] [Google Scholar]
- 4.Creasey EA, Isberg RR. The protein SdhA maintains the integrity of the Legionella-containing vacuole. Proc Natl Acad Sci. 2012;109(9):3481–6. doi: 10.1073/pnas.1121286109. [DOI] [PMC free article] [PubMed] [Google Scholar]
- 5.Phin N, Parry-Ford F, Harrison T, Stagg HR, Zhang N, Kumar K, Lortholary O, Zumla A, Abubakar I. Epidemiology and clinical management of Legionnaires' disease. Lancet Infect Dis. 2014;14(10):1011–21. doi: 10.1016/S1473-3099(14)70713-3. [DOI] [PubMed] [Google Scholar]
- 6.Centers for Disease Control and Prevention Increasing incidence of Legionellosis in the United States, 2000–2009. Morbidity and Mortality Weekly Report. 2011;60:1083–6. [PubMed] [Google Scholar]
- 7.European Centre for Disease Prevention and Control . Annual epidemiological report 2013: Reporting on 2011 surveillance data and 2012 epidemic intelligence data. Stockholm: ECDC; 2013. [Google Scholar]
- 8.Garcia-Vidal C, Labori M, Viasus D, Simonetti A, Garcia-Somoza D, Dorca J, Gudiol F, Carratalà J. Rainfall is a risk factor for sporadic cases of Legionella pneumophila pneumonia. PloS One. 2013;8(4) doi: 10.1371/journal.pone.0061036. [DOI] [PMC free article] [PubMed] [Google Scholar]
- 9.Nygård K, Werner-Johansen Ø, Rønsen S, Caugant DA, Simonsen Ø, Kanestrøm A, Ask E, Ringstad J, Ødegård R, Jensen T, et al. An outbreak of Legionnaires disease caused by long-distance spread from an industrial air scrubber in Sarpsborg. Norway. Clin Infect Dis. 2008;46(1):61–9. doi: 10.1086/524016. [DOI] [PubMed] [Google Scholar]
- 10.White PS, Graham FF, Harte DJG, Baker MG, Ambrose CD, Humphrey ARG. Epidemiological investigation of a Legionnaires' disease outbreak in Christchurch, New Zealand: the value of spatial methods for practical public health. Epidemiol Infect. 2013;141(04):789–99. doi: 10.1017/S0950268812000994. [DOI] [PMC free article] [PubMed] [Google Scholar]
- 11.McFeters GA, Bissonnette GK, Jezeski JJ, Thomson CA, Stuart DG. Comparative survival of indicator bacteria and enteric pathogens in well water. Appl Microbiol. 1974;27(5):823–9. doi: 10.1128/am.27.5.823-829.1974. [DOI] [PMC free article] [PubMed] [Google Scholar]
- 12.Filip Z, Demnerova K. Management of Intentional and Accidental Water Pollution. Netherlands: Springer; 2006. Microbial resistance to chemical contaminants-an essential precondition of natural attenuation in groundwater aquifer; pp. 113–27. [Google Scholar]
- 13.Chandran A, Varghese S, Kandeler E, Thomas A, Hatha M, Mazumder A. An assessment of potential public health risk associated with the extended survival of indicator and pathogenic bacteria in freshwater lake sediments. Int J Hyg Environ Health. 2011;214(3):258–64. doi: 10.1016/j.ijheh.2011.01.002. [DOI] [PubMed] [Google Scholar]
- 14.Skaliy P, McEachern HV. Survival of the Legionnaires' disease bacterium in water. Ann Intern Med. 1979;90(4):662–3. doi: 10.7326/0003-4819-90-4-662. [DOI] [PubMed] [Google Scholar]
- 15.Schofield GM. A note on the survival of Legionella pneumophila in stagnant tap water. J Appl Bacteriol. 1985;59(4):333–5. doi: 10.1111/j.1365-2672.1985.tb03327.x. [DOI] [PubMed] [Google Scholar]
- 16.Lee J, West A. Survival and growth of Legionella species in the environment. J Appl Bacteriol. 1991;70:121S–9. doi: 10.1111/j.1365-2672.1991.tb04437.x. [DOI] [PubMed] [Google Scholar]
- 17.Söderberg MA, Dao J, Starkenburg SR, Cianciotto NP. Importance of type II secretion for survival of Legionella pneumophila in tap water and in amoebae at low temperatures. Appl Environ Microbiol. 2008;74(17):5583–8. doi: 10.1128/AEM.00067-08. [DOI] [PMC free article] [PubMed] [Google Scholar]
- 18.Paszko-Kolva C, Shahamat M, Colwell RR. Long-term survival of Legionella pneumophila serogroup 1 under low-nutrient conditions and associated morphological changes. FEMS Microbiol Lett. 1992;102(1):45–55. doi: 10.1111/j.1574-6968.1992.tb05794.x. [DOI] [Google Scholar]
- 19.Gomez-Valero L, Rusniok C, Jarraud S, Vacherie B, Rouy Z, Barbe V, et al. Extensive recombination events and horizontal gene transfer shaped the Legionella pneumophila genomes. BMC Genomics. 2011;12:536. doi: 10.1186/1471-2164-12-536. [DOI] [PMC free article] [PubMed] [Google Scholar]
- 20.De Buck E, Anné J, Lammertyn E. The role of protein secretion systems in the virulence of the intracellular pathogen Legionella pneumophila. Microbiology. 2007;153(12):3948–53. doi: 10.1099/mic.0.2007/012039-0. [DOI] [PubMed] [Google Scholar]
- 21.Isberg RR, O'Connor TJ, Heidtman M. The Legionella pneumophila replication vacuole: making a cosy niche inside host cells. Nat Rev Microbiol. 2009;7(1):13–24. doi: 10.1038/nrmicro1967. [DOI] [PMC free article] [PubMed] [Google Scholar]
- 22.Hubber A, Roy CR. Modulation of host cell function by Legionella pneumophila type IV effectors. Ann Rev Cell Dev Biol. 2010;26:261–83. doi: 10.1146/annurev-cellbio-100109-104034. [DOI] [PubMed] [Google Scholar]
- 23.Newton HJ, Ang DKY, van Driel IR, Hartland EL. Molecular pathogenesis of infections caused by Legionella pneumophila. Clin Microbiol Rev. 2010;23(2):274–98. doi: 10.1128/CMR.00052-09. [DOI] [PMC free article] [PubMed] [Google Scholar]
- 24.Gomez-Valero L, Rusniok C, Cazalet C, Buchrieser C. Comparative and functional genomics of Legionella identified eukaryotic like proteins as key players in host-pathogen interactions. Front Microbiol. 2011;2:208. doi: 10.3389/fmicb.2011.00208. [DOI] [PMC free article] [PubMed] [Google Scholar]
- 25.Cianciotto NP, Eisenstein BI, Mody CH, Toews GB, Engleberg NC. A Legionella pneumophila gene encoding a species-specific surface protein potentiates initiation of intracellular infection. Infect Immun. 1989;57(4):1255–62. doi: 10.1128/iai.57.4.1255-1262.1989. [DOI] [PMC free article] [PubMed] [Google Scholar]
- 26.Cirillo SLG, Lum J, Cirillo JD. Identification of novel loci involved in entry by Legionella pneumophila. Microbiology. 2000;146(6):1345–59. doi: 10.1099/00221287-146-6-1345. [DOI] [PubMed] [Google Scholar]
- 27.Gal-Mor O, Segal G. The Legionella pneumophila GacA homolog (LetA) is involved in the regulation of icm virulence genes and is required for intracellular multiplication in Acanthamoeba castellanii. Microb Pathog. 2003;34(4):187–94. doi: 10.1016/S0882-4010(03)00027-5. [DOI] [PubMed] [Google Scholar]
- 28.Gal-Mor O, Segal G. Identification of CpxR as a positive regulator of icm and dot virulence genes of Legionella pneumophila. J Bacteriol. 2003;185(16):4908–19. doi: 10.1128/JB.185.16.4908-4919.2003. [DOI] [PMC free article] [PubMed] [Google Scholar]
- 29.Zusman T, Gal-Mor O, Segal G. Characterization of a Legionella pneumophila relA insertion mutant and roles of RelA and RpoS in virulence gene expression. J Bacteriol. 2002;184(1):67–75. doi: 10.1128/JB.184.1.67-75.2002. [DOI] [PMC free article] [PubMed] [Google Scholar]
- 30.O’Connor TJ, Adepoju Y, Boyd D, Isberg RR. Minimization of the Legionella pneumophila genome reveals chromosomal regions involved in host range expansion. Proc Natl Acad Sci. 2011;108(36):14733–40. doi: 10.1073/pnas.1111678108. [DOI] [PMC free article] [PubMed] [Google Scholar]
- 31.Trigui H, Dudyk P, Oh J, Hong J-I, Faucher SP. A regulatory feedback loop between RpoS and SpoT supports the survival of Legionella pneumophila in water. Appl Environ Microbiol. 2014:AEM. 03132–03114. [DOI] [PMC free article] [PubMed]
- 32.Ishihama A. Functional modulation of Escherichia coli RNA polymerase. Ann Rev Microbiol. 2000;54(1):499–518. doi: 10.1146/annurev.micro.54.1.499. [DOI] [PubMed] [Google Scholar]
- 33.Hecker M, Reder A, Fuchs S, Pagels M, Engelmann S. Physiological proteomics and stress/starvation responses in Bacillus subtilis and Staphylococcus aureus. Res Microbiol. 2009;160(4):245–58. doi: 10.1016/j.resmic.2009.03.008. [DOI] [PubMed] [Google Scholar]
- 34.Redon E, Loubière P, Cocaign-Bousquet M. Role of mRNA stability during genome-wide adaptation of Lactococcus lactis to carbon starvation. J Biol Chem. 2005;280(43):36380–5. doi: 10.1074/jbc.M506006200. [DOI] [PubMed] [Google Scholar]
- 35.Tralau T, Vuilleumier S, Thibault C, Campbell BJ, Hart CA, Kertesz MA. Transcriptomic analysis of the sulfate starvation response of Pseudomonas aeruginosa. J Bacteriol. 2007;189(19):6743–50. doi: 10.1128/JB.00889-07. [DOI] [PMC free article] [PubMed] [Google Scholar]
- 36.Lu J, Struewing I, Buse HY, Kou J, Shuman HA, Faucher SP, Ashbolt NJ. Legionella pneumophila transcriptional response following exposure to CuO nanoparticles. Appl Environ Microbiol. 2013;79(8):2713–20. doi: 10.1128/AEM.03462-12. [DOI] [PMC free article] [PubMed] [Google Scholar]
- 37.Portier E, Zheng H, Sahr T, Burnside DM, Mallama C, Buchrieser C, et al. IroT/mavN, a new iron‐regulated gene involved in Legionella pneumophila virulence against amoebae and macrophages. Environ Microbiol. 2014. [DOI] [PMC free article] [PubMed]
- 38.Chang D-E, Smalley DJ, Conway T. Gene expression profiling of Escherichia coli growth transitions: an expanded stringent response model. Mol Microbiol. 2002;45(2):289–306. doi: 10.1046/j.1365-2958.2002.03001.x. [DOI] [PubMed] [Google Scholar]
- 39.Morel FMM, Westall JC, Rueter JG, Chaplick JP. Technical Note 16. Cambridge: Massachusetts Institute of Technology; 1975. Description of the algal growth media “Aquil” and “Fraquil”. [Google Scholar]
- 40.Koch AL, Robertson BR, Button DK. Deduction of the cell volume and mass from forward scatter intensity of bacteria analyzed by flow cytometry. J Microbiol Methods. 1996;27(1):49–61. doi: 10.1016/0167-7012(96)00928-1. [DOI] [Google Scholar]
- 41.Templeton KE, Scheltinga SA, Sillekens P, Crielaard JW, van Dam AP, Goossens H, Claas ECJ. Development and clinical evaluation of an internally controlled, single-tube multiplex real-time PCR assay for detection of Legionella pneumophila and other Legionella species. J Clin Microbiol. 2003;41(9):4016–21. doi: 10.1128/JCM.41.9.4016-4021.2003. [DOI] [PMC free article] [PubMed] [Google Scholar]
- 42.Faucher SP, Mueller CA, Shuman HA. Legionella pneumophila transcriptome during intracellular multiplication in human macrophages. Front Microbiol. 2011;2:60. doi: 10.3389/fmicb.2011.00060. [DOI] [PMC free article] [PubMed] [Google Scholar]
- 43.Li L, Mendis N, Trigui H, Oliver JD, Faucher SP. The importance of the viable but non-culturable state in human bacterial pathogens. Front Microbiol. 2014;5:258. doi: 10.3389/fmicb.2014.00258. [DOI] [PMC free article] [PubMed] [Google Scholar]
- 44.Hovel-Miner G, Pampou S, Faucher SP, Clarke M, Morozova I, Morozov P, Russo JJ, Shuman HA, Kalachikov S. σS controls multiple pathways associated with intracellular multiplication of Legionella pneumophila. J Bacteriol. 2009;191(8):2461–73. doi: 10.1128/JB.01578-08. [DOI] [PMC free article] [PubMed] [Google Scholar]
- 45.Köhler R, Bubert A, Goebel W, Steinert M, Hacker J, Bubert B. Expression and use of the green fluorescent protein as a reporter system in Legionella pneumophila. Mol Gen Genet. 2000;262(6):1060–9. doi: 10.1007/PL00008649. [DOI] [PubMed] [Google Scholar]
- 46.Ohno A, Kato N, Yamada K, Yamaguchi K. Factors influencing survival of Legionella pneumophila serotype 1 in hot spring water and tap water. Appl Environ Microbiol. 2003;69(5):2540–7. doi: 10.1128/AEM.69.5.2540-2547.2003. [DOI] [PMC free article] [PubMed] [Google Scholar]
- 47.George JR, Pine L, Reeves MW, Harrell WK. Amino acid requirements of Legionella pneumophila. J Clin Microbiol. 1980;11(3):286–91. doi: 10.1128/jcm.11.3.286-291.1980. [DOI] [PMC free article] [PubMed] [Google Scholar]
- 48.Novitsky JA, Morita RY. Morphological characterization of small cells resulting from nutrient starvation of a psychrophilic marine vibrio. App Environ Microbiol. 1976;32(4):617–22. doi: 10.1128/aem.32.4.617-622.1976. [DOI] [PMC free article] [PubMed] [Google Scholar]
- 49.Kjelleberg S, Hermansson M. Starvation-induced effects on bacterial surface characteristics. Appl Environ Microbiol. 1984;48(3):497–503. doi: 10.1128/aem.48.3.497-503.1984. [DOI] [PMC free article] [PubMed] [Google Scholar]
- 50.Mårdén P, Tunlid A, Malmcrona-Friberg K, Odham G, Kjelleberg S. Physiological and morphological changes during short term starvation of marine bacterial islates. Arch Microbiol. 1985;142(4):326–32. doi: 10.1007/BF00491898. [DOI] [Google Scholar]
- 51.Kjelleberg S. Starvation in Bacteria. New York: Plenum Press; 1993. [Google Scholar]
- 52.Giotis ES, Blair IS, McDowell DA. Morphological changes in Listeria monocytogenes subjected to sublethal alkaline stress. Int J Food Microbiol. 2007;120(3):250–8. doi: 10.1016/j.ijfoodmicro.2007.08.036. [DOI] [PubMed] [Google Scholar]
- 53.Chen S-Y, Jane W-N, Chen Y-S, Wong H-C. Morphological changes of Vibrio parahaemolyticus under cold and starvation stresses. Int J Food Microbiol. 2009;129(2):157–65. doi: 10.1016/j.ijfoodmicro.2008.11.009. [DOI] [PubMed] [Google Scholar]
- 54.Chaiyanan S, Chaiyanan S, Grim C, Maugel T, Huq A, Colwell RR. Ultrastructure of coccoid viable but non-culturable Vibrio cholerae. Environ Microbiol. 2007;9(2):393–402. doi: 10.1111/j.1462-2920.2006.01150.x. [DOI] [PubMed] [Google Scholar]
- 55.Garduño RA, Garduño E, Hiltz M, Hoffman PS. Intracellular growth of Legionella pneumophila gives rise to a differentiated form dissimilar to stationary-phase forms. Infect Immun. 2002;70(11):6273–83. doi: 10.1128/IAI.70.11.6273-6283.2002. [DOI] [PMC free article] [PubMed] [Google Scholar]
- 56.Faulkner G, Berk SG, Garduño E, Ortiz-Jiménez MA, Garduño RA. Passage through Tetrahymena tropicalis triggers a rapid morphological differentiation in Legionella pneumophila. J Bacteriology. 2008;190(23):7728–38. doi: 10.1128/JB.00751-08. [DOI] [PMC free article] [PubMed] [Google Scholar]
- 57.Matin A. Physiology, molecular biology and applications of the bacterial starvation response. J Appl Bacteriol. 1992;73:49s–57. doi: 10.1111/j.1365-2672.1992.tb03624.x. [DOI] [PubMed] [Google Scholar]
- 58.Kolter R, Siegele DA, Tormo A. The stationary phase of the bacterial life cycle. Ann Rev Microbiol. 1993;47(1):855–74. doi: 10.1146/annurev.mi.47.100193.004231. [DOI] [PubMed] [Google Scholar]
- 59.Koul A, Vranckx L, Dendouga N, Balemans W, Van den Wyngaert I, Vergauwen K, Göhlmann HWH, Willebrords R, Poncelet A, Guillemont J, et al. Diarylquinolines are bactericidal for dormant Mycobacteria as a result of disturbed ATP homeostasis. J Biol Chem. 2008;283(37):25273–80. doi: 10.1074/jbc.M803899200. [DOI] [PubMed] [Google Scholar]
- 60.Ueta M, Wada C, Daifuku T, Sako Y, Bessho Y, Kitamura A, Ohniwa RL, Morikawa K, Yoshida H, Kato T, et al. Conservation of two distinct types of 100S ribosome in bacteria. Genes Cells. 2013;18(7):554–74. doi: 10.1111/gtc.12057. [DOI] [PubMed] [Google Scholar]
- 61.Polikanov YS, Blaha GM, Steitz TA. How hibernation factors RMF, HPF, and YfiA turn off protein synthesis. Science. 2012;336(6083):915–8. doi: 10.1126/science.1218538. [DOI] [PMC free article] [PubMed] [Google Scholar]
- 62.Aiso T, Yoshida H, Wada A, Ohki R. Modulation of mRNA stability participates in stationary-phase-specific expression of ribosome modulation factor. J Bacteriol. 2005;187(6):1951–8. doi: 10.1128/JB.187.6.1951-1958.2005. [DOI] [PMC free article] [PubMed] [Google Scholar]
- 63.Yoshida H, Wada A. The 100S ribosome: ribosomal hibernation induced by stress. WIREs: RNA. 2014;5(5):723–32. doi: 10.1002/wrna.1242. [DOI] [PubMed] [Google Scholar]
- 64.Yamagishi M, Matsushima H, Wada A, Sakagami M, Fujita N, Ishihama A. Regulation of the Escherichia coli rmf gene encoding the ribosome modulation factor: growth phase-and growth rate-dependent control. EMBO J. 1993;12(2):625. doi: 10.1002/j.1460-2075.1993.tb05695.x. [DOI] [PMC free article] [PubMed] [Google Scholar]
- 65.Dalebroux ZD, Swanson MS. ppGpp: magic beyond RNA polymerase. Nat Rev Microbiol. 2012;10(3):203–12. doi: 10.1038/nrmicro2720. [DOI] [PMC free article] [PubMed] [Google Scholar]
- 66.Wendrich TM, Blaha G, Wilson DN, Marahiel MA, Nierhaus KH. Dissection of the mechanism for the stringent factor RelA. Mol Cell. 2002;10(4):779–88. doi: 10.1016/S1097-2765(02)00656-1. [DOI] [PubMed] [Google Scholar]
- 67.Dalebroux ZD, Edwards RL, Swanson MS. SpoT governs Legionella pneumophila differentiation in host macrophages. Mol Microbiol. 2009;71(3):640–58. doi: 10.1111/j.1365-2958.2008.06555.x. [DOI] [PubMed] [Google Scholar]
- 68.Edwards RL, Dalebroux ZD, Swanson MS. Legionella pneumophila couples fatty acid flux to microbial differentiation and virulence. Mol Microbiol. 2009;71(5):1190–204. doi: 10.1111/j.1365-2958.2008.06593.x. [DOI] [PMC free article] [PubMed] [Google Scholar]
- 69.Schafhauser J, Lepine F, McKay G, Ahlgren HG, Khakimova M, Nguyen D. The stringent response modulates 4-hydroxy-2-alkylquinoline biosynthesis and quorum-sensing hierarchy in Pseudomonas aeruginosa. J Bacteriol. 2014;196(9):1641–50. doi: 10.1128/JB.01086-13. [DOI] [PMC free article] [PubMed] [Google Scholar]
- 70.Albert-Weissenberger C, Sahr T, Sismeiro O, Hacker J, Heuner K, Buchrieser C. Control of flagellar gene regulation in Legionella pneumophila and its relation to growth phase. J Bacteriol. 2010;192(2):446–55. doi: 10.1128/JB.00610-09. [DOI] [PMC free article] [PubMed] [Google Scholar]
- 71.Byrne B, Swanson MS. Expression of Legionella pneumophila virulence traits in response to growth conditions. Infect Immun. 1998;66(7):3029–34. doi: 10.1128/iai.66.7.3029-3034.1998. [DOI] [PMC free article] [PubMed] [Google Scholar]
- 72.Jenkins DE, Auger EA, Matin A. Role of RpoH, a heat shock regulator protein, in Escherichia coli carbon starvation protein synthesis and survival. J Bacteriol. 1991;173(6):1992–6. doi: 10.1128/jb.173.6.1992-1996.1991. [DOI] [PMC free article] [PubMed] [Google Scholar]
- 73.Parsell D, Lindquist S. The function of heat-shock proteins in stress tolerance: degradation and reactivation of damaged proteins. Ann Rev Genet. 1993;27(1):437–96. doi: 10.1146/annurev.ge.27.120193.002253. [DOI] [PubMed] [Google Scholar]
- 74.Bandyopadhyay P, Xiao H, Coleman HA, Price-Whelan A, Steinman HM. Icm/Dot-independent entry of Legionella pneumophila into amoeba and macrophage hosts. Infect Immun. 2004;72(8):4541–51. doi: 10.1128/IAI.72.8.4541-4551.2004. [DOI] [PMC free article] [PubMed] [Google Scholar]
- 75.Levi A, Folcher M, Jenal U, Shuman HA. Cyclic diguanylate signaling proteins control intracellular growth of Legionella pneumophila. MBio. 2011;2(1):e00316–10. doi: 10.1128/mBio.00316-10. [DOI] [PMC free article] [PubMed] [Google Scholar]
- 76.Sahr T, Brüggemann H, Jules M, Lomma M, Albert-Weissenberger C, Cazalet C, Buchrieser C. Two small ncRNAs jointly govern virulence and transmission in Legionella pneumophila. Mol Microbiol. 2009;72(3):741–62. doi: 10.1111/j.1365-2958.2009.06677.x. [DOI] [PMC free article] [PubMed] [Google Scholar]
- 77.Bachman MA, Swanson MS. RpoS co-operates with other factors to induce Legionella pneumophila virulence in the stationary phase. Mol Microbiol. 2001;40(5):1201–14. doi: 10.1046/j.1365-2958.2001.02465.x. [DOI] [PubMed] [Google Scholar]
- 78.Hammer BK, Tateda ES, Swanson MS. A two-component regulator induces the transmission phenotype of stationary-phase Legionella pneumophila. Mol Microbiol. 2002;44(1):107–18. doi: 10.1046/j.1365-2958.2002.02884.x. [DOI] [PMC free article] [PubMed] [Google Scholar]
- 79.Wassarman KM. 6S RNA: a regulator of transcription. Mol Microbiol. 2007;65(6):1425–31. doi: 10.1111/j.1365-2958.2007.05894.x. [DOI] [PubMed] [Google Scholar]
- 80.Wassarman KM, Storz G. 6S RNA regulates E. coli RNA polymerase activity. Cell. 2000;101(6):613–23. doi: 10.1016/S0092-8674(00)80873-9. [DOI] [PubMed] [Google Scholar]
- 81.Faucher SP, Friedlander G, Livny J, Margalit H, Shuman HA. Legionella pneumophila 6S RNA optimizes intracellular multiplication. Proc Natl Acad Sci. 2010;107(16):7533–8. doi: 10.1073/pnas.0911764107. [DOI] [PMC free article] [PubMed] [Google Scholar]
- 82.Lang C, Flieger A. Characterisation of Legionella pneumophila phospholipases and their impact on host cells. Eur J Cell Biol. 2011;90(11):903–12. doi: 10.1016/j.ejcb.2010.12.003. [DOI] [PubMed] [Google Scholar]
- 83.van Loosdrecht MCM, Pot MA, Heijnen JJ. Importance of bacterial storage polymers in bioprocesses. Water Sci Technol. 1997;35(1):41–7. doi: 10.1016/S0273-1223(96)00877-3. [DOI] [Google Scholar]
- 84.Trainer MA, Charles TC. The role of PHB metabolism in the symbiosis of rhizobia with legumes. Appl Microbiol Biotechnol. 2006;71(4):377–86. doi: 10.1007/s00253-006-0354-1. [DOI] [PubMed] [Google Scholar]
- 85.Aurass P, Pless B, Rydzewski K, Holland G, Bannert N, Flieger A. bdhA-patD operon as a virulence determinant, revealed by a novel large-scale approach for identification of Legionella pneumophila mutants defective for amoeba infection. Appl Environ Microbiol. 2009;75(13):4506–15. doi: 10.1128/AEM.00187-09. [DOI] [PMC free article] [PubMed] [Google Scholar]
- 86.Battesti A, Majdalani N, Gottesman S. The RpoS-mediated general stress response in Escherichia coli. Ann Rev Microbiol. 2011;65:189–213. doi: 10.1146/annurev-micro-090110-102946. [DOI] [PMC free article] [PubMed] [Google Scholar]
- 87.Rao C, Benhabib H, Ensminger AW. Phylogenetic reconstruction of the Legionella pneumophila Philadelphia-1 laboratory strains through comparative genomics. PloS One. 2013;8(5) doi: 10.1371/journal.pone.0064129. [DOI] [PMC free article] [PubMed] [Google Scholar]
- 88.Hales LM, Shuman HA. The Legionella pneumophila rpoS gene is required for growth within Acanthamoeba castellanii. J Bacteriol. 1999;181(16):4879–89. doi: 10.1128/jb.181.16.4879-4889.1999. [DOI] [PMC free article] [PubMed] [Google Scholar]
- 89.Feeley JC, Gibson RJ, Gorman GW, Langford NC, Rasheed JK, Mackel DC, Baine WB. Charcoal-yeast extract agar: primary isolation medium for Legionella pneumophila. J Clin Microbiol. 1979;10(4):437–41. doi: 10.1128/jcm.10.4.437-441.1979. [DOI] [PMC free article] [PubMed] [Google Scholar]
- 90.Kedzierski W, Porter JC. A novel non-enzymatic procedure for removing DNA template from RNA transcription mixtures. Biotechniques. 1991;10(2):210–4. [PubMed] [Google Scholar]
- 91.Faucher SP, Shuman HA. Methods to study Legionella transcriptome in vitro and in vivo. In: Buchrieser C, Hilbi H, editors. Legionella: Methods and Protocols. New York, USA: Springer; 2013. pp. 567–82. [DOI] [PubMed] [Google Scholar]
- 92.Nielsen HB, Wernersson R, Knudsen S. Design of oligonucleotides for microarrays and perspectives for design of multi-transcriptome arrays. Nucleic Acids Res. 2003;31(13):3491–6. doi: 10.1093/nar/gkg622. [DOI] [PMC free article] [PubMed] [Google Scholar]
- 93.Wernersson R, Nielsen HB. OligoWiz 2.0—integrating sequence feature annotation into the design of microarray probes. Nucleic Acids Res. 2005;33(suppl 2):W611–5. doi: 10.1093/nar/gki399. [DOI] [PMC free article] [PubMed] [Google Scholar]
- 94.MYcroarray. http://www.mycroarray.com (2008). Accessed 14 Jan 2015.
- 95.Talaat AM, Howard ST, Hale W, IV, Lyons R, Garner H, Johnston SA. Genomic DNA standards for gene expression profiling in Mycobacterium tuberculosis. Nucleic Acids Res. 2002;30(20):e104. doi: 10.1093/nar/gnf103. [DOI] [PMC free article] [PubMed] [Google Scholar]
- 96.Trigui H, Dudyk P, Sum J, Shuman HA, Faucher SP. Analysis of the transcriptome of Legionella pneumophila hfq mutant reveals a new mobile genetic element. Microbiology. 2013;159(Pt 8):1649–60. doi: 10.1099/mic.0.067983-0. [DOI] [PMC free article] [PubMed] [Google Scholar]
- 97.Intergrated DNA Technologies. https://www.idtdna.com/Primerquest/Home/Index (2014). Accessed 14 Jan 2015.
- 98.Livak KJ, Schmittgen TD. Analysis of relative gene expression data using real-time quantitative PCR and the 2−ΔΔCT method. Methods. 2001;25(4):402–8. doi: 10.1006/meth.2001.1262. [DOI] [PubMed] [Google Scholar]
- 99.de Felipe KS, Glover RT, Charpentier X, Anderson OR, Reyes M, Pericone CD, Shuman HA. Legionella eukaryotic-like type IV substrates interfere with organelle trafficking. PLoS Pathogens. 2008;4(8) doi: 10.1371/journal.ppat.1000117. [DOI] [PMC free article] [PubMed] [Google Scholar]
- 100.Chen D-Q, Huang S-S, Lu Y-J. Efficient transformation of Legionella pneumophila by high-voltage electroporation. Microbiol Res. 2006;161(3):246–51. doi: 10.1016/j.micres.2005.09.001. [DOI] [PubMed] [Google Scholar]
- 101.Sadosky AB, Wiater LA, Shuman HA. Identification of Legionella pneumophila genes required for growth within and killing of human macrophages. Infect Immun. 1993;61(12):5361–73. doi: 10.1128/iai.61.12.5361-5373.1993. [DOI] [PMC free article] [PubMed] [Google Scholar]
- 102.Charpentier X, Gabay JE, Reyes M, Zhu JW, Weiss A, Shuman HA. Chemical genetics reveals bacterial and host cell functions critical for type IV effector translocation by Legionella pneumophila. PLoS Pathogens. 2009;5(7) doi: 10.1371/journal.ppat.1000501. [DOI] [PMC free article] [PubMed] [Google Scholar]
- 103.Kovach ME, Elzer PH, Steven Hill D, Robertson GT, Farris MA, Roop RM, II, Peterson KM. Four new derivatives of the broad-host-range cloning vector pBBR1MCS, carrying different antibiotic-resistance cassettes. Gene. 1995;166(1):175–6. doi: 10.1016/0378-1119(95)00584-1. [DOI] [PubMed] [Google Scholar]
- 104.Charpentier X, Faucher SP, Kalachikov S, Shuman HA. Loss of RNase R induces competence development in Legionella pneumophila. J Bacteriol. 2008;190(24):8126–36. doi: 10.1128/JB.01035-08. [DOI] [PMC free article] [PubMed] [Google Scholar]