

Abstract
Characterization of reptilian genomes is essential for understanding the overall diversity and evolution of amniote genomes, because reptiles, which include birds, constitute a major fraction of the amniote evolutionary tree. To better understand the evolution and diversity of genomic characteristics in Reptilia, we conducted comparative analyses of online sequence data from Alligator mississippiensis (alligator) and Sphenodon punctatus (tuatara) as well as genome size and karyological data from a wide range of reptilian species. At the whole-genome and chromosomal tiers of organization, we find that reptilian genome size distribution is consistent with a model of continuous gradual evolution while genomic compartmentalization, as manifested in the number of microchromosomes and macrochromosomes, appears to have undergone early rapid change. At the sequence level, the third genomic tier, we find that exon size in Alligator is distributed in a pattern matching that of exons in Gallus (chicken), especially in the 101—200 bp size class. A small spike in the fraction of exons in the 301 bp—1 kb size class is also observed for Alligator, but more so for Sphenodon. For introns, we find that members of Reptilia have a larger fraction of introns within the 101 bp–2 kb size class and a lower fraction of introns within the 5–30 kb size class than do mammals. These findings suggest that the mode of reptilian genome evolution varies across three hierarchical levels of the genome, a pattern consistent with a mosaic model of genomic evolution.
Introduction
A tremendous amount of progress has been made in understanding the biology and evolution of amniote genomes in the past decade. The publication of the human genome is not even ten years past (IHGSC 2001; Venter et al. 2001) and already genome browsers, such as ENSEMBL (Hubbard et al. 2007), contain numerous high coverage (>6X) genome assemblies for vertebrate species, such as human (Homo sapiens), mouse (Mus musculus), and zebrafish (Danio rerio). ENSEMBL also contains genomic data on 23 mammalian species from all the major groups, although many are low coverage (2X) assemblies from the Mammalian Genome Project (http://www.broad.mit.edu/mammals). Although such low coverage genomes are less useful than are high coverage ones (Green 2007), numerous insights will surely come from the wealth of comparative data becoming available.
In contrast, at this time there are only data on whole genomes from two reptilian (reptiles—including birds; Figs 1 and 2) species contained within ENSEMBL and other databases; chicken (Gallus gallus) and a pre-release draft of the green anole (Anolis carolinensis), with the zebra finch (Taeniopygia guttata) nearing completion. It is, therefore, an exciting time for comparative genomics with regard to analyzing and exploring the diversity and structure of reptilian genomes. Although this dataset is frustratingly limited, given the broad morphological and ecological diversity of reptiles, it nevertheless allows an unprecedented glimpse into the evolution of the amniote genome.
Fig. 1.
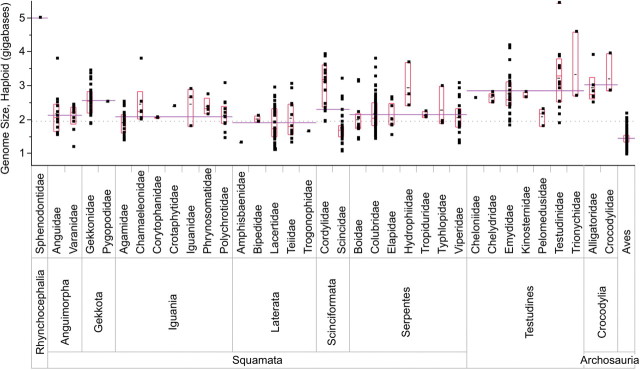
Variability chart for haploid genome size in Reptilia from data mined from the Animal Genome Size Database (Gregory 2007). Analyzed in JMP (SAS_Institute 2006), the global average for genome size is depicted by the gray dotted line. The edges of the gray boxes represent the 25th and 75th quantiles and the center lines are the clade median. The black lines within the interquartile range is the clade mean. These statistics were not calculated with reference to the phylogeny of these species.
Fig. 2.

Karyotypic diversity and evolution in Reptilia at the familial level. The bar graph on top represents the mean number of chromosomes (2n), broken down by microchromosomes and macrochromosomes with error bars derived from the standard deviation. The numbers below the bar graph is the number of species per family (sample size). The phylogenetic tree has the mean number of chromosomes mapped onto it using Bayesian ancestral-state reconstruction. The numbers within parentheses under node names are the 95.45% credibility intervals (the percent of the posterior distribution within two standard deviations of the mean). The colors and dates of the scale bar on the left are based on the ICS geologic timescale (Gradstein et al. 2004) with time in millions of years before the present.
Perhaps more importantly, genomic data will allow researchers to understand the biology and evolution of reptiles in new ways, thereby increasing our understanding of mammalian biology as well. Mammals and reptiles share a common ancestor roughly 320 million years ago; an ancestor that was undoubtedly reptilian-like in morphology and physiology (Benton and Donoghue 2007). Only recently have attempts been made at the most general description of the structure and karyological compartmentalization of this ancestor's genome (Shedlock et al. 2007). For instance, how do the forces of drift, draft (hitchhiking), and selection (Lynch 2006) shape the sequence-level fabric of the genome in reptiles and what generalizations can be gleaned from this type of question by including mammalian outgroups for comparative analyzes? For example, compared with humans, the average orthologous gene in Gallus is under strong purifying selection (dN/dS = 0.06) (Hillier et al. 2004), although this comparison surely suffers from sequence saturation and does not capture potential genetic adaptations that arose within the reptilian lineage. The full-scale annotation and analysis of the Anolis genome should provide powerful insights into natural selection by increasing the number of comparisons among reptiles and mammals.
As yet, the most basic descriptions of reptilian genomes, such as distributions of gene size and number, the relative lengths of introns, and the diversity and abundance of repetitive DNA elements, are still in their infancy. Using comparative methods, Waltari and Edwards (2002) suggested that reptilian genome sizes were intermediate between those of birds and those of mammals, and contributed to an overall pattern of punctuational evolution in this trait across tetrapods, although their sample size within non-avian reptiles was small. Shedlock et al. (2007) made substantial progress toward elucidating the genomic landscape of non-avian reptiles by comparing numerous BAC-end sequences from green anole, painted turtle, and American alligator; but data from more species are required to produce more compelling comparative and evolutionary insights within Reptilia. Isochore structure has been investigated in only a limited number of species (Duret et al. 1995; Hughes et al. 1999). Comparative studies of mutation in interspersed repetitive elements within Galliformes suggest that regional patterns of substitution bias maintain GC-isochore structure (Webster et al. 2006). Mammalian genomes, on the other hand, are characterized by more evenly distributed GC isochores (Meunier and Duret 2004). It has been hypothesized that the microchromosomes of birds, which have high recombination rates, are the driving force behind their more clumped isochore pattern (Ellegren 2007). If true, most reptiles would be predicted to have a directional mutational bias in interspersed repeats as well, given the widespread occurrence of microchromosomes in Reptilia.
Reptilian genomes at the global tier: genome size
Genome size is a fundamental descriptor of the genome, and because it influences nucleus and cell size, it is a factor likely important for cellular physiology (Gregory 2001). Repetitive elements, in addition to life history traits such as longevity, and metabolic and developmental rate, have been proposed as correlates of genome size (reviewed in Gregory 2005), whether these relationships are the product of natural selection (Cavalier-Smith 1978) or neutral forces, such as drift and mutation rate (Lynch 2007). Problematically, most previous analyses have not employed comparative phylogenetic methods (Harvey and Pagel 1991). Variation in genome size within and among groups is particularly interesting, given these proposed correlates. For example, a recent study found that human genomes vary by at least nine million base pairs (Wong et al. 2007). Introns, intergenic DNA, and repetitive elements, such as CR1-like long interspersed elements, that appear to predominate in many reptilian genomes (Shedlock 2006), together modulate genome size in amniotes. The small genomes of birds, for example, which are three-fold smaller than many mammal genomes, reflect a significant difference in interspersed repeat content, segmental duplications, and pseudogenes (Shedlock 2006), as well as smaller introns (Waltari and Edwards 2002).
Reptilian genomes at the karyotypic tier
Despite the absence of microchromosomes in the mammalian genome, they form a substantial portion of the karyotype in most amniotes (Burt 2002). Microchromosomes are structurally similar to macrochromosomes (they have telomeres and centromeres, for example) and behave similarly during mitosis and meiosis (Burt 2002), although they are much smaller in size. Microchromosomes are, on average, half the size of macrochromosomes (Rodionov 1996), but these categories shoehorn a continuum of sizes. Microchromosomes are 2–3 times more gene-dense than are macrochromosomes (Smith et al. 2000). Avian microchromosomes have been found to have higher recombination rates than do macrochromosomes (an average of once every 12 Mb versus once every 30 Mb) (Rodionov et al. 1992a, 1992b). This is nearly five times the rate seen in mammalian chromosomes and suggests that microchromosomes are an important factor for generating genetic variation. However, recent work supports the notion that recombination rate is variable within birds and depends on chromosome size (Backström et al. 2006). Lastly, compared with larger chromosomes, microchromosomes tend to be GC-rich and CpG-rich, but contain few repetitive elements (Hillier et al. 2004).
Reptilian genomes at the sequence tier
The sequence level of the genome is the scale at which genes, regulatory elements, isochores, and other sequence-based constructs form the fabric of the genome. The base composition of the genome is heterogeneous, with blocks of biased base composition (Bernardi 2000). In Gallus, most CG isochores are located on microchromosomes (Hillier et al. 2004). Above the sequence level, methylation forms an important structural component of the vertebrate genome. Cytosine-phosphate-guanine sequences (CpG) are sites at which methylation usually occurs by the conversion of cytosine to 5-methylcytosine (5 mC) (Tajima and Suetake 1998). CpG islands are associated with promoter regions in vertebrates and, due to their influence on chromatin reorganization and gene expression. Amniote genomes are methylated roughly one-half as much as are the genomes of amphibians and fish (Jabbari et al. 1997). Archosauromorphs (crocodilians, turtles, and birds) and mammals have lower rates of methylation, while lepidosaurs (tuatara and squamates: lizards and snakes) are more variable, with rates that range from those seen in amphibians to those of mammals (Varrialea and Bernardi 2006). The fraction of CpG islands and their evolution within reptiles will be explored in future work.
Genes, introns, and coding exons constitute an important fraction of the amniote genome that complements the repetitive landscape. In humans, introns and protein coding exons occupy, respectively, 25.9 and 1.5% of the genome (Lander et al. 2001). Unfortunately, in reptiles the only genome-scale information is from the anole, which remains to be analyzed. In addition to the anole draft genome, a few other reptilian genomic sequences are available online. For instance, crocodilian genomes are represented by 21 working draft sequences that encompass 2,583,793 bp, 211 partial or complete CDS, and 191 genes (http://www.ncbi.nlm.nih.gov). Turtle genomes are also represented by four working draft sequences encompassing 340,179 bp, 397 partial or complete CDS, and 771 genes. For lepidosaurian genomes, 11 working draft sequences encompass 1,599,138 bp and 3092 partial or complete CDS together with 4330 genes.
In this study, we use a comparative approach to describe general trends in the evolution and diversity of genomic characteristics within reptiles. We study trends in genome size and in karyological data from a wide range of reptiles as well as sequence data from Alligator mississippiensis and Sphenodon punctatus. These sequence data represent only a fraction of the respective genomes from which they were sampled, but nevertheless provide a window into genomic characteristics of these species, for parameters such as average intron and exon length. Importantly, we include data from birds to present a phylogenetically consistent picture of reptilian genomics across three scales of organizational hierarchy.
Materials and methods
Genomic data
Karyotypic data were obtained from ChromoRep (Olmo 2005; Brown et al. 2007). This database contains roughly 1300 non-avian reptilian species. The following families were included in the analysis (data summarized in Table 1): Turtles: Emydidae (pond turtles), Testudinidae (tortoises), Cheloniidae (sea turtles), Dermochelyidae (leatherback turtles), Chelydridae (snapping turtles), Dermatemydidae (Mesoamerican river turtle), Kinosternidae (mud and musk turtles), Carettochelyidae (pignose turtle), Trionychidae (soft-shell turtles), Chelidae (Austro-American side-necked turtles), Podocnemididae (side-necked turtles), Pelomedusidae (helmeted and African mud turtles); Crocodilians: Crocodylidae (crocodiles), Gavialidae (gharials); Birds: Struthionidae (ostrich), Phasianidae (chickens, pheasants and relatives), Pelecanidae (pelicans), Accipitridae (eagles and relatives), Estrildidae (finches, waxbills, and relatives); Anguimorphs: Anguidae (glass lizards and relatives), Anniellidae (California legless lizards), Helodermatidae (gila monsters), Varanidae (monitor lizards), Xenosauridae (crocodile lizards); Gekkota: Gekkonidae (geckos), Pygopodidae (legless lizards); Iguania: Agamidae (agamid lizards), Chamaeleonidae (chamaeleons), Iguanidae (iguanas, anoles, and relatives); Laterata: Amphisbaenidae (worm lizards), Bipedidae (Bipedid legless lizards), Lacertidae (wall lizards), Trogonophiidae (Palearctic worm lizards, Teiidae (whiptail lizards); Scinciformata: Cordylidae (spinytail lizards), Gerrhosauridae (plated lizards and relatives), Gymnophthalmidae (spectacled lizards), Scincidae (skinks), Xantusiidae (night lizards); Serpentes: Acrochordidae (wart snakes and relatives), Boidae (boas), Colubridae (garter snakes and relatives), Elapidae (cobras and relatives), Hydrophiidae (sea snakes), Leptotyphlopidae (slender blind snakes and thread snakes), Loxocemidae (Mexican pythons and burrowing snakes), Xenopeltidae (sunbeam snakes), Viperidae (vipers), Tropidophiidae (dwarf boas), Typhlopidae (blind snakes); Rhynchocephalia: Sphenodontidae (tuatara). We obtained additional avian karyotypic data from the literature for Struthionidae, Phasianidae, Pelecanidae, Accipitridae (Takagi and Sasaki 1974), and Estrildidae (Christidis 1986, 1987; Pigozzi and Solari 1999) for a total of 52 taxa. We sampled families within Aves that represent the major groups, but mostly restrict our analysis to non-avian reptiles. Genome size data were obtained from the Animal Genome Size Database (Gregory 2007) for a subset of the families for which there were data. Genome sizes were averaged for species with multiple entries. We used data from Xenopus tropicalis (frog), Ornithorhynchus anatinus (platypus), Monodelphis domestica (opossum), and H. sapiens (human) as outgroups for graphical purposes, but did not include them within the comparative analyses.
Table 1.
Summary of genome size and karyotypic data used in this study
| Taxon | GS | Csm | Macro-Csm | Micro-Csm |
|---|---|---|---|---|
| Accipitridae | 1.5 | 66 | 58 | 8.0 |
| Acrochordidae | – | 36 | 16 | 20 |
| Agamidae | 1.9 | 40 | 17 | 22 |
| Amphisbaenidae | 1.3 | 37 | 15 | 21 |
| Anguidae | 2.2 | 39 | 17 | 22 |
| Anniellidae | – | 27 | 17 | 10 |
| Bipedidae | 2.0 | 43 | 21 | 22 |
| Boidae | 2.0 | 36 | 17 | 20 |
| Carettochelidae | – | 68 | 16 | 52 |
| Chamaeleonidae | 2.5 | 29 | 15 | 15 |
| Chelidae | – | 53 | 22 | 31 |
| Cheloniidae | 2.6 | 56 | 24 | 32 |
| Chelydridae | 2.6 | 52 | 25 | 28 |
| Colubridae | 2.2 | 37 | 18 | 19 |
| Cordylidae | 3.1 | 35 | 15 | 20 |
| Crocodylidae | 3.2 | 35 | 35 | 0 |
| Dermatemydidae | – | 56 | 24 | 32 |
| Dermochelyidae | – | 56 | 24 | 32 |
| Dibamidae | – | 36 | 20 | 16 |
| Elapidae | 2.1 | 37 | 17 | 20 |
| Emydidae | 2.8 | 51 | 27 | 24 |
| Estrildidae | 1.3 | 78 | 16 | 63 |
| Gavialidae | – | 32 | 32 | 0 |
| Gekkonidae | 2.6 | 39 | 35 | 12 |
| Gerrhosauridae | – | 34 | 12 | 22 |
| Gymnophthalmidae | – | 45 | 19 | 24 |
| Helodermatidae | – | 38 | 14 | 24 |
| Hydrophiidae | 2.9 | 35 | 16 | 19 |
| Iguanidae | 2.2 | 34 | 13 | 20 |
| Kinosternidae | 2.7 | 56 | 25 | 31 |
| Lacertidae | 1.9 | 38 | 35 | 2.1 |
| Leptotyphlopidae | – | 36 | 16 | 20 |
| Loxocemidae | – | 36 | 16 | 20 |
| Pelecanidae | 1.4 | 66 | 28 | 38 |
| Pelomedusidae | 2.1 | 34 | 23 | 12 |
| Phasianidae | 1.3 | 79 | 12 | 67 |
| Podocnemididae | – | 28 | 20 | 16 |
| Pygopodidae | 2.5 | 37 | 29 | 14 |
| Scincidae | 1.8 | 30 | 18 | 13 |
| Sphenodontidae | 5.0 | 36 | 28 | 8.0 |
| Struthionidae | 2.2 | 80 | 12 | 68 |
| Teiidae | 2.0 | 51 | 25 | 23 |
| Testudinidae | 3.2 | 52 | 28 | 24 |
| Trionychidae | 3.3 | 65 | 14 | 52 |
| Trogonophiidae | 1.7 | 36 | 12 | 24 |
| Tropidophiidae | 2.1 | 36 | 16 | 20 |
| Typhlopidae | 2.3 | 34 | 18 | 17 |
| Varanidae | 2.1 | 40 | 16 | 24 |
| Viperidae | 2.1 | 36 | 17 | 20 |
| Xantusiidae | – | 32 | 16 | 16 |
| Xenopeltidae | – | 36 | 16 | 20 |
| Xenosauridae | – | 36 | 12 | 24 |
GS, is average haploid genome size; Csm, is the average number of chromosomes; Macro-Csm is average number of macrochromosomes; and Micro-Csm is the average number of microchromosomes.
The following versions of the latest genomic assemblies were obtained from the UCSC genome browser database (Karolchik et al. 2003): H. sapiens (Human Mar. 2006 hg18), M. domestica (Opposum January 2006, monDom4), O. anatinus (Platypus March 2007, ornAna1), G. gallus (Chicken May 2006, galGal3), X. tropicalis (X. tropicalis August 2005, xenTro2). In addition to complete genome mining from the UCSC genome browser database, the table browser application (Kent et al. 2002) was implemented to extract Genscan (Burge and Karlin 1997) and Ensemble (Birney et al. 2004; Hubbard et al. 2007) gene sets which are consistent and widely represented in the genomes used for this analysis. In addition, we obtained sequence data for A. mississippiensis (total of 2,583,793 bp; AC148578, AC148923, AC148964, AC149025, AC149026, AC149027, AC149028, AC149029, AC154087, AC154088, AC154169, AC154170, AC154945, AC155799, AC155800, AC155801, AC155802, AC161341, AC162159, AC164519, AC165215) and S. punctatus (total of 1,599,138 bp; AC154075, AC155214, AC155213, AC154074, AC161716, AC153757, AC153758, AC155215, AC153105, AC154989, AC154160) from the NCBI database (http://www.ncbi.gov). These data were derived from BAC clones sequenced by the NIH Intramural Sequencing Center (http://www.nisc.nih.gov) as part of the NISC Comparative Sequencing Initiative.
The Genscan gene set incorporates ab initio gene predictions based on gene models using transcriptional, translational, and donor–acceptor splicing signals. Additionally, the compositional distributions of GC content were implemented in Genscan to infer genes and gene structures (Burge and Karlin 1997). The Ensemble gene set complements predictions with functional annotations of known genes. Genes, exons, and introns were independently extracted and reformatted and their length calculated using Galaxy (Giardine et al. 2005). JMP 6.03 (SAS_Institute 2006) was used to perform statistical analyses and to generate charts.
Phylogenetic framework and divergence times
Phylogenetic trees were created in Mesquite v2.01 (Maddison and Maddison 2007) using the StratAdd (Faure et al. 2006) package to date nodes according to the geologic timescale (Gradstein et al. 2004). Divergence times and topologies were derived from the literature for: Amphibia (Evans et al. 2004; Benton and Donoghue 2007), Mammalia (Springer et al. 2004), Reptilia (Rest et al. 2003), Squamata (Rest et al. 2003; Vidal and Hedges 2005; Wiens et al. 2006; Kumazawa 2007), Serpentes (Lawson et al. 2005; Lee et al. 2007; Vidal et al. 2007), Testudines (Fujita et al. 2004; Near et al. 2005; Fritz and Bininda-Emonds 2007), and Aves (Ericson et al. 2006; Brown et al. 2007). Interrelationships with unknown divergence times were estimated as half the span between ancestral and descendent nodes.
Character evolution and comparative methods
We treated genome size and karyotype as continuous characters, using the program BayesTraits (Pagel 1997, 1999) to estimate phylogenetic parameters κ, δ, and λ. Kappa (κ) differentially elongates or contracts individual branches within a tree to better fit the model to the data. It can be used to test for punctuated evolution when its estimated value is close to zero (default value is one), indicating that most evolutionary change in the character is associated with cladogenetic (branching) events. Delta (δ) scales the overall paths in the tree, from root to tip, to better fit the model of trait evolution to the data, and can be used to test for evidence of rapid early change in the tree (when its estimated value is <1), or later acceleration of character change (when its estimated value is >1). Lambda (λ) is a parameter that scales the off-diagonal elements of the phylogenetic generalized least squares (PGLS) variance–covariance matrix and assesses the contribution of evolutionary history to observed variation in traits; in cases of high historical constraint, its estimated value is close to one, whereas more labile traits have lower values (Pagel 1997, 1999). If λ was significantly different from 1 [which accounts for the character(s) not evolving as implied by the phylogeny], its maximum likelihood (ML) value was used when κ and δ were estimated or when other aspects of character evolution described in this section were analyzed. BayesTraits was also used to perform PGLS correlations between genome size and karyotype. Like other comparative methods, this approach accounts for the nonindependence of the characters caused by shared evolutionary history of related species.
Drift versus directional evolution was tested by comparing model A to model B in BayesTraits. Model A has one parameter, the instantaneous variance of evolution and is a basic random walk model. Model B is a directional random-walk, and in addition to the variance parameter of model A, it has a directional change parameter. We estimate λ and κ while testing for directional trait evolution because model B cannot be used with ultrametric trees.
Ancestral character state reconstruction was performed by creating zero-branch-length dummy taxa at nodes of interest in Mesquite and a random walk (model A) model of character evolution in BayesTraits. We tested for significant amount of character evolution between groups by creating dummy variables to divide species into two groups. A continuous regression model was then generated to test for correlations, resulting in the equivalent of a phylogenetically informed t-test.
We used ML to estimate parameter values and test for their significance. Likelihood ratio tests (LRT), calculated as 2 × (lnL2−lnL1), where lnL1 is the log-likelihood of the simpler model and lnL2 is the log-likelihood of the more complex model, were used to evaluate significance. This statistic approximates to a chi-squared distribution with degrees of freedom equal to the difference in the number of estimated parameters between the models. We used a Bayesian (Markov chain Monte Carlo; MCMC) approach to reconstruct ancestral states where the posterior distribution represents support for the reconstructed character state given the phylogenetic tree and the distribution of trait values among living species.
Results and discussion
Reptilian genomes at the global tier: genome size
We found that genome size appears to be highly variable (Fig. 1). Some groups display low variance in genome sizes, such as birds (mean = 1.4 pg, range = 0.97–2.2) and agamid lizards (mean = 1.9 pg, range = 1.4–2.5) whereas other groups show large amounts of variation, as in emydid turtles (mean = 2.8 pg, range = 1.8–4.2) and colubrid snakes (mean = 2.2 pg, range = 1.4–3.8). We examined the relationship between genome size and karyotype to explore the covariation between these two tiers of genomic organization. At the family level there is a lack of correlation between mean genome size and mean chromosome number (PGLS r2 = 0.011, P = 0.56) or mean number of macrochromosomes (PGLS r2 = 0.0069, P = 0.48). These results are not surprising, given the high degree of plasticity in the evolution of the genome noted above. It has been hypothesized that microchromosomes (specifically avian) are a by-product of the evolution of a small genome through the reduction of repetitive DNA rather than arising from specific adaptive processes (Burt 2002). This hypothesis predicts a significant phylogenetic correlation between genome size and the number of microchromosomes. We performed a PGLS correlation analysis with genome size and the mean number of microchromosomes at the family level and found no evidence for such a relationship (PGLS r2 = 0.013, P = 0.50).
We also analyzed genome size for tempo and mode of evolution within Reptilia. The parameter tests in BayesTraits suggest that genome size largely evolves by continuous, gradual evolution because κ and δ are nonsignificant (κ P-value = 0.62, δ P-value = 0.80). The estimated λ parameter was also not significantly different from one (λ P-value = 0.12), which indicates that the phylogeny predicts the expected covariance in genome size well. Along with nonsignificant κ and δ, the estimation of λ indicates that reptilian genome size evolution is consistent with the constant–variance model of character change. Moreover, there is no evidence for drift or directional change in the evolution of genome size in reptiles (model A versus model B, P = 0.12). However, our results suggest that a significant amount of evolutionary change in genome size at the α = 10% level separates birds from other reptiles (PGLS t-test between Aves and non-avian reptiles, P = 0.081). This result is consistent a pattern that Waltari and Edwards (2002) could not confirm statistically due to small sample sizes in numbers of species analyzed. Although there is large variation in genome size within non-avian reptiles, no other PGLS t-test among families of non-avian reptiles was found to be significant.
Reptilian genomes at the karyotypic tier
It has been proposed that the origin of the avian karyotype is largely due to fission of both macrochromosomes and microchromosomes, rather than the fusion of ancestral microchromosomes into the complement of macrochromosomes (Burt 2002), although some clear examples of chromosomal fusion have been documented, for example, in the Phasianidae (Shibusawa et al. 2004). Comparative mapping suggests that the ancestor which gave rise to the avian lineage possessed ∼20 chromosomes and a small gene-dense genome (Burt 2002). Recent paleogenomic work supports this hypothesis for the size and repeat content of the genome (Organ et al. 2007). However, our Bayesian ancestor state reconstruction (Fig. 2), suggests that family-level archosauromorph ancestor (the branch leading to birds, crocodilians, and turtles) had roughly 49 (95% credibility interval: 41–56) chromosomes, 26 (95% credibility interval: 13–39) of which are microchromosomes. We also find no evidence for directional evolutionary trends of chromosome numbers (for all chromosomes P = 0.33; macrochromosomes P = 0.11; microchromosomes P = 0.43).
The λ parameter was significantly different from one for macrochromosomes (λ = 0.28 P = 0.005), but not for the entire karyotype (λ P-value = 0.99) or microchromosomes (λ = 0.99). These λ estimates indicate that the phylogeny is a good indicator for the expected covariance in the number of chromosomes and the number of microchromosomes, but not the number of macrochromosomes. A significant estimated κ parameter of 2.09 (κ P-value = 0.013) suggests that more evolution of the reptilian karyotype occurs within longer branches than in shorter ones, as opposed to stasis within longer branches, indicating that karyotypic change is not confined to cladogenic events. As with the overall karyotype, longer branches contribute more to the evolution of macrochromosomal number than do short branches (κ = 3.0, P = 0.00017). In addition, we find evidence consistent with large shifts in the number of chromosomes at the base of the reptilian tree (δ = 0.26, P = 0.027). When the karyotype is subdivided into macrochromosomes and microchromosomes, δ lacks significance for macrochromosomes (P = 0.91), and is closer to one (δ = 1.2). Delta for microchromosomes is also insignificant (P = 0.40). These results imply that the karyotype continually evolved in reptiles with significant changes occurring early in reptilian diversification, some 300 million years ago, with continued change along branches in the number of macrochromosomes. An early diversification of the karyotype has also been hypothesized elsewhere (Olmo 2005), though our results are consistent with a gradual model of evolution for microchromosomes throughout the reptilian tree. This hypothesis supports the finding that many avian (and presumably other reptilian) microchromosomes have a correspondence with proto-chromosomes in a hypothetical gnathostome ancestor (Nakatani et al. 2007), despite a reorganization of the genome following duplication of a whole genome in the vertebrate lineage. Also supporting this model of reptilian chromosomal evolution, long blocks of conserved synteny have been reported in comparisons between chickens and humans, indicating a relatively low rate of chromosomal translocations, despite much higher rates of intra-chromosomal rearrangements (Hillier et al. 2004). It is unclear whether the high rate of karyotypic change at the base of the reptilian tree represents some sort of karyotypic “adaptive radiation”, or if it is the consequence of neutral processes such as high rates of mutation and fixation.
Although nearly all reptiles have microchromosomes, those of birds have been the focus of much research. We find strong evidence for a large amount of evolution in the number of microchromosomes between birds and non-avian reptiles (PGLS t-test, P < 0.0001). Within non-avian reptiles, it has been hypothesized that the evolutionary rates of karyotype and genome size have impacted morphological divergence between the two primary reptilian lineages, archosauromorphs and lepidosaurs (Olmo et al. 2002). Our results do not support the hypothesis for a major difference in genome size in a family-level analysis (PGLS t-test between the two groups, P = 0.66). However, the same test detects a significant amount of evolutionary change in karyotype (number of chromosomes) separating the two groups (PGLS t-test, P = 0.040), supporting this component of the hypothesis.
Reptilian genomes at the sequence tier
We analyzed ∼2.6 Mb of sequence from A. mississippiensis, a member of the crocodilian lineage and ∼1.6 Mb from S. punctatus (tuatara) a member of the lepidosaurian lineage using Genscan (Burge and Karlin 1997). Using draft assemblies from BACs overlapping homologous regions in both reptiles, we predicted 128 gene structures for alligator and 109 for tuatara. Blasting these sequences and predicted gene structures resulted in no particular gene family being overrepresented. Exon length in both species was calculated based on a total of 583 exons from tuatara and 518 exons from alligator. The distribution of exon size classes is expected to differ from that of intron size classes owing to the differences in average size of these gene elements (Fig. 3). The high fraction of large exons in Sphenodon, especially in the 301 bp—1 kp size class, is intriguing, given its unusually large genome of 5 pg, although this difference could also reflect challenges of Genscan to decipher gene structures in sequences from this reptile. Exon sizes in Alligator are distributed in a pattern matching that of Gallus (chicken), especially in the 101—200 bp size class. A small spike in the percentage of exons within the 301 bp–1 kp size class is also observed, although it is less dramatic than the spike seen in Sphenodon.
Fig. 3.

Summary of (A) exons and (B) introns across amniotes in different size classes as a percentage of all exons and introns, respectively. The dataset is composed of coding exons and introns. However, it excludes promoters, and 5′ and 3′ UTR Exons. Genscan estimates of tuatara and alligator are not based on data on sequences of whole genomes and likely underestimate the percentage of elements within the largest class due to the manner in which the BAC-end sequences were sampled. However, at least 80% of the data comes from BACs containing homologous regions in both reptiles. Species are arranged in the histogram in the same order as in the symbol legend.
We also find that members of Reptilia, as in the frog Xenopus, have a much larger percentage of introns within the 101 bp–2 kb size class than do mammals. Likewise, members of Reptilia and Xenopus have a lower percentage of introns within the 5–30 kb size class than do mammals. The platypus has many reptilian characteristics in its genome (Warren et al. 2008). We find significant differences in the paucity of large introns and abundance of smaller introns seen in reptiles and platypus compared with marsupial and placental mammals (PGLS t-tests, P-values < 0.001). These differences demonstrate that the average mammalian gene is different in size and composition from the average reptilian gene and that this difference is due mainly to small and large size classes of introns. However, we caution that these patterns could be due to limited taxonomic sampling or the amount of sequence data available for both reptilian species represents <1% of the total genome for these animals. This glimpse into the distribution of gene structure of reptiles is preliminary, but may provide some context for estimations of complete genomes of non-avian reptiles such as A. carolinensis.
Conclusions
This analysis increases our current understanding of the major trends in reptilian and mammalian genomic evolution (Table 2). We find evidence consistent with the hypothesis that the tempo and mode of evolution differs across the scales of genomic organization. For example, our analyses suggest that the size distribution of the reptilian genome is consistent with a model of continuous gradual evolution while genomic compartmentalization, as registered in karyotype variation, appears to have undergone early rapid evolution associated with the ecological and morphological diversification of the clade roughly 300 million years ago. Our results also suggest that lineage specific evolutionary change (anagenesis) produced the karyotypic distribution seen in extant reptiles.
Table 2.
Summary of evolutionary analysis of genome size and karyotype using maximum likelihood
| Trait/Parameter | Kappa | Delta | Lambda | PGLS Regression w/genome size |
|---|---|---|---|---|
| Genome size | 0.87 | 1.2 | 0.92 | n/a |
| Chromosome number | 2.1* | 0.26* | 1.0 | r2 = 0.011 |
| Macrochromosome number | 3.0** | 1.2 | 0.28** | r2 = 0.0069 |
| Microchromosome number | 1.7 | 1.6 | 1.0 | r2 = 0.013 |
*Significance at the 0.05–0.01 level.
**Significance at 0.01 or greater.
Lack of an asterisk indicates lack of significance—in the case of kappa, delta, and lambda, a significant difference from the default value of one.
It is essential, however, to sample reptiles more broadly to understand not only the biology and evolution of their genomes, but to identify the patterns and processes of genomic evolution. Because reptiles are the extant sister-group of mammals, they are critical for making inferences regarding the pattern and direction of mammalian genomic evolution. However, without additional genomic data from a broad representation of the reptilian tree, attempting to reconstruct the ancestral state in mammals and thereby the pattern of evolution in mammalian genomes is problematic.
Acknowledgments
We thank the Society of Integrative and Comparative Biology for hosting the Symposium on Reptile Genomics during their 2008 conference in San Antonio, Texas, at which this research was first presented. Chris Schneider, Nicole Hobbs, Chris Venditti, and two anonymous reviewers deserve our gratitude for providing useful comments that greatly improved this work. Two divisions within SICB provided funding for the symposium, which helped facilitate this work: Developmental and Cell Biology (DDCB) and Evolutionary Developmental Biology (DEDB). Additional symposium funding was provided by the National Science Foundation's Division of Integrative Organismal Systems (NSF Grant # 0809547 to Nicole Valenzuela, Dan Janes, and Chris Organ). Primary funding was provided by NIH NSRA Postdoctoral Fellowships granted to Chris Organ (5F32GM075490) and Fundación México en Harvard and Conacyt fellowship awarded to Ricardo Godínez Moreno.
References
- Backström N, Brandström M, Gustafsson L, Qvarnström A, Cheng H, Ellegren H. Genetic mapping in a natural population of collared flycatchers (Ficedula albicollis): conserved synteny but gene order rearrangements on the avian Z chromosome. Genetics. 2006;174:377–86. doi: 10.1534/genetics.106.058917. [DOI] [PMC free article] [PubMed] [Google Scholar]
- Benton M, Donoghue P. Paleontological evidence to date the tree of life. Mol Biol Evol. 2007;24:26–53. doi: 10.1093/molbev/msl150. [DOI] [PubMed] [Google Scholar]
- Bernardi G. Isochores and the evolutionary genomics of vertebrates. Gene. 2000;241:3–17. doi: 10.1016/s0378-1119(99)00485-0. [DOI] [PubMed] [Google Scholar]
- Birney E, et al. An overview of Ensembl. Genome Res. 2004;14:925–8. doi: 10.1101/gr.1860604. [DOI] [PMC free article] [PubMed] [Google Scholar]
- Brown JW, Payne RB, Mindell DP. Nuclear DNA does not reconcile ‘rocks' and ‘clocks' in Neoaves: a comment on Ericson et al. Biol Lett. 2007;3:257–9. doi: 10.1098/rsbl.2006.0611. [DOI] [PMC free article] [PubMed] [Google Scholar]
- Burge C, Karlin S. Prediction of complete gene structures in human genomic DNA. J Mol Biol. 1997;268:78–94. doi: 10.1006/jmbi.1997.0951. [DOI] [PubMed] [Google Scholar]
- Burt DW. Origin and evolution of avian microchromosomes. Cytogenet Genome Res. 2002;96:97–112. doi: 10.1159/000063018. [DOI] [PubMed] [Google Scholar]
- Cavalier-Smith T. Nuclear volume controlled by nucleoskeletal DNA, selection for cell volume and cell growth rate, and the solution of the DNA C-value paradox. J Cell Sci. 1978;34:247–78. doi: 10.1242/jcs.34.1.247. [DOI] [PubMed] [Google Scholar]
- Christidis L. Chromosomal evolution within the family Estrildidae (Aves) I. The Poephilae. Genetica. 1986;71:81–97. [Google Scholar]
- Christidis L. Chromosomal evolution within the family Estrildidae (Aves) III. The Estrildae (waxbill finches) Genetica. 1987;72:93–100. [Google Scholar]
- Duret L, Mouchiroud D, Gautier C. Statistical analysis of vertebrate sequences reveals that long genes are scarce in GC-rich isochores. J Mol Evol. 1995;40:308–17. doi: 10.1007/BF00163235. [DOI] [PubMed] [Google Scholar]
- Ellegren H. Molecular evolutionary genomics of birds. Cytogenet Genome Res. 2007;117:120–30. doi: 10.1159/000103172. [DOI] [PubMed] [Google Scholar]
- Ericson PG, Anderson CL, Britton T, Elzanowski A, Johansson US, Kallersjo M, Ohlson JI, Parsons TJ, Zuccon D, Mayr G. Diversification of Neoaves: integration of molecular sequence data and fossils. Biol Lett. 2006;2:543–7. doi: 10.1098/rsbl.2006.0523. [DOI] [PMC free article] [PubMed] [Google Scholar]
- Evans BJ, Kelley DB, Tinsley RC, Melnick DJ, Cannatellae DC. A mitochondrial DNA phylogeny of African clawed frogs: phylogeography and implications for polyploid evolution. Mol Phylogenet Evol. 2004;33:197–213. doi: 10.1016/j.ympev.2004.04.018. [DOI] [PubMed] [Google Scholar]
- Faure E, Lony E, Lovigny R, Menegoz A, Ting Y, Laurin M. StratAdd module for Mesquite. 2006. Available at: http://tolweb.org/notes/?note_id=3669.
- Fritz U, Bininda-Emonds ORP. When genes meet nomenclature: tortoise phylogeny and the shifting generic concepts of Testudo and Geochelone. Zoology. 2007;110:298–307. doi: 10.1016/j.zool.2007.02.003. [DOI] [PubMed] [Google Scholar]
- Fujita MK, Engstrom TN, Starkey DE, Shaffer HB. Turtle phylogeny: insights from a novel nuclear intron. Mol Phylogenet Evol. 2004;31:1031–40. doi: 10.1016/j.ympev.2003.09.016. [DOI] [PubMed] [Google Scholar]
- Giardine B, et al. Galaxy: Aa platform for interactive large-scale genome analysis. Genome Res. 2005;15:1451–5. doi: 10.1101/gr.4086505. [DOI] [PMC free article] [PubMed] [Google Scholar]
- Gradstein FM. A geologic time scale 2004. Cambridge: Cambridge University Press; 2004. [Google Scholar]
- Green P. 2x genomes - does depth matter? Genome Res. 2007;17:1547–9. doi: 10.1101/gr.7050807. [DOI] [PubMed] [Google Scholar]
- Gregory TR. Coincidence, coevolution, or causation? DNA content, cell size, and the C-value enigma. Biol Rev Camb Philos Soc. 2001;76:65–101. doi: 10.1017/s1464793100005595. [DOI] [PubMed] [Google Scholar]
- Gregory TR. Genome size evolution in animals. In: Gregory TR, editor. The evolution of the genome. Boston: Elsevier Academic Press; 2005. pp. 4–71. [Google Scholar]
- Gregory TR. Animal genome size database. 2007. Available at: http://www.genomesize.com/
- Harvey PH, Pagel MD. The comparative method in evolutionary biology. Oxford (UK): Oxford University Press; 1991. [Google Scholar]
- Hillier LW, et al. Sequence and comparative analysis of the chicken genome provide unique perspectives on vertebrate evolution. Nature. 2004;432:695–716. doi: 10.1038/nature03154. [DOI] [PubMed] [Google Scholar]
- Hubbard TJP, Aken BL, Beal K, Ballester B, Caccamo M, Chen Y, Clarke L, Coates G, Cunningham F, Cutts T, et al. Ensembl 2007. Nucleic Acids Res. 2007;35((Database issue)):D610–7. doi: 10.1093/nar/gkl996. [DOI] [PMC free article] [PubMed] [Google Scholar]
- Hughes S, Zelus D, Mouchiroud D. Warm-blooded isochore structure in the Nile crocodile and turtle. Mol Biol Evol. 1999;16:1521–7. doi: 10.1093/oxfordjournals.molbev.a026064. [DOI] [PubMed] [Google Scholar]
- IHGSC. Initial sequencing and analysis of the human genome. Nature. 2001;409:860–921. doi: 10.1038/35057062. [DOI] [PubMed] [Google Scholar]
- Jabbari K, Caccio S, Pais de Barros JP, Desgres J, Bernardi G. Evolutionary changes in CpG and methylation levels in the genome of vertebrates. Gene. 1997;205:109–18. doi: 10.1016/s0378-1119(97)00475-7. [DOI] [PubMed] [Google Scholar]
- Karolchik D, et al. The UCSC genome browser database. Nucleic Acids Res. 2003;31:51–4. doi: 10.1093/nar/gkg129. [DOI] [PMC free article] [PubMed] [Google Scholar]
- Kent WJ, Sugnet CW, Furey TS, Roskin KM, Pringle TH, Zahler AM, Haussler D. The human genome browser at UCSC. Genome Res. 2002;12:996–1006. doi: 10.1101/gr.229102. [DOI] [PMC free article] [PubMed] [Google Scholar]
- Kumazawa Y. Mitochondrial genomes from major lizard families suggest their phylogenetic relationships and ancient radiations. Gene. 2007;388:19–26. doi: 10.1016/j.gene.2006.09.026. [DOI] [PubMed] [Google Scholar]
- Lander ES, Linton LM, Birren B, Nusbaum C, Zody MC. Initial sequencing and analysis of the human genome. Nature. 2001;409:860–921. doi: 10.1038/35057062. [DOI] [PubMed] [Google Scholar]
- Lawson R, Slowinski JB, Crother BI, Burbrink FT. Phylogeny of the colubroidea (Serpentes): new evidence from mitochondrial and nuclear genes. Mol Phylogenet Evol. 2005;37:581–601. doi: 10.1016/j.ympev.2005.07.016. [DOI] [PubMed] [Google Scholar]
- Lee MSY, Hugall AF, Lawson R, Scanlon JD. Phylogeny of snakes (Serpentes): combining morphological and molecular data in likelihood, Bayesian and parsimony analyses. System Biodivers. 2007;5:371–89. [Google Scholar]
- Lynch M. The origins of eukaryotic gene structure. Mol Biol Evol. 2006;23:450–68. doi: 10.1093/molbev/msj050. [DOI] [PubMed] [Google Scholar]
- Lynch M. Sunderland: Sinauer Associates; 2007. The origins of genome architecture. [Google Scholar]
- Maddison WP, Maddison DR. Mesquite: a modular system for evolutionary analysis. 2007. Version 2.01. Available at: mesquiteproject.org.
- Meunier J, Duret L. Recombination drives the evolution of GC-content in the human genome. Mol Biol Evol. 2004;21:984–90. doi: 10.1093/molbev/msh070. [DOI] [PubMed] [Google Scholar]
- Nakatani Y, Takeda H, Kohara Y, Morishita S. Reconstruction of the vertebrate ancestral genome reveals dynamic genome reorganization in early vertebrates. Genome Res. 2007;17:1254–65. doi: 10.1101/gr.6316407. [DOI] [PMC free article] [PubMed] [Google Scholar]
- Near T, Meylan P, Shaffer HB. Assessing concordance of fossil calibration points in molecular clock studies: an example using turtles. Am Nat. 2005;165:137–46. doi: 10.1086/427734. [DOI] [PubMed] [Google Scholar]
- Olmo E. Rate of chromosome changes and speciation in reptiles. Genetica. 2005;125:185–203. doi: 10.1007/s10709-005-8008-2. [DOI] [PubMed] [Google Scholar]
- Olmo E, Capriglion T, Odierna G. Different genomic evolutionary rates in the various reptile lineages. Gene. 2002;295:317–21. doi: 10.1016/s0378-1119(02)00685-6. [DOI] [PubMed] [Google Scholar]
- Organ CL, Shedlock AM, Meade A, Pagel M, Edwards SV. Origin of avian genome size and structure in nonavian dinosaurs. Nature. 2007;446:180–4. doi: 10.1038/nature05621. [DOI] [PubMed] [Google Scholar]
- Pagel MD. Inferring evolutionary processes from phylogenies. Zool Scripta. 1997;26:331–48. [Google Scholar]
- Pagel MD. Inferring the historical patterns of biological evolution. Nature. 1999;401:877–84. doi: 10.1038/44766. [DOI] [PubMed] [Google Scholar]
- Pigozzi MI, Solari AJ. The ZW pairs of two paleognath birds from two orders show transitional stages of sex chromosome differentiation. Chromosome Res. 1999;7:541–51. doi: 10.1023/a:1009241528994. [DOI] [PubMed] [Google Scholar]
- Rest JS, Ast JC, Austin CC, Waddell PJ, Tibbetts EA, Hay JM, Mindella DP. Molecular systematics of primary reptilian lineages and the tuatara mitochondrial genome. Mol Phylogenet Evol. 2003;29:289–97. doi: 10.1016/s1055-7903(03)00108-8. [DOI] [PubMed] [Google Scholar]
- Rodionov V. Micro versus macro, a review of structure and functions of avian micro- and macrochromosomes. Russ J Genet. 1996;32:97–608. [Google Scholar]
- Rodionov V, Chelysheva LA, Solovei IV, Myakoshina YA. Chiasmata distribution in lampbrush chromosomes of the chicken Gallus gallus domesticus: recombination hot spots and their possible significance for correct disjunction of homologous chromosomes in the first meiotic division. Russ J Genet. 1992;28:151–60. [PubMed] [Google Scholar]
- Rodionov V, Myakoshina YA, Chelysheva LA, Solovei IV, Gaginskaya ER. Chiasmata on lampbrush chromosomes of Gallus gallus domesticus: a cytogenetic study of recombination frequency and linkage group lengths. Russ J Genet. 1992;28:53–63. [Google Scholar]
- SAS_Institute. Cary, NC: SAS Institute Inc; 2006. JMP. Version 6.03. [Google Scholar]
- Shedlock AM. Phylogenomic investigation of CR1 LINE diversity in reptiles. Syst Biol. 2006;55:902–11. doi: 10.1080/10635150601091924. [DOI] [PubMed] [Google Scholar]
- Shedlock AM, Botka CW, Zhao S, Shetty J, Zhang T, Liu JS, Deschavanne PJ, Edwards SV. Phylogenomics of non-avian reptiles and the structure of the ancestral amniote genome. Proc Natl Acad Sci USA. 2007;104:2767–72. doi: 10.1073/pnas.0606204104. [DOI] [PMC free article] [PubMed] [Google Scholar]
- Shibusawa M, Nishibori M, Nishida-Umehara C, Tsudzuki M, Masabanda J, Griffin DK, Matsuda Y. Karyotypic evolution in the Galliformes: an examination of the process of karyotypic evolution by comparison of the molecular cytogenetic findings with the molecular phylogeny. Cytogenet Genome Res. 2004;106:111–9. doi: 10.1159/000078570. [DOI] [PubMed] [Google Scholar]
- Smith J, et al. Differences in gene density on chicken macrochromosomes and microchromosomes. Anim Genet. 2000;31:96–103. doi: 10.1046/j.1365-2052.2000.00565.x. [DOI] [PubMed] [Google Scholar]
- Springer MS, Stanhope MJ, Madsen O, de Jong WW. Molecules consolidate the placental mammal tree. Trends Ecol Evol. 2004;19:430–8. doi: 10.1016/j.tree.2004.05.006. [DOI] [PubMed] [Google Scholar]
- Tajima S, Suetake I. Regulation and function of DNA methylation in vertebrates. J Biochem. 1998;123:993–9. doi: 10.1093/oxfordjournals.jbchem.a022066. [DOI] [PubMed] [Google Scholar]
- Takagi N, Sasaki M. A phylogenetic study of bird karyotypes. Chromosoma. 1974;46:91–120. doi: 10.1007/BF00332341. [DOI] [PubMed] [Google Scholar]
- Varrialea A, Bernardi G. DNA methylation in reptiles. Gene. 2006;385:122–7. doi: 10.1016/j.gene.2006.05.034. [DOI] [PubMed] [Google Scholar]
- Venter JC, et al. The sequence of the human genome. Science. 2001;291:1304–51. doi: 10.1126/science.1058040. [DOI] [PubMed] [Google Scholar]
- Vidal N, Delmas A-S, David P, Cruaud C, Couloux A, Hedges SB. The phylogeny and classification of caenophidian snakes inferred from seven nuclear protein-coding genes. Comptes Rendus Biologies. 2007;330:182–7. doi: 10.1016/j.crvi.2006.10.001. [DOI] [PubMed] [Google Scholar]
- Vidal N, Hedges SB. The phylogeny of squamate reptiles (lizards, snakes, and amphisbaenians) inferred from nine nuclear protein-coding genes. Comptes Rendus Biologies. 2005;328:1000–8. doi: 10.1016/j.crvi.2005.10.001. [DOI] [PubMed] [Google Scholar]
- Waltari E, Edwards SV. Evolutionary dynamics of intron size, genome size, and physiological correlates in archosaurs. Am Nat. 2002;160:539–52. doi: 10.1086/342079. [DOI] [PubMed] [Google Scholar]
- Warren WC, Hillier LW, Marshall Graves JA, Birney E, Ponting CP, Grützner F, Belov K, Miller W, Clarke L, Chinwalla AT, et al. Genome analysis of the platypus reveals unique signatures of evolution. Nature. 2008;453:175–83. doi: 10.1038/nature06936. [DOI] [PMC free article] [PubMed] [Google Scholar]
- Webster MT, Axelsson E, Ellegren H. Strong regional biases in nucleotide substitution in the chicken genome. Mol Biol Evol. 2006;23:1203–16. doi: 10.1093/molbev/msk008. [DOI] [PubMed] [Google Scholar]
- Wiens JJ, Brandley MC, Reeder TW. Why does a trait evolve multiple times within a clade? Repeated evolution of snake-like body form in squamate reptiles. Evolution. 2006;60:123–41. [PubMed] [Google Scholar]
- Wong KK, et al. A comprehensive analysis of common copy-number variations in the human genome. Am J Hum Genet. 2007;80:91–104. doi: 10.1086/510560. [DOI] [PMC free article] [PubMed] [Google Scholar]