Abstract
An electrochemical immunosensing method was developed to detect melanoma cells based on the affinity between cell surface melanocortin 1 receptor (MC1R) antigen and anti-MC1R antibody (MC1R-Ab). The MC1R-Abs were immobilized in amino-functionalized silica nanoparticles (n-SiNPs)-polypyrrole (PPy) nanocomposite modified on working electrode surface of screen-printed electrode (SPE). Cyclic voltammetry was employed, with the help of redox mediator ([Fe(CN)6]3−), to measure the change in anodic oxidation peak current arising due to the specific interaction between MC1R antigens and MC1R-Abs when the target melanoma cells are present in the sample. Various factors affecting the sensor performance, such as the amount of MC1R-Abs loaded, incubation time with the target melanoma cells, the presence of interfering non-melanoma cells, were tested and optimized over different expected melanoma cell loads in the range of 50–7500 cells/2.5 mL. The immunosensor is highly sensitive (20 cells/mL), specific, and reproducible, and the antibody-loaded electrode in ready-to-use stage is stable over two weeks. Thus, in conjunction with a microfluidic lab-on-a-chip device our electrochemical immunosensing approach may be suitable for highly sensitive, selective, and rapid detection of circulating tumor cells (CTCs) in blood samples.
Keywords: Circulating tumor cells (CTCs), Melanoma, Cyclic voltammetry, Electrochemical immunosensing
1. Introduction
Cancer is a leading cause of death around the world. Melanoma is widely prevalent and the number of melanoma cases and associated mortality have rapidly increased in the United States (US) and worldwide over the past several years (Desmond and Soong, 2003; Jemal et al., 2001; Linos et al., 2009). On average, metastatic melanoma patients survive six to nine months, with an overall survival rate of 40% (Shivers et al., 1998). When a cancer metastasizes, the tumor cells begin to circulate in blood and lymphatic system (Joosse and Pantel, 2013; Williams, 2013). During the early phase of metastasis, only few circulating tumor cells (CTCs) are present in blood along with millions of leukocytes and billions of erythrocytes (Joosse and Pantel, 2013; Williams, 2013). Thus, quantification and enumeration of CTCs at an early stage of cancer progression is of significant prognostic value.
Based on real-time polymerase chain reaction (RT-PCR) analyses of peripheral blood, specific mRNA for tyrosinase (Kunter et al., 1996; Smith et al., 1991), MelanA/MART-1 (Kiyohara et al., 2014; Schittek et al., 1999), and glycoprotein (gp)100 (Tsukamoto et al., 2000) are considered as indicative of the presence of circulating melanoma cells (CMCs). However, the detection methods based on these markers lack sensitivity or selectivity and often produce false-positive results. Therefore, immunological methods are pursued for identification and detection of CTCs based on cancer cell surface protein markers. The US FDA has approved the CELLSEARCH®CTC Test Kit (Janssen Diagnostics, Raritan, NJ) for detecting CTCs in blood using immunomagnetic separation (Paterlini-Brechot and Benali, 2007; Riethdorf et al., 2007). This method detects CTCs expressing epithelial cell-adhesion molecule (EpCAM) and cytokeratins only. However, the ability of CELLSEARCH® CTC Test to detect other cell surface markers has been questioned (Joosse and Pantel, 2013), and if the cells express low or no EpCAM, this test may fail to detect the tumor altogether (Riethdorf et al., 2007). A lab-on-a-chip method was developed for detecting CTCs based on the affinity between EpCAM and its antibody (Maheswaran et al., 2008; Nagrath et al., 2007; Stott et al., 2010; Yoon et al., 2013), which is somewhat complicated and time-consuming. A semi-integrated electrical biosensor was also developed for CTCs detection in blood via immunomagnetic and size-based separation (Chung et al., 2011). Zhao et al. (2013) developed an ensemble decision aliquot ranking method to detect CTCs. Hou et al. (2013) reported a nanovelcro CTCs assay for isolation of single tumor cell in addition to effectively capturing CMCs. However, their method of detection requires several steps of manipulation of the blood prior to detection.
Several label-free immunosensing methods have been reported for the detection of cancer cells including surface-enhanced Raman spectroscopy (Wang et al., 2011) and electrochemical methods (Hu et al., 2013; Moscovici et al., 2013). Among these, the electrochemical methods have many advantages such as simple, rapid, inexpensive, unaffected by sample turbidity, and ultrasensitive for detecting various target analytes in complex biological samples (Drummond et al., 2003; Karimi-Maleh et al., 2013, 2014a, 2014b; Moradi et al., 2013). Therefore, electrochemical immunosensors are being developed incorporating a variety of nanoparticles, such as gold and silica, as labels to dramatically enhance the signal intensity (Chikkaveeraiah et al., 2012; Cui et al., 2014; Gao et al., 2013; Ho et al., 2010; Liu and Jiang, 2006; Rusling, 2012; Wang et al., 2014a; Wu et al., 2013). The nanofunctionalized electrode surface also affords effective immobilization of antibody with good stability and bioactivity. Wilson (2005) reported an electrochemical immunosensor for simultaneous detection of colorectal cancer and liver cancer markers. Liu and Jiang developed an electrochemical immunosensor (anti-carcinoembryonic antigen (CEA) antibody immobilized on colloidal silica nanoparticles/titania sol–gel composite membrane on gold electrode) for detecting CEA markers with a detection limit of 0.5 ng/mL (Liu and Jiang, 2006). Domnanich et al. (2011) used a protein immobilized on xanthan/chitosan-modified gold-chip microarray for detecting melanoma-relevant markers in picomolar range. Kelly group designed an aperture sensor array for electrochemical detection of prostate cancer cells in 15 min (Moscovici et al., 2013). Many have investigated label-free, multistep sandwich assays to detect cancer markers by measuring signal changes due to the affinity between two antibodies that recognize a cell surface antigen on an electrode surface (Chikkaveeraiah et al., 2012; Cui et al., 2014; Rusling, 2012; Wang et al., 2014a). Wang et al. (2014b) used S100B as a serum biomarker to detect melanoma in blood by an electrochemical assay; however, S100B is not specific to melanoma. Thus, in general, many of the existing methods lack in one or more of the following important attributes: sensitivity, selectivity, simplicity, and rapidity.
The MC1R is a G-protein-coupled receptor, expressed highly selectively by melanocytes and melanoma cells. It is expressed in a majority (>80%) of melanoma lines and also primary and meta-static cutaneous melanomas compared to other cell surface markers (Raposinho et al., 2010; Salazar-Onfray et al., 2002; Schwahn et al., 2001; Xia et al., 1996). It is also useful marker for the diagnosis of uveal melanoma. Therefore, we selected MC1R as target marker for the detection of melanoma cells. Herein, we report an electrochemical immunosensing system for highly sensitive and specific detection of melanoma cells in complex environments using the melanoma-specific cell surface protein melanocortin 1 receptor (MC1R) as a target marker. We immobilized anti-MC1R antibodies (MC1R-Abs) on amino-functionalized silica nanoparticles (n-SiNPs)-polypyrrole (PPy) nanocomposite thin film modified screen-printed electrode (SPE) and used as an immunosensor. The change in the anodic oxidation current obtained via cyclic voltammetry (CV) resulting from the affinity between MC1R antigens and MC1R-Abs on the immunosensor was used for detecting the melanoma cells.
2. Material and methods
MC1R-Abs (200 μg/mL) were obtained from Santa Cruz Bio-technology Inc. (Santa Cruz, CA). Tetraethoxysilane, (3-aminopropyl) triethoxysilane, pyrrole, carbonyldiimidazole, ammonium hydroxide (28–30%), and ethylenediaminetetraacetic acid (EDTA) were purchased from Sigma-Aldrich, Alfa Aesar, and Acros Organics. All chemicals were of analytical grade and used as received, unless otherwise stated. Highly pure deionized (DI) water (resistivity=18.2 MΩ cm, Milli-Q gradient system, Millipore) was used for all experiments.
The peripheral blood mononuclear cells (PBMCs) were obtained from Microtechnology and Medicine Biology Laboratory at the University of Wisconsin-Madison. The total number of PBMCs was counted by hemocytometer and the required cell number was adjusted by serial dilution.
2.1. Cell culture and cell suspension preparation
Melanoma (WM-35, SK-MEL-2) and non-melanoma (human embryonic kidney (HEK)-293) cell lines were obtained from American Type Culture Collection (Manassas, VA), and cultured under standard tissue culture conditions at 37 °C and 5% CO2 (Maddodi et al., 2010). Cells were dislodged from the surface of the culture dish by using 0.25% Trypsin–EDTA (Life Technologies, Grand Island, NY), or 2% EDTA solution in 1 × PBS (Sigma, St. Louis, MO), or a cell scraper (Sarstedt, Newton, NC). The cells were collected and viable cell numbers were estimated by counting them in a hemocytometer using Trypan-blue (Sigma, USA). The cell suspension was centrifuged at 1000 rpm for 5 min at 4 °C and cell pellet was suspended in sterile 1 × PBS (pH 7.4) for further analysis.
2.2. Electrochemical measurement
Electrochemical experiments were performed using CHI-660D electrochemical workstation (CH Instruments Inc., USA) using conventional disposable SPEs (3-mm diameter carbon working electrode, carbon counter electrode, and silver/silver chloride reference electrode). The working electrode surface of SPE was modified (described below) by electrochemically incorporated the n-SiNPs in PPy matrix and immobilizing MC1R-Abs to obtain an immunosensor. CV was performed in 1 × PBS solution (pH 7.4) containing 1 mM ferricyanide; [Fe(CN)6]3−, 0.1 M KCl, and 100 μM EDTA at room temperature for all experiments. All cyclic voltammograms were recorded by taking three successive scans between −0.2 and +0.8 V at a scan rate of 50 mVs−1.
2.3. Synthesis of amino-functionalized silica nanoparticles
Silica nanoparticles (SiNPs) were synthesized according to Wu et al. (2009). Briefly, 80 mL of absolute ethanol, 4.85 mL of DI water, and 3.6 mL of ammonium hydroxide (28–30%) were taken in a round-bottom flask and heated at 55 °C with stirring. To this, a mixture of 3.1 mL of tetraethoxysilane and 8 mL of absolute ethanol was added immediately. Then, the stirring was continued for 5 h at 55 °C to obtain colloidal SiNPs, which were then centrifuged and washed thrice with ethanol and DI water. To amino-functionalize the SiNPs, 300 μL of (3-aminopropyl)triethoxysilane (APTS) was quickly added into the colloidal SiNPs solution with vigorous stirring. The reaction was carried out at room temperature for 2 h and then at 50 °C for 1 h. The synthesized n-SiNPs were centrifuged, washed, and dispersed in absolute ethanol. The centrifugation and washing steps were repeated at least five times to remove unreacted APTS. The size of the SiNPs was measured to be 37±5 nm using a particle size analyzer (90 plus, Brookhaven Instruments Corporation, USA). The FT-IR spectral characterization of synthesized SiNPs and n-SiNPs is shown in Fig. S1 (see Supplementary material).
2.4. Fabrication of MC1R-Abs-immobilized n-SiNPs/PPy nanocomposite on SPE
2.4.1. Fabrication of n-SiNPs/PPy nanocomposite on SPE
The stepwise fabrication of label-free immunosensor is illustrated in Scheme 1A. First, we fabricated n-SiNPs incorporated PPy matrix on SPE via electrochemical polymerization method. Briefly, N2 purged 0.1 M of pyrrole monomer and n-SiNPs solutions were ultrasonicated for 15 min at room temperature to obtain a homogeneous mixture of n-SiNPs/pyrrole and immediately dispersed into 0.1 M KCl solution. Then, n-SiNPs/PPy nanocomposite thin film was grown on the working electrode under N2 atmosphere by CV at an applied potential of 0.0 to +0.9 V vs. Ag/AgCl at a scan rate of 50 mVs−1 for 10 cycles. During this step, the pyrrole monomer is oxidized and electrochemically polymerized on the working electrode along with the incorporation of n-SiNPs. PPy-modified SPE (PPy/SPE) was prepared by the above procedure without n-SiNPs and ultrosonication to evaluate the effect of n-SiNPs modification of SPE on the electrochemical properties. Prior to use, the electrodes were carefully rinsed with DI water and dried with N2. Ten cycles of pyrrole electropolymerization was applied because it increased the conducting property of the sensor, effective nanoparticles incorporation, and afforded good bio-compatibility (Rajesh et al., 2010a, 2010b; Razola et al., 2002); it also helped to enhance the loading of MC1R-Abs on the n-SiNPs surface and avoid fouling of MC1R-Abs.
Scheme 1.
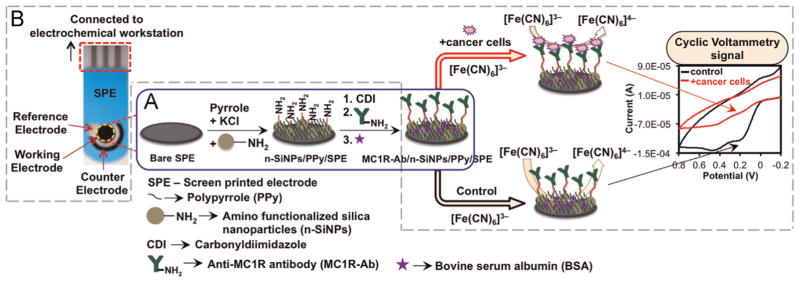
Schematic of (A) fabrication of the immunosensor and (B) reaction occurring at the working electrode surface in 1 × PBS solution at pH 7.4 containing 1 mM[Fe(CN)6]3−, 0.1 M KCl, and 100 μM EDTA at scan rate 50 mV s−1.
2.4.2. Immobilization of MC1R-Ab on n-SiNPs/PPy nanocomposite
For immobilization of MC1R-Abs, first the n-SiNPs/PPy/SPE was activated with 0.5 M carbonyldiimidazole (CDI) for 3 h at room temperature, which forms a very stable linkage and helps increase the amount of MC1R-Abs that can be loaded and thus improves the sensor stability and sensitivity. After that, 1 μL (200 ng) aliquot of MC1R-Ab (200 μg/mL) was placed on the modified electrode surface and incubated overnight at 4 °C. After the incubation, the modified electrode was washed with 1 × PBS solution to remove unbound MC1R-Abs. To minimize non-specific binding (Hou et al., 2013), the electrode was incubated in 1% BSA to block unoccupied sites on the electrode, for 30 min and washed with 1 × PBS solution. This Ab-loaded ready-to-use immunosensor was designated as MC1R-Ab/n-SiNPs/PPy/SPE.
3. Results and discussion
According to the reported methods, PPy on the electrode surface offers many advantages such as microporous structure, fast electron transfer rate, large surface area, good electrochemical properties, enhanced conducting pathways, entrapment of large number of nanoparticles (Lyons, 1994; Rajesh et al., 2010a; Raveh et al., 2013; Razola et al., 2002). Therefore, we incorporated n-SiNPs in the microporous PPy matrix deposited on the SPE surface and immobilized MC1R-Abs on n-SiNPs using CDI as a crosslinking agent. A schematic representation of sensing that occurs at the electrode surface via an electron transfer reaction in the presence of a redox mediator, [Fe(CN)6]3− via CV is depicted in Scheme 1B. When target cells are present, MC1R antigens interact specifically with MC1R-Abs immobilized on the n-SiNPs/PPy nanocomposite. This antibody–antigen interaction blocks the surface of the immunosensor, which hinders the electron transfer reaction between [Fe(CN)6]3− and sensor surface, and lowers the voltammetric peak (Moscovici et al., 2013). Based on this tumor specific marker targeting method and change in current signal, we can easily detect and enumerate the total number of melanoma cells.
3.1. Characterization of the fabricated working electrode
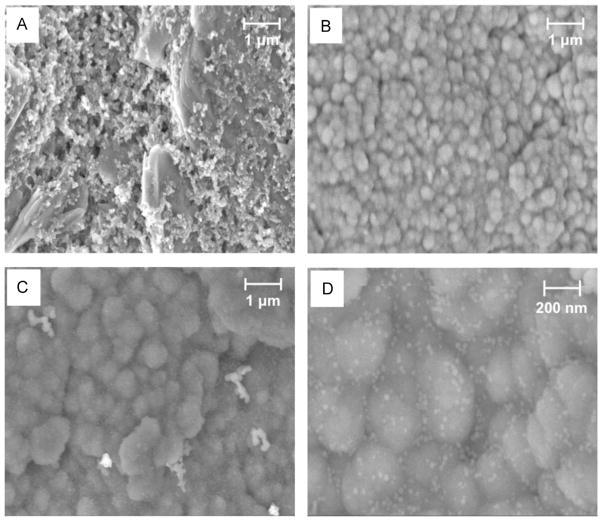
The surface morphology of the bare SPE, PPy/SPE, and n-SiNPs/PPy/SPE were characterized by scanning electron microscopy (SEM) (Fig. 1A–D). The surface of PPy film exhibits the typical uniform granular morphology with narrow particle size distribution (Fig. 1B, C), which provides high surface area to incorporate a large number of n-SiNPs in PPy matrix (Fig. 1C). The SiNPs in PPy matrix are clearly seen as white dots in Fig. 1D. Thus, we were successful in growing n-SiNPs more uniformly and incorporating them more efficiently in the PPy matrix than what was possible with previously reported methods (Raveh et al., 2013). Fig. S2 (see Supplementary material) shows FTIR results of bare, PPy-modified and n-SiNPs-PPy-modified SPEs.
Fig. 1.
SEM micrographs of (A) bare SPE, (B) PPy/SPE, (C) n-SiNPs/PPy/SPE and (D) enlarged area of (C) showing SiNPs (white dots).
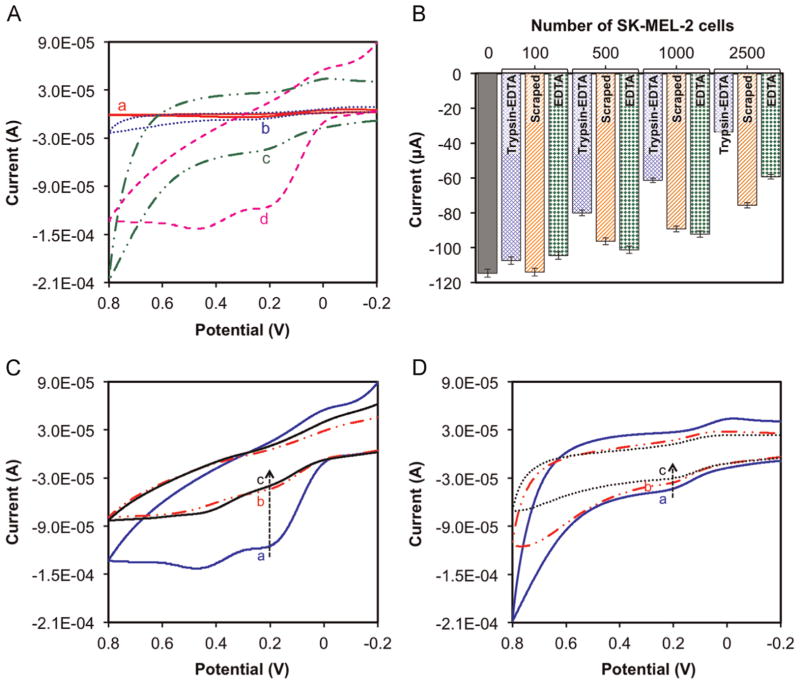
The stepwise fabrication of surface modified electrodes were further characterized by CV in 1 × PBS solution at pH 7.4 containing 1 mM [Fe(CN)6]3−, 0.1 M KCl and 100 μM EDTA. We measured the change in oxidation and reduction peaks of each fabricated electrode with the help of redox mediator; [Fe(CN)6]3−. Fig. 2A shows the characteristic CV peaks obtained from oxidation/reduction of [Fe(CN)6]3− on bare SPE (curve a), PPy/SPE (curve b), n-SiNPs/PPy/SPE (curve c), and MC1R-Ab/n-SiNPs/PPy/SPE (curve d). A pair of well-defined and quasi-reversible redox peaks were observed for bare SPE (curve a), PPy/SPE (curve b), and n-SiNPs/PPy/SPE (curve c) respectively. From the CV results shows the anodic peak current of n-SiNPs-PPy nanocomposite modified on SPE surface (−43.8 μA) is larger than PPy-SPE (−6.69 μA) and bare SPE (−4.13 μA). This clearly reveals that the n-SiNPs/PPy nanocomposite thin film provides the necessary conductive pathways on the SPE surface and affords good electrocatalytic property, stability, and enhanced electron transfer ability (Rajesh et al., 2010a, 2010b). It also confirms that PPy is a good conductor and provides a highly porous matrix structure to entrap a large number of n-SiNPs at the modified electrode surface without being denatured (Rajesh et al., 2010a, 2010b). The quasi-reversible peak of MC1R-Ab/n-SiNPs/PPy/SPE (Fig. 2A, ‘curve d’) demonstrates that MC1R-Abs are effectively immobilized on the electrode surface. The immobilization of MC1R-Abs on the electrode surface was further confirmed with melanoma (SK-MEL-2 and WM-35) cells and comparing the electrochemical signal obtained using immunosensor in the presence and absence of the above cells.
Fig. 2.
(A) Typical cyclic voltammograms of (a) bare SPE (b) PPy/SPE, (c) n-SiNPs/PPy/SPE and (d) MC1R-Ab/n-SiNPs/PPy/SPE in 1 × PBS solution at pH 7.4 containing 1 mM[Fe(CN)6]3−, 0.1 M KCl, and 100 μM EDTA at scan rate 50 mV s−1. (B) Effect of the cell collection method (Tyrpsin–EDTA, by using 0.25% Trypsin–EDTA; scraped, by using a cell scraper; EDTA, by using 2% EDTA solution in 1 × PBS) on signal current for different SK-MEL-2 cell loads. CV responses of the immunosensor with (C) and without (D) MC1R-Abs in the absence (a) and in the presence of (b) 7500 SK-MEL-2 cells/2.5 mL and (c) 7500 WM-35 cells/2.5 mL. Experimental parameters: 1 × PBS solution at pH 7.4 containing 1 mM [Fe(CN)6]3−, 0.1 M KCl, 100 μM EDTA, room temperature; scan rate 50 mV s−1.
3.2. Immunosensor performance and detection of cultured melanoma cells
We investigated the response of the immunosensor to 100, 500, 1000 and 2500 SK-MEL-2 cells collected by detaching them with Trypsin–EDTA or by scraping with a cell scraper or EDTA methods (Fig. 2B). CV was recorded at three successive potential scan ranges from −0.2 to +0.8 V at scan rate 50 mV s−1 in 1 × PBS solution (pH 7.4) containing 1 mM [Fe(CN)6] 3−, 0.1 M KCl, and 100 μM EDTA at room temperature after 15 min incubation of immunosensor with the above SK-MEL-2 concentrations. The CV results confirm that the cells collected by Trypsin–EDTA method yield the best electrochemical response compared to those obtained by scraping or EDTA, and hence were used for the rest of the experiments.
Fig. 2C shows the cyclic voltammogram of MC1R-Ab/n-SiNPs/PPy/SPE in the absence and in the presence of SK-MEL-2 and WM-35 cells (each 7500 cells/2.5 mL) under optimal experimental conditions. Prior to cell loading, the immunosensor displayed an anodic peak current of −114.6 μA at +0.195 V (Fig. 2C, ‘curve a’), which corresponds to electrochemical reaction between [Fe(CN)6]3− and the sensor surface. The electrochemical signal decreased almost three-fold to −40 μA (Fig. 2C, ‘curve b’) and −36 μA (Fig. 2C, ‘curve c’) at +0.195 V, respectively after SK-MEL-2 and WM-35 cells each of 7500 cells/2.5 mL were introduced. This indicates, as expected, that the interaction between MC1R antigens and MC1R-Abs blocks the sensor surface, hinders the electron transfer reaction and lowers the voltammetric signal (Moscovici et al., 2013). Thus, the change in anodic peak current response of our immunosensor is directly related to the amount of captured cells. The obtained results are in agreement with those reported in the literature (Liu et al., 2013; Moscovici et al., 2013; Weng et al., 2011; Xu et al., 2013).
To further confirm that the inhibition of electron transfer occurs only due to the interaction between MC1R antigens and MC1R-Abs, the above experiments were repeated using electrodes without immobilized MC1R-Abs. In the absence of MC1R-Abs the signals produced were very weak in the presence of 7500 SK-MEL-2 cells (Fig. 2D, ‘curve b’) and 7500 WM-35 cells (Fig. 2D, ‘curve c’), and were comparable to that obtained with base (n-SiNPs/PPy/SPE) electrode (Fig. 2D, ‘curve a’). Weak signals observed are presumably due to non-specific physical interaction of melanoma cells with electrode surface. Given the substantial (three-fold) decrease in current signal obtained with MC1R-Ab-modified electrode (MC1R-Ab/n-SiNPs/PPy/SPE) for the same cell loads (Fig. 2C), these non-specific interactions are negligible (Fig. 2D). Thus, the signals obtained with our immunosensor can be used todetect and enumerate melanoma cells.
3.3. Optimization of MC1R-Ab loading and incubation time for melanoma cells detection
To further improve the performance of our immunosensor, we optimized the antibody loading and effective detection of target melanoma cells with respect to incubation time. Fig. 3A shows the anodic peak currents obtained with different amounts of MC1R-Abs loaded on the sensor surface and incubated for 15 min with 2500 and 7500 SK-MEL-2 cells/2.5 mL. In both cases, the signal increased substantially when the amount of MC1R-Abs loaded was increased from 100 to 200 ng, but remained almost unchanged with 400 ng of MC1R-Abs loaded. Therefore, we used 200 ng of MC1R-Abs loading for further experiments.
Fig. 3.
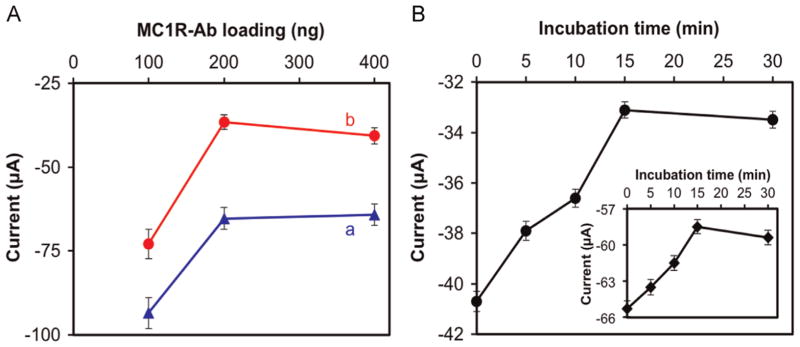
Peak anodic current responses of the immunosensor as a function of (A) amount of MC1R-Abs loaded and incubated for 15 min with (a) 2500 SK-MEL-2 cells/2.5 mL, and (b) 7500 SK-MEL-2 cells/2.5 mL. (B) The immunosensor was incubated in 7500 SK-MEL-2 cells/2.5 mL under various incubation times. Inset in “B” is the response for 2500 SK-MEL-2 cells/2.5 mL. Experimental conditions: 1 × PBS solution (pH 7.4) containing 1 mM [Fe(CN)6] 3−, 0.1 M KCl, and 100 μM EDTA at room temperature; scan rate=50 mV s−1. Error bars represent standard deviations of three independent measurements. detect and enumerate melanoma cells.
The effect of incubation time to interact 2500 and 7500 SK-MEL-2 cells/2.5 mL, using 200 ng MC1R-Abs, is shown in Fig. 3B. The signal increased almost linearly from 0 to 15 min of incubation and then leveled off. Therefore, a 15-min incubation was considered optimal.
3.4. Linearity, sensitivity, and reproducibility
The decreases in anodic peak current at the potential +0.195 V with number of SK-MEL-2 and WM-35 cells, each from 0 to 7500 cells/2.5 mL are presented in Fig. 4A and B, respectively. These data were obtained using triplicate measurements (n=3) under optimal test conditions (200 ng of MC1R-Ab, 15 min of incubation). The current response were better represented by two linear segments: one form 50 to 1000 cells/2.5 mL (Fig. 4A, B) and the other from 1000 to 7500 cells/2.5 mL (Fig. 4A, B inset). The linear regressions in the 50 to 1000 cells/2.5 mL range for SK-MEL-2 and WM-35 cell lines are as follow:
where ipa is anodic peak current (μA), C is number of cells per 2.5 mL 1 × PBS solution. For both SK-MEL-2 and WM-35 cells, our detection limit is 20 cells/mL. This melanoma cell detection performance compares very favorably with those reported in the literature, which are summarized in Table S1 (see Supplementary material).
Fig. 4.
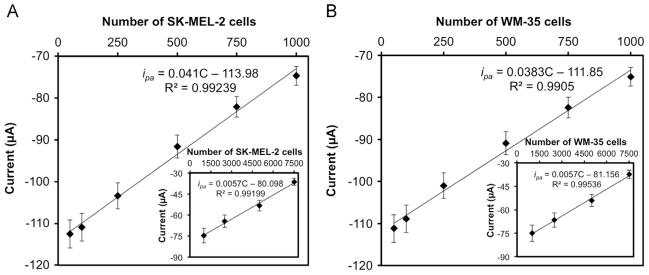
Linear calibration plots of anodic peak current obtained from CV vs. 50–1000 cells/2.5 mL of (A) SK-MEL-2 cells and (B) WM-35 cells (Insets in A and B are responses for 1000 to 7500 cells). Error bars represent standard deviations of three independent measurements under optimal experimental conditions.
The reproducibility of the immunosensor performance was tested by calculating relative standard deviation (%RSD) values of the measurements made using three MC1R-Ab/n-SiNPs/PPy/SPEs. The 4.5% RSD obtained indicates good reproducibility.
3.5. Selectivity and stability of the immunosensor
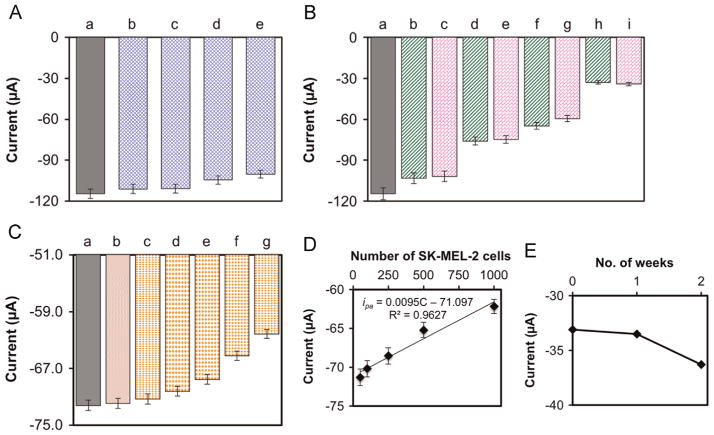
The selectivity of the immunosensor (MC1R-Ab/n-SiNPs/PPy/SPE) was tested via CV using non-melanoma HEK-293 cells in the absence and presence of SK-MEL-2 melanoma cells. We observed that in the absence of SK-MEL-2 cells (+0.195 V, −114.6 μA), even 10,000 HEK-293 cells (+0.195 V, −100.2 μA) did not produce a strong change in current signal (Fig. 5A). Furthermore, the change in current signals obtained with 100, 1000, 2500 and 7500 SK-MEL-2 cells were virtually unaffected by the presence of 10,000 HEK-293 cells (Fig. 5B). These results clearly indicate that the decrease in current signal obtained is inversely proportional to the number of melanoma cells, and not with non-melanoma cells. These data clearly demonstrate that the immunosensor is capable of selectively detecting melanoma cells in complex samples and that we can enumerate the number of melanoma cells present in samples based on the signal strength.
Fig. 5.
Immunosensor (MC1R-Ab/n-SiNPs/PPy/SPE) response (A) in the absence (a) and in the presence of (b) 500, (c) 2500, (d) 5000, (e) 10,000 HEK-293 cells; (B) for (a) 0, (b) 100 SK-MEL-2, (c) 100 SK-MEL-2+10,000 HEK-293, (d) 1000 SK-MEL-2, (e) 1000 SK-MEL-2 +10,000 HEK-293, (f) 2500 SK-MEL-2, (g) 2500 SK-MEL-2+10,000 HEK-293, (h) 7500 SK-MEL-2, and (i) 7500 SK-MEL-2+10,000 HEK-293 cells; (C) for (a) 0, (b) 5 ×10⁴ PBMCs+5 ×10⁴ HEK-293 cells, and (c) 50, (d) 100, (e) 250, (f) 500, and (g) 1000 SK-MEL-2 cells each along with 5 ×10⁴ PBMCs and 5 ×10⁴ HEK-293 cells. (D) Linear calibration curve of anodic peak current vs. 50–1000 SK-MEL-2 cells in the presence of 5 ×10⁴ PBMCs and 5 ×10⁴ HEK-293 cells. Values are mean of 3 measurements, and error bars are standard deviations under optimized experimental conditions. (E) Stability of the immunosensor as a function of storage time in 1 × PBS solution at 4 °C.
Further, we investigated the effects of the presence of 5 −104 PBMCs and 5 −104 HEK-293 cells on detecting SK-MEL-2 cells (from 50 to 1000 cells/100 μL) using differential pulse voltammetry technique (Fig. 5C). The results show no significant changes in current in the absence of SK-MEL-2 cells and in the presence of 5 −104 PBMCs and 5 −104 HEK-293 cells up to 15 min incubation time. However, in the presence of SK-MEL-2 cells from 50 to 1000 cells the anodic current signal changes due to specific interaction between MC1R-Abs on the electrode surface and MC1R antigens on the SK-MEL-2 cell surface. As shown in Fig. 5D, the current signal response was nearly linear (ipa =0.0095C–71.097, R2=0.963).
The long-term stability of the fabricated immunosensor was also determined by measuring anodic current responses with target 7500 SK-MEL-2 cells after storing the electrode in 1 × PBS at 4 °C for up to two weeks (Fig. 5E). The signal remained fairly constant for 1 week, with a modest decline after the second week. An RSD of 4.2% (n=3) indicated good stability over two weeks.
4. Conclusions
We have described the fabrication of a novel immunosensor for selective and sensitive detection of melanoma cells in both 1 × PBS and blood sample. The working electrode surface of the SPE was modified with n-SiNPs/PPy nanocomposite thin film, obtained via controlled in-situ electrochemical polymerization, which offers good electrical conductivity and affords effective immobilization of antibodies without denaturation. Using MC1R-Abs immobilized on n-SiNPs/PPy nanocomposite modified SPE, we achieved a detection limit of 20 cells/mL for melanoma cells. The immunosensor performance was linear and unaffected by the presence of 5 ×10⁴ HEK-293 cells and 5 ×10⁴ PBMCs. Further improvements to enhance the detection limit of this immunosensor in conjunction with a microfluidic system could lead to the development of a clinical diagnostic device suitable for rapid and sensitive detection and enumeration of CTCs.
Supplementary Material
Acknowledgments
Research reported in this project was supported by a Pilot and Feasibility grant and the Cell Culture Core of the UW Skin Diseases Research Center (SDRC) Grant 1P30AR066524 from the National Institute of Arthritis and Musculoskeletal and Skin Diseases of the National Institutes of Health. Authors gratefully acknowledge receiving PBMCs from Dr. David Beebe’s Micro-technology and Medicine Biology Laboratory, University of Wisconsin-Madison.
Appendix A. Supplementary material
Supplementary data associated with this article can be found in the online version at http://dx.doi.org/10.1016/j.bios.2015.01.022.
References
- Chikkaveeraiah BV, Bhirde AA, Morgan NY, Eden HS, Chen X. ACS Nano. 2012;6 (8):6546–6561. doi: 10.1021/nn3023969. [DOI] [PMC free article] [PubMed] [Google Scholar]
- Chung YK, Reboud J, Lee KC, Lim HM, Lim PY, Wang KY, Tang KC, Ji H, Chen Y. Biosens Bioelectron. 2011;26 (5):2520–2526. doi: 10.1016/j.bios.2010.10.048. [DOI] [PubMed] [Google Scholar]
- Cui Z, Wu D, Zhang Y, Ma H, Li H, Du B, Wei Q, Ju H. Anal Chim Acta. 2014;807:44–50. doi: 10.1016/j.aca.2013.11.025. [DOI] [PubMed] [Google Scholar]
- Desmond RA, Soong SJ. Surg Clin North Am. 2003;83 (1):1–29. doi: 10.1016/s0039-6109(02)00092-0. [DOI] [PubMed] [Google Scholar]
- Domnanich P, Pena DB, Preininger C. Biosens Bioelectron. 2011;26 (5):2559–2565. doi: 10.1016/j.bios.2010.11.006. [DOI] [PubMed] [Google Scholar]
- Drummond TG, Hill MG, Barton JK. Nat Biotechnol. 2003;21 (10):1192–1199. doi: 10.1038/nbt873. [DOI] [PubMed] [Google Scholar]
- Gao ZD, Guan FF, Li CY, Liu HF, Song YY. Biosens Bioelectron. 2013;41:771–775. doi: 10.1016/j.bios.2012.10.006. [DOI] [PubMed] [Google Scholar]
- Ho JA, Chang HC, Shih NY, Wu LC, Chang YF, Chen CC, Chou C. Anal Chem. 2010;82 (14):5944–5950. doi: 10.1021/ac1001959. [DOI] [PubMed] [Google Scholar]
- Hou S, Zhao L, Shen Q, Yu J, Ng C, Kong X, Wu D, Song M, Shi X, Xu X, OuYang WH, He R, Zhao XZ, Lee T, Brunicardi FC, Garcia MA, Ribas A, Lo RS, Tseng HR. Angew Chem Int Ed Engl. 2013;52 (12):3379–3383. doi: 10.1002/anie.201208452. [DOI] [PMC free article] [PubMed] [Google Scholar]
- Hu Y, Zuo P, Ye BC. Biosens Bioelectron. 2013;43:79–83. doi: 10.1016/j.bios.2012.11.028. [DOI] [PubMed] [Google Scholar]
- Jemal A, Devesa SS, Hartge P, Tucker MA. J Natl Cancer Inst. 2001;93 (9):678–683. doi: 10.1093/jnci/93.9.678. [DOI] [PubMed] [Google Scholar]
- Joosse SA, Pantel K. Cancer Res. 2013;73 (1):8–11. doi: 10.1158/0008-5472.CAN-12-3422. [DOI] [PubMed] [Google Scholar]
- Karimi-Maleh H, Biparva P, Hatami M. Biosens Bioelectron. 2013;48:270–275. doi: 10.1016/j.bios.2013.04.029. [DOI] [PubMed] [Google Scholar]
- Karimi-Maleh H, Sanati AL, Gupta VK, Yoosefian M, Asif M, Bahari A. Sens Actuators B: Chem. 2014a;204:647–654. [Google Scholar]
- Karimi-Maleh H, Tahernejad-Javazmi F, Ensafi AA, Moradi R, Mallakpour S, Beitollahi H. Biosens Bioelectron. 2014b;60:1–7. doi: 10.1016/j.bios.2014.03.055. [DOI] [PubMed] [Google Scholar]
- Kiyohara E, Hata K, Lam S, Hoon DS. Methods Mol Biol. 2014;102:513–522. doi: 10.1007/978-1-62703-727-3_27. [DOI] [PubMed] [Google Scholar]
- Kunter U, Buer J, Probst M, Duensing S, Dallmann I, Grosse J, Kirchner H, Schluepen EM, Volkenandt M, Ganser A, Atzpodien J. J Natl Cancer Inst. 1996;88 (9):590–594. doi: 10.1093/jnci/88.9.590. [DOI] [PubMed] [Google Scholar]
- Linos E, Swetter SM, Cockburn MG, Colditz GA, Clarke CA. J Invest Dermatol. 2009;129 (7):1666–1674. doi: 10.1038/jid.2008.423. [DOI] [PMC free article] [PubMed] [Google Scholar]
- Liu J, Qin Y, Li D, Wang T, Liu Y, Wang J, Wang E. Biosens Bioelectron. 2013;41:436–441. doi: 10.1016/j.bios.2012.09.002. [DOI] [PubMed] [Google Scholar]
- Liu Y, Jiang H. Electroanalysis. 2006;18 (10):1007–1013. [Google Scholar]
- Lyons MEG. Analyst. 1994;119 (5):805–826. [Google Scholar]
- Maddodi N, Huang W, Havighurst T, Kim K, Longley BJ, Setaluri V. J Invest Dermatol. 2010;130 (6):1657–1667. doi: 10.1038/jid.2010.26. [DOI] [PMC free article] [PubMed] [Google Scholar]
- Maheswaran S, Sequist LV, Nagrath S, Ulkus L, Brannigan B, Collura CV, Inserra E, Diederichs S, Iafrate AJ, Bell DW, Digumarthy S, Muzikansky A, Irimia D, Settleman J, Tompkins RG, Lynch TJ, Toner M, Haber DA. N Engl J Med. 2008;359 (4):366–377. doi: 10.1056/NEJMoa0800668. [DOI] [PMC free article] [PubMed] [Google Scholar]
- Moradi R, Sebt SA, Karimi-Maleh H, Sadeghi R, Karimi F, Bahari A, Arabi H. Phys Chem Chem Phys. 2013;15:5888–5897. doi: 10.1039/c3cp00033h. [DOI] [PubMed] [Google Scholar]
- Moscovici M, Bhimji A, Kelley SO. Lab Chip. 2013;13 (5):940–946. doi: 10.1039/c2lc41049d. [DOI] [PubMed] [Google Scholar]
- Nagrath S, Sequist LV, Maheswaran S, Bell DW, Irimia D, Ulkus L, Smith MR, Kwak EL, Digumarthy S, Muzikansky A, Ryan P, Balis UJ, Tompkins RG, Haber DA, Toner M. Nature. 2007;450 (7173):1235–1239. doi: 10.1038/nature06385. [DOI] [PMC free article] [PubMed] [Google Scholar]
- Paterlini-Brechot P, Benali NL. Cancer Lett. 2007;253 (2):180–204. doi: 10.1016/j.canlet.2006.12.014. [DOI] [PubMed] [Google Scholar]
- Rajesh S, Arivudainambi USE, Rajasingh S, Rajendran A, Kotamraju S, Karunakaran C. Sens Lett. 2010a;8 (4):613–621. [Google Scholar]
- Rajesh S, Kanugula AK, Bhargava K, Ilavazhagan G, Kotamraju S, Karunakaran C. Biosens Bioelectron. 2010b;26 (2):689–695. doi: 10.1016/j.bios.2010.06.063. [DOI] [PubMed] [Google Scholar]
- Raposinho PD, Correia JD, Oliveira MC, Santos I. Pept Sci. 2010;94 (6):820–829. doi: 10.1002/bip.21490. [DOI] [PubMed] [Google Scholar]
- Raveh M, Liu L, Mandler D. Phys Chem Chem Phys. 2013;15 (26):10876–10884. doi: 10.1039/c3cp50457c. [DOI] [PubMed] [Google Scholar]
- Razola SS, Ruiz BL, Diez NM, Mark HB, Kauffmann JM. Biosens Bioelectron. 2002;17 (11–12):921–928. doi: 10.1016/s0956-5663(02)00083-0. [DOI] [PubMed] [Google Scholar]
- Riethdorf S, Fritsche H, Muller V, Rau T, Schindlbeck C, Rack B, Janni W, Coith C, Beck K, Janicke F, Jackson S, Gornet T, Cristofanilli M, Pantel K. Clin Cancer Res. 2007;13 (3):920–928. doi: 10.1158/1078-0432.CCR-06-1695. [DOI] [PubMed] [Google Scholar]
- Rusling JF. Chem Rec. 2012;12 (1):164–176. doi: 10.1002/tcr.201100034. [DOI] [PMC free article] [PubMed] [Google Scholar]
- Salazar-Onfray F, Lopez M, Lundqvist A, Aguirre A, Escobar A, Serrano A, Korenblit C, Petersson M, Chhajlani V, Larsson O, Kiessling R. Br J Cancer. 2002;87 (4):414–422. doi: 10.1038/sj.bjc.6600441. [DOI] [PMC free article] [PubMed] [Google Scholar]
- Schittek B, Bodingbauer Y, Ellwanger U, Blaheta HJ, Garbe C. Br J Dermatol. 1999;141 (1):30–36. doi: 10.1046/j.1365-2133.1999.02917.x. [DOI] [PubMed] [Google Scholar]
- Schwahn DJ, Xu W, Herrin AB, Bales ES, Medrano EE. Pigment Cell Res. 2001;14 (1):32–39. doi: 10.1034/j.1600-0749.2001.140106.x. [DOI] [PubMed] [Google Scholar]
- Shivers SC, Wang X, Li W, Joseph E, Messina J, Glass LF, DeConti R, Cruse CW, Berman C, Fenske NA, Lyman GH, Reintgen DS. J Am Med Assoc. 1998;280 (16):1410–1415. doi: 10.1001/jama.280.16.1410. [DOI] [PubMed] [Google Scholar]
- Smith B, Selby P, Southgate J, Pittman K, Bradley C, Blair GE. Lancet. 1991;338 (8777):1227–1229. doi: 10.1016/0140-6736(91)92100-g. [DOI] [PubMed] [Google Scholar]
- Stott SL, Lee RJ, Nagrath S, Yu M, Miyamoto DT, Ulkus L, Inserra EJ, Ulman M, Springer S, Nakamura Z, Moore AL, Tsukrov DI, Kempner ME, Dahl DM, Wu CL, Iafrate AJ, Smith MR, Tompkins RG, Sequist LV, Toner M, Haber DA, Maheswaran S. Sci Transl Med. 2010;2(25):25ra23. doi: 10.1126/scitranslmed.3000403. [DOI] [PMC free article] [PubMed] [Google Scholar]
- Tsukamoto K, Ueda M, Hirata S, Osada A, Kitamura R, Takahashi T, Ichihashi M, Shimada S. J Dermatol Sci. 2000;23 (2):126–131. doi: 10.1016/s0923-1811(99)00098-5. [DOI] [PubMed] [Google Scholar]
- Wang Y, Li X, Cao W, Li Y, Li H, Du B, Wei Q. Biosens Bioelectron. 2014a;61:618–624. doi: 10.1016/j.bios.2014.05.059. [DOI] [PubMed] [Google Scholar]
- Wang X, Li H, Li X, Chen Y, Yin Y, Li G. Electrochem Commun. 2014b;39:12–14. [Google Scholar]
- Wang X, Qian X, Beitler JJ, Chen ZG, Khuri FR, Lewis MM, Shin HJC, Nie S, Shin DM. Cancer Res. 2011;71 (5):1526–1532. doi: 10.1158/0008-5472.CAN-10-3069. [DOI] [PMC free article] [PubMed] [Google Scholar]
- Weng J, Zhang Z, Sun L, Wang JA. Biosens Bioelectron. 2011;26 (5):1847–1852. doi: 10.1016/j.bios.2010.01.027. [DOI] [PubMed] [Google Scholar]
- Williams SCP. Proc Natl Acad Sci USA. 2013;110 (13):4861. doi: 10.1073/pnas.1304186110. [DOI] [PMC free article] [PubMed] [Google Scholar]
- Wilson MS. Anal Chem. 2005;77 (5):1496–1502. doi: 10.1021/ac0485278. [DOI] [PubMed] [Google Scholar]
- Wu Y, Chen C, Liu S. Anal Chem. 2009;81 (4):1600–1607. doi: 10.1021/ac802345z. [DOI] [PubMed] [Google Scholar]
- Wu Y, Xue P, Kang Y, Hui KM. Anal Chem. 2013;85 (6):3166–3173. doi: 10.1021/ac303398b. [DOI] [PubMed] [Google Scholar]
- Xia Y, Muceniece R, Wikberg JE. Cancer Lett. 1996;98 (2):157–162. [PubMed] [Google Scholar]
- Xu S, Liu J, Wang T, Li H, Miao Y, Liu Y, Wang J, Wang E. Talanta. 2013;104:122–127. doi: 10.1016/j.talanta.2012.11.040. [DOI] [PubMed] [Google Scholar]
- Yoon HJ, Kim TH, Zhang Z, Azizi E, Pham TM, Paoletti C, Lin J, Ramnath N, Wicha MS, Hayes DF, Simeone DM, Nagrath S. Nat Nanotechnol. 2013;8 (10):735–741. doi: 10.1038/nnano.2013.194. [DOI] [PMC free article] [PubMed] [Google Scholar]
- Zhao M, Schiro PG, Kuo JS, Koehler KM, Sabath DE, Popov V, Feng Q, Chiu DT. Anal Chem. 2013;85 (4):2465–2471. doi: 10.1021/ac400193b. [DOI] [PMC free article] [PubMed] [Google Scholar]
Associated Data
This section collects any data citations, data availability statements, or supplementary materials included in this article.


