Abstract
Exposure following pelvic organ prolapse repair has been observationally associated with wrinkling of the implanted mesh. The purpose of this study was to quantify the impact of variable boundary conditions on the out-of-plane deformations of mesh subjected to tensile loading. Using photogrammetry and surface curvature analyses, deformed geometries were accessed for two commercially available products. Relative to standard clamping methods, the amount of out-of-plane deformation significantly increased when point loads were introduced to simulate suture fixation in-vivo. These data support the hypothesis that regional increases in the concentration of mesh potentially enhance the host’s foreign body response, leading to exposure.
Keywords: Surface curvature, photogrammetry, boundary conditions, mesh, exposure, pelvic organ prolapse
1. Introduction
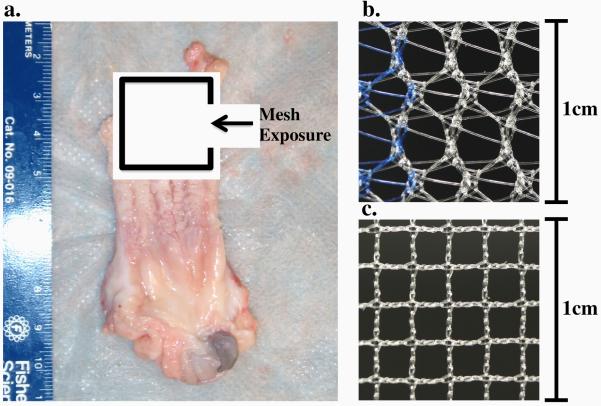
As of 2011, approximately one-third of all surgical repairs for pelvic organ prolapse were utilizing synthetic mesh products, yet up to 20% of those who undergo surgery with mesh require repeat operations for recurrent symptoms or complications (FDA, 2011; Bako et al., 2008). One of the most devastating and most common complications is mesh exposure (Diwadkar et al. 2009; Iglesia et al., 2010; Deffieux et al., 2007). Exposure is characterized by the degeneration of native vaginal tissue in contact with the mesh, often allowing visualization and palpation of the mesh in the vaginal lumen. Recent findings have shown that mesh exposure through the vaginal wall occurs in up to 15% of transvaginal repairs and 10.5% of sacrolcolpopexy repairs (Nygaard, 2012). In addition, surgeons have commonly noted this complication to correspond with the appearance of mesh “contraction”, “buckling”, “wrinkling”, and/or “bunching” in the area of exposure (Fig. 1a).
Fig. 1.
Evidence of mesh exposure through the anterior vaginal wall of a primate vagina upon explantation (a). The mesh appears folded, with a ridge in the center of the degenerated vaginal tissue. The distinct pore geometries of Gynemesh (b) and Restorelle (c) have been shown to elicit differing structural mechanical behavior, though both are comprised of type 1 polypropylene.
Though the mechanisms that lead to mesh exposure remain unclear, much focus has been drawn to the properties of the mesh products in an attempt to minimize complications (Shepherd et al., 2012; Feola et al., 2013a; Feola et al., 2013b). Often mesh manufacturers report on the structural properties of mesh, in addition to in-vivo histological data following implantation, in order to demonstrate the mechanical integrity of their products. Given that most prolapse meshes are constructed from the same material (type I polypropylene), the wide range of mechanical behavior observed in previous studies primarily arises from variations in knit pattern between products (Shepherd et al., 2012; Moalli et al., 2008; Jones et al., 2009). While load-elongation behavior is required to understand the functional behavior of mesh, several findings in the hernia mesh literature suggest that deformation of mesh upon loading is crucial for predicting the host response. In the abdominal wall, it was determined that mesh pores with diameters less than 1mm elicit an enhanced immune response, with poor mesh incorporation into the host tissue. Recent studies, including our own preliminary work, have found that application of tensile loads drastically reduces mesh porosity and yields pore dimensions which are unfavorable for host integration (Otto et al., 2013; Muhl et al., 2007). This intensified immune response is attributed to increases in mesh burden, where mesh burden is defined as the amount of mesh material per unit volume of tissue. While tensile loading clearly leads to pore collapse at some level of force, additional deformations, such as wrinkling and folding, may provide an alternative or concomitant mechanism to increase mesh burden.
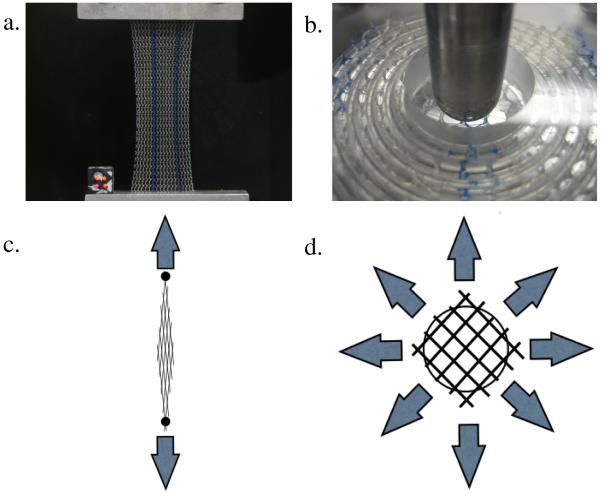
Boundary conditions greatly impact the mechanical behavior of mesh, as observed when comparing results from standard uniaxial tensile and ball burst tests (Shepherd et al., 2012; Feola et al., 2013a). In addition, the mesh deformations observed during these tests are quite dissimilar (Fig. 2). During uniaxial testing mesh is allowed to contract in the direction perpendicular to loading (similar to Poisson’s effect for continuum solids), while fixing the mesh along the entire boundary, per a standard ball burst protocol, prevents the collapse of pores. Although both testing methods assume a planar geometry (i.e. no buckling or wrinkling), the method in which mesh is fixed noticeably alters changes in mesh burden under mechanical loading.
Fig. 2.
Images from uniaxial tensile (a) and ball burst (b) testing of Gynemesh samples, illustrating the overall mesh deformation. During uniaxial testing, meshes experience lateral contraction in response to load, reducing pore size. During ball burst testing, the total mesh deformation is minimal, with little change in pore geometry. Schematics for uniaxial (c) and ball burst (d) tests show the directions of applied force (arrows) and the expected pore behavior.
Indeed many previous studies have employed standard testing protocols to access the properties of mesh, yet these standards do not employ boundary conditions that mimic the in-vivo boundary conditions a mesh product experiences. As such, important features of mesh mechanical behavior may have been overlooked. Specifically, when a surgeon places a mesh to restore vaginal support, sutures are used to attach the material to the vagina as well as the anchoring surfaces. This method of attachment subjects the mesh to various point loads, as opposed to the uniform application of load or displacement to an entire boundary. Further, the number of point loads and their positions are variable, as surgeons do not necessarily use the same number of sutures or exactly the same suture placements from patient to patient (anatomical variations, patient size, etc). Without constraining an entire edge, point loading of mesh is more likely to create out-of-plane deformations, resulting in a bending or wrinkling phenomenon along the lines through which force is transmitted, due to the constraint effects of pore deformation. Describing surface deformations, such as bending, has been well characterized in several fields of research, including neurological development (Filas et al., 2008; Batchelor et al., 2002) and cardiology (Lee et al., 2013; Sacks et al., 2002; Smith et al., 2000). Following from these studies, out-of-plane surface deformations for a thin body can be characterized via surface curvature, as the geometric transformation of a flat surface to a curved one implies some local surface deformation.
Understanding the surface deformation of mesh products will provide valuable insight into the local deformation and mesh burden throughout a mesh device, which may greatly impact the manner in which the surrounding tissues interact and integrate with mesh. Therefore the aim of this study was two-fold: 1) develop an experimental and theoretical approach by which the surface curvature of polypropylene mesh could be quantified and compared and 2) use this approach to examine the impact of variable boundary conditions on the surface curvature polypropylene mesh products used in repair of pelvic organ prolapse. We hypothesize that boundary conditions more representative of in-vivo loading will result in significantly greater surface curvature compared to those deformations resulting from traditional tensile testing.
2. Materials and methods
2.1 Experimental testing
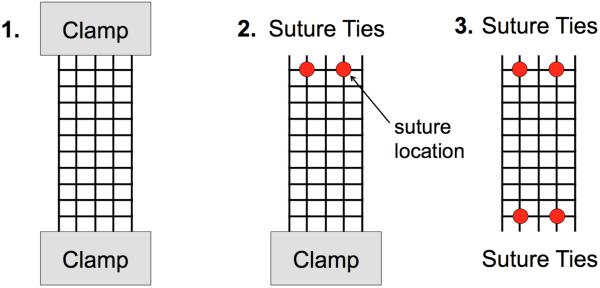
For mechanical loading, Gynemesh and Restorelle samples were removed from sterile packaging and cut to 15 × 5 cm strips along the recommended implantation direction (n = 5 each). These products were chosen based on their widespread use in clinical practice and to examine the impact of boundary conditions on devices of differing pore geometries (Fig 1b,c). All samples were subjected to 3 uniaxial tensile tests (n=5 per test per mesh) with boundary conditions (BCs) varied as follows: 1) the entire top and bottom edges of the mesh were fixed in custom tissue clamps 2) the entire bottom edge was fixed and the top edge was sutured to a custom plate using 2 interrupted suture ties 3) both the top and bottom edges were sutured to custom plates using 2 interrupted suture ties on each edge (Fig. 3). For this study, all sutures were centered about the width of the mesh and placed 1.5 cm apart. A grid pattern was cut into the custom plates such that suture ties could be consistently tied at specific distances. During each trial the bottom clamp/plate was fixed to the base of a materials testing machine (Instron 5565, Grove City, PA), while the top clamp/plate was attached to the machine crosshead, inline with a 5kN (0.1N resolution) load cell. For each trial, samples were preloaded to 1N at 10 mm/min and subsequently loaded to 10N at 50 mm/min. While 10N of force is greater than the resting loads previously reported for pelvic floor tissues (Ozog et al., 2014), this load limit is estimated to be within the range of physiologic loading (coughing, valsalva, etc), based on vaginal geometries and intra-abdominal pressures (Cobb et al., 2005; Noakes et al., 2008). The suture distances and mesh dimensions used in this study were based on those that may be applied during an abdominal sacrolcolpopexy procedure.
Fig. 3.
Experimental boundary conditions (BCs) tested in this study. Each mesh sample was loaded to 1 and 10N of force at each of the 3 BCs shown above. Clamps were used to constrain an entire boundary or 2 interrupted suture ties were used to secure the mesh to custom clamps at the top and/or bottom boundaries.
2.2 Surface curvature
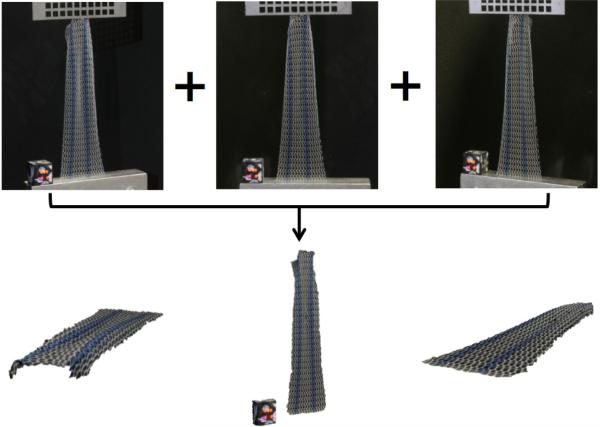
In order to compute surface curvature, full scale, close-range photogrammetry was utilized to capture the 3D (3-dimensional) mesh geometry. Photogrammetry is a reconstruction technique which combines a set of images into a three dimensional surface model by identifying and matching points in each image. This approach was chosen as more traditional methods of quantifying 3D deformations (painting the surface to create a speckle pattern, affixing surface markers, etc.) were found to alter the manner in which the meshes would deform. At each load (1N and 10N) and boundary condition, ten photographs of the mesh-clamp/plate complex were taken. These images were consistently taken from 5 angles at 2 differing heights for each trial with a registration block included in all images. All ten images were then imported into Photoscan Pro (Agisoft, St. Petersburg, Russia) for 3D reconstruction (Fig 4). The registration block was used to scale and orient the model in a global coordinate system.
Fig. 4.
A series of ten images from various angles and heights were used to reconstruct 3D models of the mesh surface during tensile loading. The top images are actual raw images of the mesh and registration block under BC 2, while the bottom geometries are differing views of the reconstructed and scaled surface model generated in Photoscan Pro.
Surface models were then exported to Meshlab (Visual Computing Lab, ISTI-CNR, Pisa, Italy) and 10 points along the boundary of the mesh surface were manually selected to serve as nodes for finite element analysis (Fig 5). The nodal coordinates and 3D coordinates representing the mesh surface were then exported into a custom Mathematica script (V9, Champaign, IL), mapped to a four element patch of 4-node biquintic finite elements (BQFEs) and parameterized in local element coordinates (ξ,η), where the values of ξ and η range from −1 to 1 (Fig 5). The 2D (2-dimensional) interpolation functions for the BQFEs are derived from the 1D (1-dimensional) quintic hermite element and provide C2 continuity (Smith et al., 2000). In addition, each node of the BQFE has 6 nodal values representing the z-coordinate and the first, second, and cross derivatives with respect to the local coordinate system. Nodal values for the 4-element patch were fit simultaneously using a least squares method, where a scalar penalty function was used to enforce C2 continuity across the element boundaries. The z-coordinates for each element are obtained by summing the 24 products of:
| (1) |
Where i is the node number, j and k are the order of the derivative with respect to the local coordinates, and Z is the Cartesian z-coordinate that was fit. Summation convention is implied in Eq. 1 (Smith et al., 2000). The large point sampling obtained via 3D reconstruction ( >1000 points per element) eliminated the need for error functions used previously for this technique.
Fig. 5.
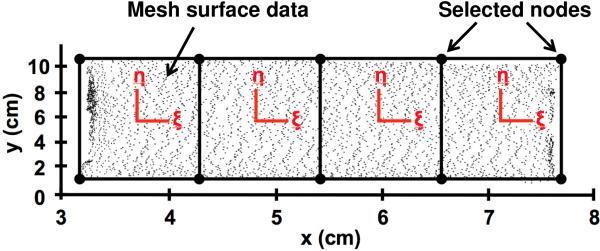
Data points representing the 3D mesh surface was mapped to the local coordinates systems (ξ,η) of a 4-element patch of biquintic finite elements (BQFEs). 10 points on the mesh surface were manually selected to serve as nodes for finite element discretization. A scalar penalty function was used to enforce inter element continuity.
In order to transform values from between the in-surface coordinates and Cartesian coordinates, an appropriate covariant curvilinear basis was created such that:
| (2) |
Further the contravariant curvilinear basis is given by:
| (3) |
Where the scaling factor, √g, is given by:
| (4) |
Details on curvilinear coordinates and coordinate transformations are outlined in texts by Taber and others (Taber et al., 2004; Amini et al., 2013). In order to characterize the coordinate system in space, the surface metric, or first fundamental form of a surface, is required (Taber et al., 2004; Goktepe et al., 2009). The surface metric, gij, is defined as:
| (5) |
Local curvature calculation requires the curvature tensor, also known as the second fundamental form of a surface. The curvature tensor, Bij, is given by (Goktepe et al., 2009):
| (6) |
From the curvature tensor, the principal curvature values and directions of principal curvature are obtained from the characteristic equation, where the principal values are given by (Goktepe et al., 2009):
| (7) |
The scalar values IB and IIB are the first and second principal invariants of Bij and are defined as:
| (8) |
In order to effectively demonstrate the change in surface curvature during loading, the maximum value of principal curvature was chosen. These curvatures are representative of the out-of-plane peaks and valleys, which arise during the wrinkling phenomenon. Max curvature for this study is defined such that:
| (9) |
All surface fitting and curvature calculations were performed using Mathematica, while 3D surfaces were reconstructed in Matlab R2012a (Mathworks, Natick, MA) using Delaunay triangulation and a custom script to eliminate distorted elements, rendering a smoothed geometry that was representative of the original reconstructed model. Computed curvature values from Mathematica where then projected onto the approximated surface.
In order to characterize the entire mesh surface and make comparisons between boundary conditions and mesh type, the average of the absolute value of the maximum principal curvature, Mean (|kmax|), was used. Mean (|kmax|) provides a measure of the magnitude of curvature over the entire surface with a value of 0 representing a flat surface. In addition, the variance of kmax (Var(kmax)) was computed and provides a measure of the undulation or wrinkling present across a surface. Higher variance values indicate surfaces with higher peaks and lower valleys. In contrast, variance values closer to 0 represent a flat surface or one in which curvature does not change rapidly (e.g. shallow parabolic shapes). A Friedman's test was used to compare the Mean(|kmax |) and Var(kmax) values between the applied boundary conditions at 1 and 10N of applied load. A Kruskal-Wallis with Mann-Whitney post-hoc was used to compare meshes at the same load and boundary condition. Statistical analysis was performed in SPSS (V20, IBM, Armonk, NY) with a significance value set at p = 0.05.
2.3 Validation
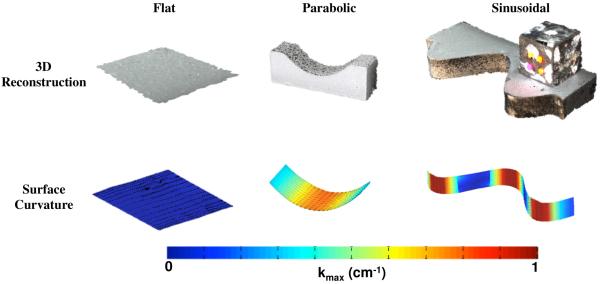
In order to examine the accuracy of the surface interpolation, validation of the computational methods was performed using known functions with C2 continuity. Both parabolic (y=x2) and sinusoidal (y=0.5sin(3x)) functions were considered, as these geometric patterns were observed in mesh trials. Three-dimensional datasets were generated with each of these functions by extruding in the z direction, though unlike surface data obtained via photogrammetry, the generated data was equally distributed along the surface. The ideal, generated datasets then underwent the same nodal selection protocol and surface analysis as photogrammetry datasets.
Additional validation assessed the total error of the overall approach, combining error from both the photogrammetry and surfaced interpolation techniques. To accomplish this, the same parabolic and sinusoidal functions were used to design and fabricate acrylic models. Each of the two physical models were imaged and reconstructed using the photogrammetry methods described above, and the surface curvature was determined (Fig. 6). In addition, a flat surface was fabricated, imaged, and analyzed, as this surface should have a curvature of 0 (Fig. 6).
Fig. 6.
Validation of the experimental methods with various surfaces of known curvature. The top row depicts the reconstructed surface models exported from Photoscan Pro for flat, parabolic, and sinusoidal geometries. The bottom row displays the computed |kmax| for each surface. Regions of low curvature (flat) are represented by cool colors, while the warm colors signify surfaces of high curvature. kmax values are in units of cm−1.
3. Results
3.1 Mesh surface curvature
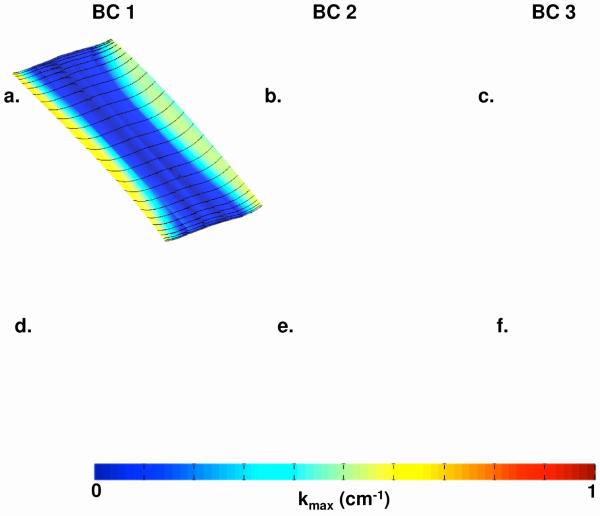
Upon the application of load, each mesh exhibited noticeably different behavior among the 3 boundary conditions. The traditional soft tissue clamps (BC 1) allowed little out of plane deformation for both Gynemesh and Restorelle. At 10N, it was noted that the lateral edges of both Gynemesh and Restorelle deformed out-of-plane, creating a shallow parabolic geometry along the axis parallel to the crosshead. The resulting curvatures match well with those deformations experienced for BC 1. Examination of Figure 7 (a,d) shows the curvature to be nearly 0 cm−1 for the entire mesh surface at 1N and similarly in the middle of the mesh at 10N (Figure 8a,d). At 10N, both Gynemesh and Restorelle have increased kmax values near the lateral edges.
Fig. 7.
Contour map of |kmax| for representative Gynemesh (a,b,c) and Restorelle (d,e,f) samples at 1N. Boundary conditions (BCs) 1,2, and 3 are represented by (a,d), (b,e), and (c,f) respectively. Solid black lines represent the direction of kmax.
Fig. 8.
Contour map of |kmax| for representative Gynemesh (a,b,c) and Restorelle (d,e,f) samples at 10N. Boundary conditions (BCs) 1,2, and 3 are represented by (a,d), (b,e), and (c,f) respectively. Solid black lines represent the direction of kmax. Please note that a scale from 0 to 1 cm−1 was used in order to visualize non-homogeneities in curvature distribution. Actual maximum curvatures observed in BC 3 (c,f) skew this scaling, making it difficult to distinguish locations of peak curvature on all samples.
Mesh deformations for BC 2 were markedly different from those seen for BC 1. BC 2 produced significant buckling in all meshes, with peaks originating from the suture locations. Again, the contour maps for |kmax| are in agreement with the grossly observed deformations (Fig. 7 and 8, b and e). At 1N, Gynemesh samples seemed to develop small kmax values at the sutures, while Restorelle remained in a nearly flat configuration. When loaded to 10N of force, both meshes exhibited large out-of-plane deformations, typically with 2 peaks stemming from the sutures and a valley forming between the suture points. In addition, the buckling behavior produced lateral contraction of the mesh, which was more pronounced at the edge fixed with sutures. Little to no contraction was seen at the boundary with the standard tissue clamps.
Loading with BC 3 produced the most dramatic mesh deformation with large undulations in the mesh surface and greater lateral contraction along the entire length of the mesh (Fig. 7 and 8, c and f). Analysis of these surfaces at 1N confirmed the increase in kmax running vertically along a line between the suture locations for Gynemesh. Unlike Gynemesh, Restorelle remained relatively flat at 1N, though large folds (nearly 90 degrees) were commonly observed just lateral to the suture location. These folds generated large curvatures, though the fold typically did not extend along the length of the mesh, nor medially past the suture location. At 10N, both mesh products experienced a large amount of wrinkling along the entire mesh, leading to large kmax values across the entire surface. In addition, both meshes had a great deal of lateral contraction along the entire mesh length (Fig 8, c and f).
When characterizing the entire surface via Mean (|kmax|) and Var (kmax), the BCs used in this study were found to significantly impact both Gynemesh and Restorelle (Table 1). In terms of the data collected at 1N, Mean (|kmax|) values for Gynemesh increased with median values of 0.0608, 0.162 and 0.406 cm−1 for BC 1, BC 2, and BC 3, respectively. Similar changes were also seen for Restorelle, though Restorelle had a significantly lower Mean (|kmax|) for BC 3 compared to Gynemesh (p = 0.009). The variance of kmax was also found to increase from BC 1 to BC 3. Median values of Var(kmax) increased at least an order of magnitude for both Gynemesh and Restorelle (Table 2). However, no differences were observed between the meshes in terms of this parameter at 1N.
Table 1.
Averaged |kmax| values from the entire mesh surface. Results for Gynemesh (n=5) and Restorelle (n=5) samples are shown for both 1 and 10N under boundary conditions (BCs) 1, 2, and 3. Reported p-values are from a Friedman’s test, which tested the impact of BCs on Mean(|kmax|).
| Mean (|kmax|) (cm−1) | |||||
|---|---|---|---|---|---|
| Mesh | Load (N) |
BC 1 | BC 2 | BC 3 | p |
| Gynemesh | 1 | 0.0608 (0.0557 - 0.0968) |
0.162 (0.126 - 0.230) |
0.406*
(0.320 - 0.453) |
0.007 |
| 10 | 0.178*
(0.153 - 0.219) |
0.719 (0.468 - 0.732) |
1.834*
(1.438 - 1.945) |
0.007 | |
| Restorelle | 1 | 0.068 (0.0655 - 0.0703) |
0.176 (0.174 - 0.181) |
0.233*
(0.230 - 0.252) |
0.015 |
| 10 | 0.0698*
(0.0694 - 0.0774) |
0.476 (0.397 - 0.487) |
1.170*
(1.130 - 1.222) |
0.007 | |
indicates differences between Gynemesh and Restorelle at the same load and BC (p < 0.05). Values are represented as Median (25th quartile - 75th quartile).
Table 2.
Variance of kmax over the entire mesh surface. Results for Gynemesh (n=5) and Restorelle (n=5) samples are shown for both 1 and 10N under boundary conditions (BCs) 1, 2, and 3. Reported p-values are from a Friedman’s test, which tested the impact of BCs on Var(kmax).
| Var(kmax) (cm−1) | |||||
|---|---|---|---|---|---|
| Mesh | Load (N) |
BC 1 | BC 2 | BC 3 | p |
| Gynemesh | 1 | 0.006 (0.0034 - 0.0169) |
0.0279 (0.0236 - 0.084) |
0.148 (0.124 - 0.240) |
0.041 |
| 10 | 0.05*
(0.0438 - 0.0534) |
0.4721 (0.2341 - 0.7265) |
5.714*
(3.386 - 6.341) |
0.007 | |
| Restorelle | 1 | 0.006 (0.0045 - 0.0077) |
0.047 (0.0422 - 0.0705) |
0.0851 (0.0707 - 0.127) |
0.015 |
| 10 | 0.0139*
(0.0119 - 0.0143) |
0.458 (0.248 - 0.537) |
1.855*
(1.774 - 2.787) |
0.007 | |
indicates differences between Gynemesh and Restorelle at the same load and BC (p < 0.05). Values are represented as Median (25th quartile - 75th quartile)
Changes in surface curvature and the surface undulation became more pronounced when meshes were loaded to 10N of force, as surfaces laterally contracted and became highly curved. In addition, differences between the meshes became more apparent at 10N. For BC 1, Mean(|kmax|) values for Gynemesh and Restorelle were 0.178 and 0.0698 cm−1 (p = 0.016), while Var(kmax) values were 0.05 and 0.0139 cm−1 (p = 0.016), respectively. Despite the differences for BC 1, Gynemesh and Restorelle deformed similarly for BC 2 (p > 0.05), though values were dramatically increased relative to BC 1 for each mesh. BC 3 resulted in a highly curved, wrinkled surface for all meshes tested, with Mean(|kmax|) values of 1.834 and 1.170 cm−1 for Gynemesh and Restorelle, respectively. In addition, the increase in the variance values was striking, with values of 5.714 and 1.855 cm−1 for Gynemesh and Restorelle. For BC 3, Gynemesh was found to have significantly greater Mean(|kmax|) and Var(kmax) values relative to Restorelle (p = 0.009 and 0.016, respectively).
3.2 Validation
Surface interpolation with the 4-element patch of BQFEs fit the surface points of generated data extremely well, as the greatest percent error in prediction of z-coordinates was << 0.1%. This method was able to accurately predict the curvature of the parabolic function, yet errors for the sinusoidal surface were as large as 8% typically occurring in locations of peak curvature, though the overall shape of the predicted curvature plot was similar to the theoretical plot (Fig. 9).
Fig. 9.
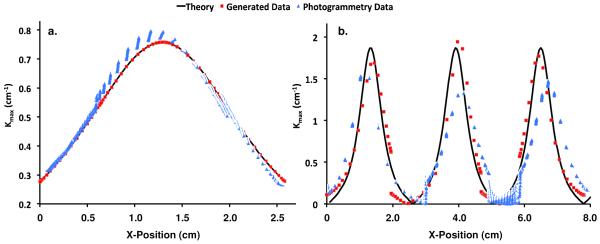
Validation results from surfaces of known curvature. The solid black line represents the theoretical curvature for the test parabolic surface (a) and the test sinusoidal surface (b). The red square markers represent the predicted |kmax| values along the x-axis using generated surface data, while the blue triangles represent the predicted |kmax| values using data from photogrammetric reconstructions.
In general, photogrammetry generated excellent surface models, with a remarkable level of textural detail (Fig. 6). Upon closer inspection, most surfaces contained small surface fluctuations due to the point-matching algorithm used in Photoscan Pro. The impact of this technique was measured using the manufactured surfaces of known curvature. Again, surface interpolation proved accurate in predicting the z-coordinates (RMS Error < 0.003). Analysis of the flat surface revealed first principal curvatures on the order of 0.05 cm−1 while second principal curvatures had a peak value of 0.019 cm−1. Data from the reconstructed parabolic surface also showed agreement with the theoretical |kmax| values, with peak errors of ~4% (Fig. 9). The predicted data resulting from the reconstructed sinusoid was not as accurate, with peak errors of approximately 25%. Still, the predicted curvature values capture the overall shape of the theoretical curvature plot, though peak values were consistently underestimated.
In general, this validation demonstrates that the methods used in this study accurately measure curvature of flat and parabolic surfaces, while providing conservative measures for peak curvature on sinusoidal geometries. Given that each of these validation geometries were observed in mesh trials, we consider this method for determining surface curvature provide a relatively conservative comparison between surfaces, as exact curvatures for undulated shapes would result in larger differences than reported in the present study.
4. Discussion
In this study, a method for quantifying and comparing the out-of-plane deformation of thin textiles was established. This method provides reasonable accuracy and effectively describes the out-of-plane deformations experienced by synthetic meshes used for prolapse repair in response to loading. In addition, this study has shown that the manner in which mesh is fixed at its boundaries greatly impacts the magnitude of out-of-plane deformations it experiences in response to loading. Specifically, fixation of the entire mesh boundaries using clamps, as is traditionally done when evaluating the response of meshes to uniaxial tension, results in a relatively flat surface. Inclusion of discrete point loads (suture locations) significantly increases the amount of buckling/wrinkling deformation for these products. Both Gynemesh and Restorelle experienced similar differences between the boundary conditions tested in this study; however at 10N of force, Gynemesh surfaces were found to have greater magnitudes of curvature and surface undulation.
Although BC 1 provides the ideal conditions for materials testing, the boundaries resulting from surgical implantation of mesh are typically more similar to those utilized in BCs 2 and 3. The inclusion of point loads, which arise when anchoring mesh via sutures, drastically increases the curvature of the mesh, creating regions of increased mesh density. Based on previous findings regarding minimum pore size (Otto et al., 2013; Muhl et al., 2007), we would expect a more robust inflammatory response with little tissue integration due to the increased mesh burden resulting from both pore collapse and mesh buckling at locations of increased curvature, though future studies relating curvature and histological outcomes are needed to confirm this hypothesis. Further, the non-homogenous distribution of curvature, which may serve as a proxy for mesh burden, may explain the discrete nature of pain and exposure which is seen clinically (Feiner et al., 2010).
While both mesh products experience large increases in curvature under point loading, differences between Gynemesh and Restorelle were observed at 10N of force. It is likely that pore geometry is responsible for these observed differences. Indeed, the square patterning of Restorelle may more effectively resist buckling under a specific condition (those similar to BC 1 with force applied parallel to the fiber direction), but discrete point loads still greatly destabilizes planar deformation for this mesh. Given such differences, meshes of differing pore structures may require unique suturing techniques (varying in number and position of sutures) that are optimized to prevent unwanted deformation.
In terms of clinical implications, it should be noted that this study provides a time zero perspective of the deformation of mesh products and thus the impact of tissue integration or biological factors are neglected. However, the results from this study demonstrate, that the method of mesh fixation, in addition to the amount of tension a mesh experiences, may directly impact the host response. In a recent study examining complications in transvaginal mesh patients, Feiner et al. illustrated contour maps of patient pain locations (Feiner et al., 2010). These locations are typically associated with palpable ridges, which are found along a horizontal line between each set of bilateral fixation arms. It is along these lines that one would expect force to be transmitted between fixation points, assuming tensile loading of the fixation arms. This would create increases in curvature, similar to those as observed in the current study.
Moreover these results are directly applicable to both abdominal sacrolcolpopexy and transvaginal procedures. When tensioning a mesh to restore vaginal support, surgeons must consider both the amount of force placed on the mesh and the locations of suture attachment. For instance, larger forces used to “tension” the mesh and restore the position of the vagina may yield significant pore collapse (similar to Poisson’s effect), while isolated suture locations, particularly at the boundary of a mesh, may lead to mesh wrinkling upon physiological loading. Considering these factors would help to eliminate sources of mesh bunching that have previously been reported upon implantation (Svabík et al., 2010). As previously mentioned, surgical techniques and product designs that incorporate fixation points or geometries to reduce surface curvature and maintain of pore size upon loading, may greatly reducing the likelihood of complications.
To our knowledge this is the first study in which curvature calculations were determined via photogrammetry reconstruction. Therefore it was necessary to report the accuracy associated with this approach. Photogrammetry is a widely used and incredibly powerful technique, though the point-matching inaccuracies in concert with the limited ability of quintic functions for highly undulated surfaces introduced noticeable errors in curvature calculations. Future analysis may require surface smoothing techniques to minimize error arising from the calculation of derivatives as performed here (Amini et al., 2012). Further, we will examine the use of additional methods of surface interpolation to address the underestimation of curvature for highly oscillatory surfaces. For example, subdivision surfaces may more accurately predict surface curvature and can be directly integrated into large-scale finite element simulations.
Future studies will further examine the impact of boundary conditions on mesh deformation both experimentally and computationally. These studies will consider more complex device geometries, such as those used in transvaginal mesh procedures, and examine the impact of suture fixation to tissue substrates (such as the vagina) on mesh deformation. Finally using an approach similar to that described here, we will examine the curvature of mesh products in-vivo in order to compare the host response in locations of high curvature with that found in flat regions. These studies will help to identify whether there is indeed a causative relationship between mesh wrinkling observed clinically and corresponding regions of mesh exposure.
Acknowledgements
The authors greatly appreciate the financial support of the National Science Foundations Graduate Research Fellowship award DGE-0753293 and NIH grants R01 HD-045590 and K12HD-043441. In addition, Ms. Deanna Easley is acknowledged for her contribution to optimizing the environmental conditions for the photogrammetry technique used in this study.
Nomenclature
- Z
Cartesian coordinate which was fit
Shape functions
- (ξ, η)
Local coordinate system for finite elements
- gi, gi
Covariant and contravariant basis (in-surface curvilinear coordinate system)
- gij
Surface metric (metric tensor)
- Bij
Curvature tensor
- k1, k2
1st and 2nd principal curvatures (eigenvalues of the curvature tensor)
- IB, IIB
1st and 2nd principal invariants of the curvature tensor (Bij)
- kmax
Maximum curvature, defined here as the maximum of the absolute values of the principal curvatures
Footnotes
Publisher's Disclaimer: This is a PDF file of an unedited manuscript that has been accepted for publication. As a service to our customers we are providing this early version of the manuscript. The manuscript will undergo copyediting, typesetting, and review of the resulting proof before it is published in its final citable form. Please note that during the production process errors may be discovered which could affect the content, and all legal disclaimers that apply to the journal pertain.
References
- Amini R, Eckert CE, Koomalsingh K, McGarvey J, Minakawa M, Gorman JH, et al. On the in vivo Deformation of the Mitral Valve Anterior Leaflet: Effects of Annular Geometry and Referntial Configuration. Annals of Biomedical Engineering. 2012;40(7):1455–67. doi: 10.1007/s10439-012-0524-5. [DOI] [PMC free article] [PubMed] [Google Scholar]
- Amini R, Voycheck CA, Debski RE. A Method for Predicting Collagen Fiber Realignment in Non-planar Tissue Surfaces as Applied to Glenohumeral Capsule during Clinically Relevant Deformation. Journal of Biomechanical Engineering. 2013 doi: 10.1115/1.4026105. [DOI] [PMC free article] [PubMed] [Google Scholar]
- Bako A, Dhar R. Review of Synthetic Mesh-Related Complication in Pelvic Floor REconstructive Surgery. Int Urogynecol J. 2008;(20):103–11. doi: 10.1007/s00192-008-0717-5. Epub 9/9/2008. [DOI] [PubMed] [Google Scholar]
- Batchelor Ph.G., Castellano Smith A.D., Hill DLG, Hawkes DJ, Cox TCS, Dean AF. Measures of Folding Applied to the Development of the Human Fetal Brain. IEEE Transactions on Medical Imaging. 2002;21(8):953–65. doi: 10.1109/TMI.2002.803108. [DOI] [PubMed] [Google Scholar]
- Cobb WS, Burns JM, Kercher KW, Matthews BD, Norton HJ, Heniford BT. Normal intraabddominal pressure in healthy adults. Journal of Surgical Research. 2005;129:231. doi: 10.1016/j.jss.2005.06.015. [DOI] [PubMed] [Google Scholar]
- Deffieux X, de Tayrac R, Huel C, Bottero J, Gervaise A, Bonnet K, et al. Vaginal mesh erosion after transvaginal repair of cystocele using Gynemesh or Gynemesh-Soft in 138 women: a comparative study. Int Urogynecol J Pelvic Floor Dysfunct. 2007;18(1):73–9. doi: 10.1007/s0192-005-0041-2. [DOI] [PubMed] [Google Scholar]
- Diwadkar GB, Barber MD, Feiner B, Maher C, Jelovsek JE. Complication and reoperation rates after apical vaginal prolapse surgical repair: A systematic review. Obstetrics and Gynecology. 2009;113:367–73. doi: 10.1097/AOG.0b013e318195888d. 2 Part 1. [DOI] [PubMed] [Google Scholar]
- FDA . Surgical Placement of Mesh to Repair Pelvic Organ Prolapse Poses Risks. FDA; 2011. [Google Scholar]
- Feiner B, Maher C. Vaginal mesh contraction: Definition, clinical presentation, and management. Obstetrics and Gynecology. 2010;115:325–30. doi: 10.1097/AOG.0b013e3181cbca4d. 2 Part 1. [DOI] [PubMed] [Google Scholar]
- Feola A, Barone W, Moalli P, Abramowitch S. Characterizing the ex vivo textile and structural properties of synthetic prolapse mesh products. International Urogynecology Journal and Pelvic Floor Dysfunction. 2013a;24(4):559–64. doi: 10.1007/s00192-012-1901-1. [DOI] [PMC free article] [PubMed] [Google Scholar]
- Feola A, Abramowitch S, Jallah Z, Stein S, Barone W, Palcsey S, Moalli P. Deterioration in biomechanical properties of the vagina following implantation of a high-stiffness prolapse mesh. BJOG: An International Journal of Obstetrics and Gynaecology. 2013b;120(2):224–32. doi: 10.1111/1471-0528.12077. [DOI] [PMC free article] [PubMed] [Google Scholar]
- Filas BA, Knutsen AK, Bayly PV, Taber LA. A new method for measuring deformation of folding surfaces during morphogenesis. Journal of Biomechanical Engineering. 2008;130(6):061010-1–-9. doi: 10.1115/1.2979866. [DOI] [PMC free article] [PubMed] [Google Scholar]
- Goktepe S, Bothe W, Kvitting JPE, Swanson JC, Ingels NB, Miller DC, Kuhl E. Anterior Mitral Leaflet Curvature in the Beating Ovine Heart: A Case Study Using Videofluoroscopic Markers and Subdivision Surfaces. Biomech Model Mechanobiol. 2009;(9):281–93. doi: 10.1007/s10237-009-0176-z. Epub 13 October 2009. [DOI] [PubMed] [Google Scholar]
- Iglesia CB, Sokol AI, Sokol ER, Kudish BI, Gutman RE, Peterson JL, Shott S. Vaginal mesh for prolapse: A randomized controlled trial. Obstetrics and Gynecology. 2010;116:293–303. doi: 10.1097/AOG.0b013e3181e7d7f8. 2 Part 1. [DOI] [PubMed] [Google Scholar]
- Jones KA, Feola A, Meyn L, Abramowitch SD, Moalli PA. Tensile properties of commonly used prolapse meshes. International Urogynecology Journal and Pelvic Floor Dysfunction. 2009;20(7):847–53. doi: 10.1007/s00192-008-0781-x. [DOI] [PMC free article] [PubMed] [Google Scholar]
- Lee K, Zhu J, Shum JY, Zhang Muluk S.C., Chandra A, Eskandari MK, Finol EA. Surface curvature as a classifier of abdominal aortic aneurysms: A comparative analysis. Annals of Biomedical Engineering. 2013;41(3):562–76. doi: 10.1007/s10439-012-0691-4. [DOI] [PMC free article] [PubMed] [Google Scholar]
- Moalli PA, Papas N, Menefee S, Albo M, Meyn L, Abramowitch SD. Tensile properties of five commonly used mid-urethral slings relative to the TVT. International Urogynecology Journal and Pelvic Floor Dysfunction. 2008;19(5):655–63. doi: 10.1007/s00192-007-0499-1. [DOI] [PubMed] [Google Scholar]
- Muhl T, Binnebosel M, Klinge U, Goedderz T. New Objective Measurement to Characterize the Porosity of Textile Implants. Journal of Biomedical Materials Research - Part B: Applied Biomaterials. 2007:176–83. doi: 10.1002/jbm.b.30859. [DOI] [PubMed] [Google Scholar]
- Noakes NF, Pullan AJ, Bissett IP, Cheng LK. Subject specific finite elasticity simulations of the pelvic floor. Journal of Biomechanic. 2008;41:3060–5. doi: 10.1016/j.jbiomech.2008.06.037. [DOI] [PMC free article] [PubMed] [Google Scholar]
- Nygaard I, editor. A 7-year Follow Up Study of Abdominal Sacrocolpopexy with and without BURCH Uretrhopexy: the Extended Colpopexy and Urinary Reduction Efforsts Study. 33rd Annual American Urogynecologic Society Meeting; Chicago, IL. Oct 3-6, 2012. [Google Scholar]
- Otto J, Kaldenhoff E, Kirschner-Harmanns R, Muhl T, Klinge U. Elongatinon of Textile Pelvic Floor Implants Under Load is Related to Complete Loss of Effective Porosity, Thereby Favoring Incorporation in Scar Plates. Journal of Biomedical Materials Research - Part A. 2013 doi: 10.1002/jbm.a.34767. [DOI] [PubMed] [Google Scholar]
- Ozog Y, Deprest J, Haest K, Claus F, De Ridder D, Mazza E. Calculation of membrane tension in selected sections of the pelvic floor. International Urogynecology Journal and Pelvic Floor Dysfunction. 2014;25:499–506. doi: 10.1007/s00192-013-2253-1. [DOI] [PubMed] [Google Scholar]
- Sacks MS, He Z, Baijens L, Wanant S, Shah P, Sugimoto H, Yoganathan AP. Surface Strains in the Anterior Leaflet of the Functioning Mitral Valve. Annals of Biomedical Engineering. 2002;30(10):1281–90. doi: 10.1114/1.1529194. [DOI] [PubMed] [Google Scholar]
- Shepherd JP, Feola AJ, Abramowitch SD, Moalli PA. Uniaxial biomechanical properties of seven different vaginally implanted meshes for pelvic organ prolapse. International Urogynecology Journal and Pelvic Floor Dysfunction. 2012;23(5):613–20. doi: 10.1007/s00192-011-1616-8. [DOI] [PMC free article] [PubMed] [Google Scholar]
- Smith DB, Sacks MS, Vorp DA, Thorton M. Surface Geometric Analysis of Anatomic Structures Using Finite Element Interpolation. Annals of Biomedical Engineering. 2000;28:598–611. doi: 10.1114/1.1306342. Epub 22 May 2000. [DOI] [PubMed] [Google Scholar]
- Svabík K, Martan A, Masata J, El-Haddad R, Hubka P, Pavlikova M. Ultrasound appearances after mesh implantation - Evidence of mesh contraction or folding? International Urogynecology Journal and Pelvic Floor Dysfunction. 2010;22(5):529–33. doi: 10.1007/s00192-010-1308-9. [DOI] [PubMed] [Google Scholar]
- Taber LA. Nonlinear Thoery of Elascticity: Application in Biomechanics. World Scientific Publishing Co. Pte. Ltd.; 5 Toh Tuck Link Singapore: 2004. p. 399. [Google Scholar]


