

Abstract
This study examined whether differences in the perceived neighborhood and school environments account for differences in drinking behavior among Native American and White youths. Findings indicate that being Native American was indirectly related to drinking through perceived school and community variables. Higher drinking rates among Native Americans appear to be accounted for by lower school involvement, weaker neighborhood anti-drug norms, greater neighborhood disorganization and lower levels of perceived police enforcement. Results of this study highlight the potential importance of perceived school and neighborhood environments in drinking behavior among youths.
Keywords: Native Americans, youths, alcohol, school, neighborhood
Introduction
Drinking among Native American youths is a serious public health concern. Even though there is considerable heterogeneity of drinking patterns among Native American tribes (Szlemko et al., 2006), Native American youths have been found to start using alcohol at younger ages, drink more frequently, and consume greater quantities of alcohol compared with other youths (Friese and Grube, 2008; Friese et al., 2011; Spear et al., 2005). Overall, the Native American population experiences greater negative health consequences because of alcohol use and abuse, including chronic liver disease, alcohol-related automobile crashes, suicide, homicide, and dependence (Naimi et al., 2008). Given these statistics, it is important to better understand why Native American youths drink more than White youths. This study examines whether differences in the perceived neighborhood and school environments can account for differences in self-reported drinking behavior among Native American and White youths.
This study examines the role of Native American and White youth’s perceived neighborhood and school environments in Montana. Montana is home to twelve tribal nations that govern seven reservations comprising about 9% of Montana’s land base (Montana Office of Public Instruction, 2009). Approximately 66,000 Native Americans reside in Montana. There are more than 16,000 Native American students are enrolled in Montana schools. The majority of Native Americans (approx. 63%) live off reservations, mostly in the larger cities, such as Great Falls, Missoula and Billings (Montana Office of Public Instruction, 2009). A report focusing on Native Americans living eastern Montana found that Native Americans in urban areas face significantly higher poverty, unemployment, poorer physical and mental health, and higher suicide rates (Urban Indian Health Institute, 2011).
The environment where youths live has been shown to play a significant role in the risk behaviors in which they engage. From an opportunities and constraints perspective (Treno, Ponicki, Remer, and Grunewald, 2008), certain neighborhood features (e.g., drug dealing, empty buildings) may encourage alcohol consumption among young people because they increase availability of alcohol, provide greater opportunities for and contexts in which to drink, or reinforce norms supporting substance use. Conversely, other neighborhood characteristics (e.g., alcohol and drug use norms antithetical to use, greater police enforcement) may reduce opportunities for alcohol use, provide normative support for non-use, or increase the negative consequences of drinking. More generally, neighborhood disorganization is broadly defined as “…the inability of a community to realize common goals and solve chronic problems” (Kurbin & Weitzer, 2003, p. 374). Commonly used indicators of neighborhood disorganization include concentrated poverty, residential mobility, ethnic heterogeneity, weak social networks, and related neighborhood conditions (graffiti, empty buildings) reflecting a lack of social cohesion and social control. Research has shown that neighborhood disorganization is related to increased adolescent drug and alcohol use (Buu et al., 2009; Duncan et al., 2002; Winstanley et al., 2008). Conversely, parents’ and community leaders’ perceived neighborhood strength, such as residents participating in activities together and level of community resources, is negatively associated with youths’ alcohol use (Tobler et al., 2009).
Despite the extensive studies that have been conducted on the relationships between neighborhood factors and substance use, only a few studies have focused on Native American youths. One study found that Native American youths’ perceived neighborhood safety and the presence of crime and drug sales were strong predictors of alcohol and marijuana use (Nalls et al., 2009). However, another study that compared Native American and non-Native American youths found that Native American youths were less adversely affected by neighborhood disorganization than non-Native American youths (Yabiku et al., 2007). The authors attributed this difference to cultural characteristics such as closer familial relationships and ethnic pride which may act as protective factors. One study examining the role of neighborhood disorganization and substance use among Montana Native American youth found that neighborhood disorganization was not a significant predictor of substance use (Heavyrunner-Rioux & Hollist, 2010). However, the same study found that mobility, unemployment, and poverty explained differences in lifetime and 30 day marijuana use between youth living on and off reservations (Heavyrunner-Rioux & Hollist, 2010).
Higher levels of police enforcement and other forms of social control also may have a protective effect and prevent drinking among youths by increasing the likelihood of negative consequences. For example, a study has shown that higher levels of perceived police enforcement of underage drinking and possession laws are associated with lower rates of alcohol use and binge drinking among youths (Dent et al., 2005). Likewise, greater perceived police enforcement has been linked to reduced 30 day drinking among youths (Lipperman-Kreda et al., 2009). In addition, informal social control from neighbors may be important. For example, neighbors who know youths in their neighborhood are more likely to intervene if they observe problem behavior (Sampson et al., 1997).
Even though is a relation between perceived enforcement and reductions in problem behavior, studies have rarely included Native Americans. As a result, research on enforcement and perceived enforcement and Native Americans is limited. One study of young adults Aboriginal drug users in Canada that examined perceptions and interactions with police, found that Aboriginals were deeply distrustful of police, and increased enforcement was related to more risky behaviors like syringe sharing (Pan et al., 2013).
Adolescents spend considerable time at school, and the perceived school environment may play a significant role in their behavior. Perceiving the school environment as supportive and safe, feeling connected to school, and having positive relationships with teachers have been shown to be related to better mental health, less involvement in health risk behaviors, and reduced likelihood of violent and delinquent behaviors among teens (Battistich and Horn, 1997; Kitsantas et al., 2004; Resnick et al, 1997; Youngblade et al., 2007). A study examining the health behavior of adolescents found that students who had a positive view of school and perceived teachers to be supportive were more likely to engage in health promoting behaviors (McLellan et al., 1999). Perceived teacher support has also been found to be associated with a lower probability of initiating drinking and fewer episodes of getting drunk (McNeely and Falci, 2004).
Few studies have examined the relationship between school environment and alcohol use among Native American youth. However, the few studies that have been conducted suggest that increased school bonding may be linked to reduced substance use. One study found that school bonding (e.g., liking school and liking teachers) is a protective factor for lifetime drinking among Native American youth under 16, but not for youth over 16 (Dickens, Dieterich, Henry & Beauvais, 2012). A small-scale study of Native American teens living in an urban environment found that youth who reported a greater sense of belonging to school were less likely to report lifetime drinking, as well as lower frequency of drinking (Napoli, Marsiglia & Kulis, 2003).
National data on school crime and safety suggest that the school environment experienced by Native American youth may be significantly more challenging than for most other racial and ethnic groups (Robers, Kemp, Truman & Snyder, 2013). For example, 41% of Native American students reported that drugs were offered, sold or given to them on school property compared to 23% of White students, and 8% reported that they had been threatened with a weapon on school property in the past year versus 6% of White students. A study comparing Native American students living on and off reservations using Montana data found that Native American students, overall, were more likely to get suspended from school than other students and that Native American students living on reservations were significantly more likely to get suspended than Native American students living off reservations (Department of Public Health and Human Services, 2008). For example, 18% of Native American12th graders living on reservations and 11% living off reservations were suspended compared to 7% of other youth. Significantly more Native Americans than other students were considered at risk on measures in the community, school, peer, and family domains, with 71% of students living on reservations, 74% living off reservations compared to 53% of other students considered at high risk.
The purpose of this study is to examine whether differences in the perceived neighborhood and school environments can account for differences in drinking behavior between Native American and White youths. We hypothesized that Native American status generally would be related to less favorable perceptions of neighborhood and school, which, in turn, would be related to increased alcohol consumption. That is, we expected that perceptions of neighborhood and school would mediate or account for the relation between Native American status and alcohol consumption. Given the current state of the research literature, we did not make hypotheses about the relative importance of specific aspects of the perceived environments in mediating the relation between Native American status and drinking. The present study fills a gap in our knowledge by exploring environmental explanations for the differences in drinking between these groups. Such information is critical to understanding the role of the environment on youths’ drinking and how different aspects of the perceived environment may be related to drinking. This information may help in designing effective policies and environmental interventions that focus on underage drinking.
Method
Survey data
The data were from the 2008 Prevention Needs Assessment Community Student Survey (PNA), which is conducted by the Montana Department of Public Health and Human Services. This voluntary and anonymous survey is administered every other year with students in grades 8, 10 and 12. The survey is designed to measure adolescent substance use, anti-social behavior, and risk and protective factors. The survey was administered by teachers who had been specifically trained on the survey protocols, including the importance of confidentiality. Teachers remained in the classroom during the survey administration, but to protect confidentiality, students placed their completed surveys in a plain envelope which was sealed. All schools, including tribal schools and schools on reservations, with grades 8, 10 or 12 in Montana are eligible for participation. In 2008, data were collected using self-administered surveys in 193 out of 338 eligible schools. Of all eligible students in grades 8, 10 and 12 across all schools in Montana, 66% participated in the 2008 PNA. School boards were responsible for deciding whether to require active or passive consent from parents.
Sample
Of the 21,225 youths who participated in the 2008 survey, 17,131 identified themselves as exclusively Native American or White and were considered eligible for inclusion in this study. Of these, 13,224 (77%) had complete data on all of the variables of interest. Overall, 5.4% (N = 719) of the study sample were Native American and 94.6% (N = 12,505) were White (Table 1). Mixed race youths were excluded because they do not represent a homogenous group, thus making any conclusions about them very difficult. Youths who identified themselves as Native American were not asked about their tribal affiliations nor were they asked whether they resided on tribal land.
Table 1.
Comparison of Drinking and Risk Factors for Native American and White Youths
| Variables | Native American (N = 719) |
White (N = 12,505) |
Cohen’s d | p |
|---|---|---|---|---|
| Drinking Behaviors | ||||
| Lifetime drinking | 75.4% | 65.2% | – | .001 |
| 30 day drinkinga | 48.7% | 36.6% | – | .001 |
| Heavy episodic drinkinga | 35.3% | 22.7% | – | .001 |
|
| ||||
| Perceived Neighborhood ATOD Norms | ||||
| How wrong to use marijuana | 2.0 (1.02) | 1.4 (.74) | .67 | .001 |
| How wrong to drink alcohol | 2.1 (.99) | 2.0 (.94) | .10 | ..005 |
| How wrong to smoke cigarettes | 2.2 (1.08) | 1.7 (.90) | .50 | .001 |
|
| ||||
| Perceived Neighborhood Disorganization | ||||
| Crime/drug selling | 1.9 (.98) | 1.4 (.72) | .58 | .001 |
| Fights | 2.0 (.99) | 1.5 (.76) | .57 | .001 |
| Empty/abandoned buildings | 1.7 (.84) | 1.4 (.71) | .39 | .001 |
| Graffiti | 1.7 (.83) | 1.3 (.59) | .56 | .001 |
|
| ||||
| Perceived Neighborhood Social Support | ||||
| Neighbors notice when I do a good job | 1.8 (.84) | 2.1 (.92) | .34 | .001 |
| Adults in my neighborhood to talk to | 2.0 (.95) | 2.3 (.99) | .31 | .001 |
| Neighbors are proud when I do well | 2.1 (.98) | 2.4 (.94) | .31 | .001 |
| Neighbors encourage me | 2.2 (1.00) | 2.5 (.96) | .31 | .001 |
|
| ||||
| Perceived police enforcement | ||||
| Police catch for smoking marijuana | 1.9 (.80) | 2.2 (.86) | .36 | .001 |
| Police catch for smoking | 1.8 (.76) | 2.0 (.80) | .26 | .001 |
| Police catch for drinking alcohol | 2.1 (.85) | 2.1 (.78) | .00 | .914 |
| Police catch for carrying a handgun | 2.5 (1.02) | 2.5 (.95) | .00 | .801 |
|
| ||||
| Perceived Positive School Experiences | ||||
| Teacher notices a good job | 2.8 (.82) | 2.8 (.74) | .00 | .618 |
| School notifies parents | 2.3 (.88) | 2.3 (.81) | .00 | .128 |
| Teachers praise hard work | 2.4 (.81) | 2.5 (.76) | .13 | .052 |
| Teacher notices a good job | 2.8 (.82) | 2.8 (.74) | .00 | .618 |
|
| ||||
| Perceived Opportunities for School Involvement | ||||
| Chances to get involved | 3.4 (.70) | 3.5 (.64) | .15 | .001 |
| Chances to talk with teacher | 3.0 (.78) | 3.0 (.72) | .00 | .055 |
| Chances for class activities | 2.9 (.70) | 3.1 (.65) | .30 | .001 |
Lifetime drinkers only
Note: Standard deviations are in parentheses.
Measures
Individual Characteristics
Background variables
Background variables included gender (0 = female, 1 = male), age (10 = 10 or younger, 11, 12, 13, 14, 15, 16, 17, 18, 19 = 19 or older), and race (1 = Native American, 0 = White). In addition, parents’ educational attainment was ascertained by asking youths about the highest level of schooling completed by their mother or father (1 = completed grade school or less, 2 = some high school, 3 = completed high school, 4 = some college, 5 = completed college, 6 = graduate or professional school after college). These variables were included in the primary analyses as controls in order to account for individual differences that might confound the findings.
Drinking
Lifetime drinking frequency was ascertained by asking respondents on how many occasions they had ever had more than just a few sips of any alcoholic beverage (0, 1–2, 3–5, 6–9, 10–19, 20–39, and 40 or more). Drinking in the previous month was measured by asking on how many occasions during the last 30 days they had beer, wine or liquor to drink (0, 1–2, 3–5, 6–9, 10–19, 20–39, and 40 or more). Lifetime drinking and 30 day drinking frequency were re-coded to response category midpoints (0, 1.5, 4, 7.5, 14.5, 28.5, and 40) in order to put the responses into a meaningful metric (number of drinking occasions). Heavy episodic drinking was measured by asking how many times in the last two weeks the youth had five or more alcoholic drinks in a row (none, once, twice, 3–5 times, 6–9 times, and 10 or more times). Heavy episodic drinking was also re-coded to category midpoints (0, 1, 2, 4, 7.5, and 10) to provide a meaningful metric.
Perceived Neighborhood and School Environment
There were five neighborhood and environment scales: (a) perceived anti-alcohol, tobacco and other drugs use (ATOD) norms, (b) perceived neighborhood disorganization, (c) perceived social support, (d) perceived police enforcement, and (e) perceived school environment. Similar items have been used in previous studies of neighborhood and school characteristics and health outcomes. The resulting scales generally show good internal and test-retest reliability at both the individual and neighborhood levels, show variability across neighborhoods, and correlate in expected directions with census characteristics such as poverty (Mujahid, Diez Roux, Morenoff, & Raghunathan, 2007). Nonetheless, these measures also showed significant heterogeneity within neighborhoods, indicating that they are influenced by individual characteristics and experiences, as well as by neighborhood features.
Perceived neighborhood anti-alcohol, tobacco, and other drug (ATOD) use norms
Perceived neighborhood anti-ATOD norms were measured with three items: “How wrong would most adults (over 21) in your neighborhood think it is for kids your age to use marijuana?,” “How wrong would most adults (over 21) in your neighborhood think it is for kids your age to drink alcohol?,” and “How wrong would most adults (over 21) in your neighborhood think it is for kids your age to smoke cigarettes?” These items were presented on four-pint scales (1 = very wrong, 2 = wrong, 3 = a little bit wrong, 4 = not wrong at all).
Perceived neighborhood disorganization
Perceived neighborhood disorganization was measured by asking four questions about the conditions in the neighborhood reflecting a lack of cohesion and social control: “How much does each of the following statements describe your neighborhood? (a) Crime and/or drug selling, (b) fights, (c) lots of empty or abandoned buildings, and (d) lots of graffiti. These items were rated on a scale of 1 = NO!, 2 = no, 3 = yes, and 4 = YES!.
Perceived neighborhood social support
Perceived social support from neighbors was measured with four questions: “My neighbors notice when I am doing a good job and let me know about it,” “There are lots of adults in my neighborhood I could talk to about something important,” “There are people in my neighborhood who are proud of me when I do something well,” and “There are people in my neighborhood who encourage me to do my best.” These items were rated on a scale of 1 = NO!, 2 = no, 3 = yes, and 4 = YES!.
Perceived police enforcement
Perceived police enforcement in the neighborhood was measured with four items: “If a kid smoked marijuana in your neighborhood would he or she be caught by the police?,” “If a kid smoked cigarettes in your neighborhood would he or she be caught by the police?,” “If a kids drank some beer, wine, or hard liquor in your neighborhood would he or she be caught by the police?,” and “If a kid carried a handgun in your neighborhood would he or she be caught by the police?” These items were rated on a scale of 1 = NO!, 2 = no, 3 = yes, and 4 = YES!.
Perceived school environment
Perceived school environment measures included two scales: (a) positive school experiences and (b) opportunities for school involvement. Three items measured positive school experiences: “My teacher notices when I am doing a good job and lets me know about it,” “The school lets my parents know when I have done something well,” and “My teachers praise me when I work hard in school”. Perceived opportunities for school involvement was measured with three items: “There are lots of chances for students in my school to get involved in sports, clubs, and other school activities outside of class;” “There are lots of chances for students in my school to talk with a teacher one-on-one;” and “I have lots of chances to be part of class discussions or activities.” All of these items were rated on a scale of 1 = NO!, 2 = no, 3 = yes, and 4 = YES!.
Analysis plan
Initially we used bivariate tests to compare Native American and White youths in terms of background characteristics, drinking behaviors, and each of the individual risk items. The purpose of these analyses was to explore how these youths differed on these factors. Latent variable structural equation modeling was then used to explore the relations of drinking behaviors with the background characteristics and with perceived neighborhood and school environments. The purpose of these analyses was to ascertain if perceptions of neighborhood and school environments could account for differences in drinking behaviors between Native American and White youths. To this end, we compared a fully mediated model with a partially mediated model. The fully mediated model assumed that differences in drinking outcomes between Native American and White are entirely mediated through or accounted for by perceptions of neighborhood and school characteristics. The partially mediated model added a direct relation between Native American status and drinking in addition to the indirect relations specified in the fully mediated model. A significant improvement in fit between the fully mediated and partially mediated models would indicate that perceptions of neighborhood and school environments do not completely account for observed differences in drinking between Native American and White youths. Gender, age, and parents’ education (any college/no college) were included in these models as controls.
Results
Bivariate Comparisons
Background characteristics
Approximately half of the sample was male for both Native American (48.7%) and White youths (48.2%). The samples did not differ significantly in this regard (p < .80). Native American youths were slightly younger (15.5 years) than White youths (15.6 years), but this difference was not statistically significant. Fewer Native American youths reported that their parents had a college degree (40.6%) compared with White youths (54.6%; OR = .57, p <.001)
Drinking
Comparisons of Native American and White youths on drinking, and each of the risk factor items, are presented in Table 1. Compared with White youths (65.2%), more Native American youths (75.4%) had consumed alcohol in their lifetime (OR = 1.64; p < .001). Similarly, more of those Native American youths who ever drank reported drinking in the past 30 days (64.6% vs. 56.1%; OR = 1.43, p < .001) and heavy episodic drinking in the past 2-weeks (46.9% vs. 34.9%; OR = 1.65, p < .001) compared with White drinkers. This replicates previous findings (Friese et al., 2011).
Neighborhood and school perceptions
Because of the large sample size almost all of the neighborhood and school items showed a statistically significant difference between Native American and White youths. Although some of the differences are small (e.g., school involvement variables), the effect sizes for others (e.g., crime/drug selling, neighborhood smoking norms) are in what is conventionally considered the medium range (e.g., d ≥ .50). Neighborhood ATOD norms differed for Native American and White youths with White youths perceiving greater disapproval from adults in the neighborhood for substance use. These differences were moderately large for marijuana use and smoking, but relatively small for alcohol use. There were parallel differences in perceived neighborhood disorganization with Native American youths agreeing more strongly than White youths that there was crime or drug selling, fights, abandoned buildings, and graffiti in their neighborhood. Native American youths also reported feeling less safe in their neighborhood than did White youths. Overall, these differences were moderate in size. White youths reported more social support from adult neighbors than Native American youths, although the effect sizes were modest. Whites also perceived somewhat more police enforcement of marijuana and underage smoking laws, but not alcohol or handgun laws. The two groups did not differ significantly on these latter items. White youths reported feeling safer at school, whereas Native American youths reported that teachers were more likely to tell parents when they did a good job at school. They did not differ in reporting that teachers gave praise for hard work at school or noticing when they did a good job at school. White youths generally perceived more opportunities for positive involvement in school. For the most part, these differences in perceptions of the school environment were small.
Structural Equation Modeling
The primary analysis consisted of a latent variable structural equation model to investigate whether differences in school and community variables could account for the differences in drinking observed between Native American and White youths. These analyses were conducted separately using cases with complete data (listwise deletion) and using EM estimators for imputing missing data. Sensitivity analyses indicated that the results using the two approaches did not differ substantively. That is, they produced nearly identical parameter estimates in all models. The conclusions regarding relative effect sizes and directions were unaffected. Only the results for cases with complete data are reported here.
Measurement model
As a first step in the modeling process we used confirmatory factor analyses (CFA) to ascertain if the structure underlying the survey items conformed to our a priori constructs. The initial measurement model specified that each item would load only on its hypothesized latent factor. The unstandardized loading for one variable on each factor was fixed at 1.0. The factors were allowed to freely correlate with one another. The analyses were conducted using EQS 6.1. Listwise deletion was used to omit cases with missing data. Because of the large sample sizes, the comparative fit index (CFI) and the RMSEA were the primary indicators used to assess fit rather than the χ2 statistic. A CFI > .90 and a RMSEA < .05 were taken as indicative of an adequate fit.
Although the chi-square statistic was significant, other fit indices indicated that the measurement model fit the data reasonably well, χ2 (231) = 6,291.55, p < .001, CFI = .96, RMSEA = .041 (90% CI = .041, .042). A multi-group CFA confirmed that the measurement model was equivalent for the Native American and White samples. That is, a model fully constraining the factor loadings and factor correlations to be equal across groups showed a very good fit, CFI = .96, RMSEA = .026 (90% CI = .025–.026). Table 2 displays the results from the CFA and Table 3 displays the factor correlations.
Table 2.
Standardized Measurement Model
| Item | Drinking | Positive School Experiences |
Perceived Opportunities for School Involvement |
Perceived Neighborhood ATOD Norms |
Perceived Neighborhood Disorganization |
Perceived Social Support |
Perceived Police Enforcement |
|---|---|---|---|---|---|---|---|
| Lifetime Frequency* | .68 | ||||||
| 30-Day Frequency | .85 | ||||||
| 5+ Drinks | .84 | ||||||
|
| |||||||
| Teachers Notice* | .71 | ||||||
| School Notify Parents | .62 | ||||||
| Teachers Praise | .74 | ||||||
|
| |||||||
| Involved in School* | .54 | ||||||
| One-on-One | .63 | ||||||
| Class Activities | .63 | ||||||
|
| |||||||
| Marijuana Use* | .76 | ||||||
| Alcohol Use | .77 | ||||||
| Cigarettes | .84 | ||||||
|
| |||||||
| Drug Sales* | .80 | ||||||
| Fights | .83 | ||||||
| Empty Buildings | .72 | ||||||
| Graffiti | .77 | ||||||
|
| |||||||
| Notice Good Job* | .73 | ||||||
| Adults Talk | .72 | ||||||
| Adults proud | .91 | ||||||
| Adults Encourage | .91 | ||||||
|
| |||||||
| Police–Marijuana* | .88 | ||||||
| Police–Cigarettes | .88 | ||||||
| Police–Alcohol | .78 | ||||||
| Police–Gun | .64 | ||||||
Unstandardized factor loading fixed at 1.0.
Table 3.
Factor Correlations
| Drinking | Positive School Experiences |
School Involvement |
Neighborhood Anti-ATOD Norms |
Neighborhood Disorganization |
Social Support |
Perceived Police Enforcement |
|
|---|---|---|---|---|---|---|---|
| Drinking | 1.0 | −.19 | −.21 | −.38 | .27 | −.12 | −.26 |
| Positive School Experiences | 1.0 | .70 | .20 | −.14 | .38 | .27 | |
| School Involvement | 1.0 | .24 | −.27 | .31 | .19 | ||
| Neighborhood ATOD Norms | 1.0 | −.49 | .23 | .35 | |||
| Neighborhood Disorganization | 1.0 | −.19 | −.19 | ||||
| Social Support | 1.0 | .31 | |||||
| Perceived Police Enforcement | 1.0 |
Note: p < .001 in all cases
Structural models
A hierarchical approach was used in which a fully mediated model was considered first. This model included direct effects of race (Native American vs. White) on each of the community and school factors and from these factors to drinking. No direct effect from race to drinking was specified. Background variables were included as predictors of each of the risk factors and of drinking. They were allowed to freely covary with one another and with race. Thus, the initial model assumed that the relation between race and the drinking outcomes were entirely accounted for by differences on the school and community variables and in background variables. A specification search was then undertaken using Wald tests to determine if any of the relations specified in the initial model could be dropped without reducing fit. At the same time Lagrange tests were examined to ascertain if any background variables were directly related to alcohol use. Finally, the Lagrange test and associated model test statistics for race were examined to determine if Native American status was directly related to drinking even after taking perceived community factors and background variables into account (partially mediated model) and whether any of the predictors had unique effects on the individual indicators (lifetime, 30-day, heavy episodic) drinking.
The initial fully mediated model provided a reasonable fit to the data, χ2 (307) = 8,463.81, p < .001, CFI = .95, RMSEA = .045 (90% CI = .044, .045). The Wald tests, however, suggested dropping a number of the relations among background variables and the mediators and drinking. Similarly, the relation between Native American and perceived positive school experiences was dropped because it was not statistically significant as was the relation between this factor and drinking. The relation between perceived neighborhood social support and drinking was also dropped from the model because it was not significant. The Lagrange tests indicated that there was a substantial and positive relation between age and lifetime drinking that could not be accounted for by the relation between age and the overall latent drinking factor (β = .20, z = 28.54, p < .001),. This effect was added to the model. Similarly, based on the Lagrange tests, unique effects on lifetime drinking of perceived neighborhood norms (β = −.10, z = −10.34, p < .001), perceived neighborhood disorganization (β = −.06, z = 6.92, p < .001), and perceived police enforcement (β = .10, z = −6.03, p < .001) were added to the model. In each case, the unique effects indicated that these variables had a relationship with lifetime drinking frequency that was not entirely captured by their relations with the latent drinking variable. At this point, the Lagrange test showed a substantively small, but statistically significant, direct effect of Native American status on drinking based on the change in χ2. Adding this effect, however, did not improve either the CFI or RMSEA and thus a fully mediated model was accepted as the final model. The final model showed an acceptable fit to the data, scaled χ2 (301) = 6,285.01, p < .001, CFI = .96, RMSEA = .039 (90% CI = .038, .039).
Table 4 summarizes the structural coefficients, test statistics, and R2 values for the final model. Figure 1 shows the standardized relations among Native American status, the mediators, and drinking. For simplicity, this figure does not depict the relations of background characteristics with the mediators or drinking factors. In the multivariate analyses Native American youths, compared with White youths, reported fewer opportunities for school involvement, less social support from adults in the neighborhood, and less perceived police enforcement in their neighborhood. Conversely, they reported more neighborhood disorganization and neighborhood norms that were less disapproving of ATOD use. Native American status was not related to positive school experiences. School involvement and perceived police enforcement were, in turn, negatively related to drinking. Perceived neighborhood norms and disorganization were positively related to drinking. Positive school experiences and neighborhood social support were not significantly related to drinking once background characteristics and the other risk factors were taken into account.
Table 4.
Final Structural Model
| Predictor | Standardized Coefficient | Unstandardized Coefficient | SE | Z |
|---|---|---|---|---|
| Drinking | ||||
| Perceived Opportunities for School Involvement | −.12 | −3.10 | .291 | −10.65 |
| Perceived Neighborhood Anti ATOD Norms | −.19 | −2.88 | .195 | −14.79 |
| Perceived Neighborhood Disorganization | .11 | 1.61 | .172 | 9.33 |
| Perceived Police Enforcement | −.06 | −.71 | .117 | −6.03 |
| Gender (Male) | .06 | .98 | .149 | 6.53 |
| Age | .16 | .76 | .049 | 15.59 |
| Parent’s Education | −.05 | −.35 | .062 | −5.68 |
| R2 = .19 | ||||
|
| ||||
| Perceived Positive School Experiences | ||||
| Gender (Male) | −.05 | −.06 | .010 | −5.63 |
| Age | −.08 | −.03 | .003 | −9.05 |
| Parents’ Education | .06 | .02 | .004 | 5.48 |
| R2 = .01 | ||||
|
| ||||
| Perceived Opportunities for School Involvement | ||||
| Native American | −.05 | −.08 | .014 | −5.28 |
| Gender (Male) | −.07 | −.05 | .007 | −6.53 |
| Parents’ Education | .08 | .02 | .003 | 7.08 |
| R2 = .02 | ||||
|
| ||||
| Perceived Neighborhood Anti-ATOD Norms | ||||
| Native American | −.13 | −.32 | .023 | −14.21 |
| Gender (Male) | −.02 | −.03 | .010 | −2.67 |
| Age | −.29 | −.10 | .003 | −31.51 |
| Parents’ Education | .08 | .04 | .004 | 9.23 |
| R2 = .11 | ||||
|
| ||||
| Perceived Neighborhood Disorganization | ||||
| Native American | .17 | .43 | .024 | 18.31 |
| Gender (Male) | .04 | .04 | .011 | 4.09 |
| Age | .03 | .01 | .003 | 3.66 |
| Parent’s Education | −.14 | −.07 | .004 | −15.49 |
| R2 = .06 | ||||
|
| ||||
| Perceived Neighborhood Social Support | ||||
| Native American | −.07 | −.21 | .026 | −8.09 |
| Age | −.07 | −.03 | .003 | −8.49 |
| Parent’s Education | .12 | .07 | .005 | 13.36 |
| R2 = .03 | ||||
|
| ||||
| Perceived Police Enforcement | ||||
| Native American | −.07 | −.21 | .029 | −7.20 |
| Gender (Male) | −.04 | −.06 | .013 | −4.92 |
| Age | −.28 | −.12 | .004 | −31.36 |
| Parent’s Education | .07 | .04 | .006 | 7.62 |
| R2 = .09 | ||||
Note: all ps < .01.
Figure 1.
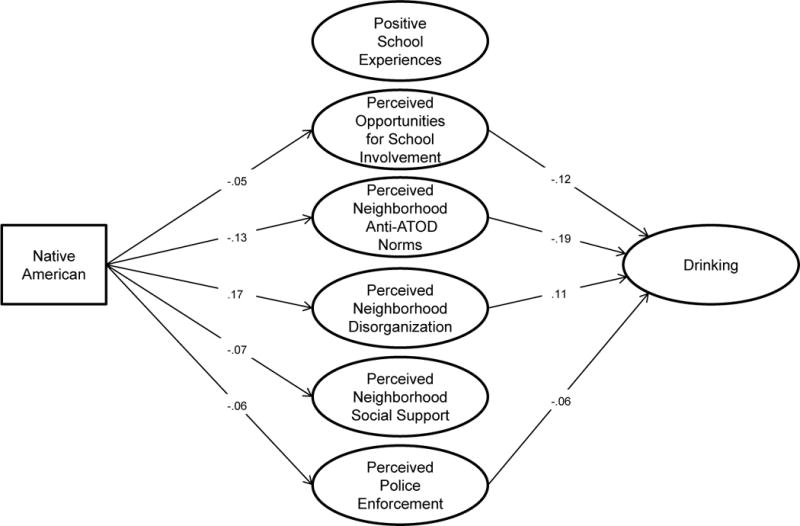
Standardized Structural Equation Model of Drinking among Native American and White Youths
Indirect effects
Overall, Native American status had a significant indirect relation with drinking through the hypothesized mediators in the model (β = .05, z = 13.69, p < .001). We decomposed the indirect effects (Table 5) using the Aroian version of the Sobel Test (MacKinnon, Warsi, & Dwyer, 1995). For the most part, the estimated indirect effects for the individual factors are small, but cumulatively accounted for the relation between being Native American and drinking. Thus, the higher drinking rates among Native Americans in this sample appear to be accounted for by lower school involvement, weaker perceived anti-drug norms, greater perceived neighborhood disorganization, and lower levels of perceived police enforcement. Weaker perceived anti-drug norms uniquely accounted for about 46% and perceived neighborhood disorganization for 34% of the total mediated effects.
Table 5.
Estimates of Indirect Effects of Native American Status on Drinking
| Mediator | β | b | SEb | z |
|---|---|---|---|---|
| School Involvement | .01 | .24 | .049 | 4.93 |
| Perceived Neighborhood Anti-ATOD Norms | .02 | .93 | .092 | 10.16 |
| Perceived Neighborhood Disorganization | .02 | .69 | .084 | 8.28 |
| Perceived Police Enforcement | .004 | .15 | .033 | 4.65 |
All ps < .001
Discussion
Overall, Native American youths were significantly more likely than White youths to drink and drink heavily. Native American youths also reported less involvement in school, greater neighborhood disorganization, weaker perceived anti-drug norms, less social support from adults in their neighborhood, and less perceived police enforcement. Our results from the structural equation model further suggest that these individual differences in perceptions of the social and physical environment may mediate or otherwise account for differences in drinking between Native American and White youths. In particular, higher drinking rates among Native Americans may be accounted for by fewer opportunities for school involvement, weaker perceived anti-drug norms, greater neighborhood disorganization, and lower levels of perceived police enforcement. Although the individual mediational effects were very small, when these risk factors were taken into account as a whole differences in drinking between the two groups were substantially reduced. One implication of our findings is that social and economic disparities may be factors underlying the observed differences in drinking behaviors among Native American and White youths. Addressing these disparities may be an important step toward reducing drinking and its associated problems among youths in Native American communities. Our findings further suggest that perceptions of a neighborhood as having weak anti-drug norms may be an important risk factor. This factor showed the strongest relation with drinking and the largest, although still modest, mediation of Native American status on drinking. Social marketing or other interventions that target adult norms in the community or young peoples’ perceptions of these norms may be a useful approach for prevention.
There is also evidence from our analyses that perceptions of the school environment, and especially perceived opportunities for school involvement, may have a protective influence against alcohol use and may reduce the disparity in drinking observed between Native American and White youths. Such involvement includes in-school and after-school activities and having opportunities to get one-on-one attention from teachers. Opportunities may be limited for Native American students for a number of reasons, including schools not having enough resources, activities not being culturally sensitive or of interest to Native American students, or implicit racial expectations by school staff/teachers keeping Native American youth from participating. Increasing opportunities may allow youths to engage in activities that do not include alcohol or are otherwise protective. Positive school experiences, such as teachers noticing that the youth does a good job, the school notifying parents when the youth has done a good job, or being praised by a teacher for working hard in school are not related to drinking in the multivariate model and were not predicted from Native American status. This finding suggests that this factor does not account for differences in drinking among Native American and White youths. On the surface this may appear to be contrary to findings that have shown that positive school experiences, such as teacher connectedness, can reduce adolescent health risk behaviors (Voisin et al., 2005). In part, our lack of a significant finding may be due to the collinearity between school involvement and positive school experiences (r = .70). In fact, the simple correlations indicate that these two factors are related to drinking to a similar degree (rs = −.21 and −.19, respectively).
One of the strengths of this study is that the dataset includes a large number of Native American youths. However, there are several limitations. One of the limitations of data used for this, and the majority of other studies that include Native Americans, is that tribal affiliation was not ascertained. This is an important consideration because alcohol use may vary in social acceptability among tribes and may be influenced by tribal norms and availability of alcohol on specific reservations and in specific communities. Further research should address how underage drinking norms may differ among different Native American communities. In addition, the study findings based on Montana data may not generalize to youths in other parts of the US.
The study’s cross-sectional design precludes causal interpretations of the observed relations. For example, youth drinking may be the result of the perceived neighborhood or school environment, or conversely, alcohol use by youths may influence their perceptions of their surroundings. Similarly, although the final structural model was consistent with a mediational interpretation, the cross-sectional nature of the data does not allow us to rule out the possibility that the observed relationships are spurious. Longitudinal research is needed to better ascertain the directionality of these relationships. Another measurement issue arises because of reliance on self-reports of the environmental factors. Such subjective measures may be influenced by an individual’s own characteristics and experiences as well as by environmental attributes (Mujahid, Diez Roux, Morenoff, & Raghunathan, 2007). Furthermore, teacher administered surveys may introduce under-reporting of socially disapproved beliefs and behaviors because students worry that their answers are not truly anonymous or confidential. To minimize this possibility, all teachers were trained in survey administration, including the need for confidentiality. Moreover, completed surveys were sealed in plain envelopes to further assure students that teachers would not see their answers.
Another limitation is that we only have one measure of socio-economic status. We included parent education as a covariate, but this variable may not completely capture differences in socio-economic status. It is unclear how the findings would be affected if we had a more comprehensive measure of socio-economic status. In addition, the upper limit of drinking occasions on the alcohol consumption measures was 40+ which may have truncated the response range and reduced the variance. However, only a relatively small number of youths reported drinking on 40+ occasions in their lifetime (15%) and an even smaller number (2%) reported doing so in the past month. A further limitation of the dataset is that individual schools are not identified, which means that school-level effects cannot be examined. Furthermore, students are also nested within neighborhoods, and neighborhood-level effects could not be modeled given the limitations of the data set. In addition, tribal schools are not identified. Thus it was not possible to investigate how students’ perceptions of the environment in tribal and non-tribal schools may differ. We also do not know how the actual environment of tribal schools may differ from that of non-tribal schools; tribal schools adhere to guidelines and regulations set forth by Montana Office of Public Instruction, but the school environments may be different in other ways. In addition, it is important to note that students attending schools on reservations are subject to local tribal law enforcement if they violate alcohol or drug laws on the reservation. Tribal law enforcement practices concerning alcohol and drug violations vary from one reservation to another making it difficult to identify the level of enforcement on reservations. These are questions and issues that should be addressed in future research.
Finally, some shortcomings regarding the sample should be noted. The participation rate in the survey was relatively modest. Out of all eligible students in grades 8, 10, and 12 across all eligible schools in Montana, 66% of them participated. Importantly, the demographic make-up of students who participated in the Montana PNA survey is very similar to that of the overall Montana student population (MDPHHS, 2010). Nevertheless, selection effects may have occurred. It was not possible to model selection biases because appropriate data were not available. As a result, it is possible that such biases affected the findings. Another shortcoming of a school-based survey is that youths who drop out of school are not represented. According to the National Center for Education Statistics (2007), the dropout rate in Montana is higher among Native American youths than among White youths (7.5% vs. 3.2% of 9 – 12th graders). However, overall the dropout rate is low and likely does not have a significant effect on the pattern of the findings.
Despite its limitations, this study makes an important contribution to our understanding of potential mechanisms that may explain observed differences in drinking between Native American and White youths. Our findings suggest that these differences may be mediated by or otherwise accounted for by differences in perceptions of the neighborhood and school environments.
Acknowledgments
This publication was made possible by grant R01AA018378 (PI: B. Friese) from the National Institute on Alcohol Abuse and Alcoholism (NIAAA). The content is solely the responsibility of the authors and does not necessarily represent the official views of NIAAA or of the National Institutes of Health.
Contributor Information
Bettina Friese, Prevention Research Center, Pacific Institute for Research and Evaluation (PIRE), Oakland, CA
Joel W. Grube, Prevention Research Center, Pacific Institute for Research and Evaluation (PIRE), Oakland, CA
Steve Seninger, Bureau of Business and Economic Research, University of Montana, Missoula, MT
References
- Bachman JG, Wallace JM, O’Malley PM, Johnston LD, Kurth CL, Neighbors HW. Racial/ethnic differences in smoking, drinking, and illicit drug use among American high school seniors, 1976–89. American Journal of Public Health. 1991;81:372–377. doi: 10.2105/ajph.81.3.372. [DOI] [PMC free article] [PubMed] [Google Scholar]
- Battistich V, Horn A. The relationship between students’ sense of their school as a community and their involvement in problem behaviors. American Journal of Public Health. 1997;87:1997–2001. doi: 10.2105/ajph.87.12.1997. [DOI] [PMC free article] [PubMed] [Google Scholar]
- Beauvais F. Trends in drug use among American Indian students and dropouts 1975–1994. American Journal of Public Health. 1996;8:1594–1598. doi: 10.2105/ajph.86.11.1594. [DOI] [PMC free article] [PubMed] [Google Scholar]
- Beauvais F. American Indians and alcohol. Alcohol Health and Research World. 1998;22:253–259. [PMC free article] [PubMed] [Google Scholar]
- Buu A, DiPiazza C, Wang J, Puttler LI, Fitzgerald H, Zucker RA. Parent, family, and neighborhood effects on the development of child substance use and other psychopathology from preschool to the start of adulthood. Journal of Studies on Alcohol and Drugs. 2009;70:489–498. doi: 10.15288/jsad.2009.70.489. [DOI] [PMC free article] [PubMed] [Google Scholar]
- Caetano R, Clark CL, Tam T. Alcohol consumption among racial/ethnic minorities. Alcohol Health and Research World. 1998;22:233–238. [PMC free article] [PubMed] [Google Scholar]
- Dent C, Grube JW, Biglan A. Community level alcohol availability and enforcement of possession laws as predictors of youth drinking. Preventive Medicine. 2005:355–362. doi: 10.1016/j.ypmed.2004.06.014. [DOI] [PMC free article] [PubMed] [Google Scholar]
- Dickens DD, Dieterich SE, Henry K, Beauvais F. School bonding as a moderator of the effect of peer influences on alcohol use among American Indian Adolescents. Journal of Studies on Alcohol and Drugs. 2012;73:597–603. doi: 10.15288/jsad.2012.73.597. [DOI] [PMC free article] [PubMed] [Google Scholar]
- Duncan SC, Duncan TE, Strycker LA. A multilevel analysis of neighborhood context and youth alcohol and drug problems. Prevention Science. 2002;3:125–134. doi: 10.1023/a:1015483317310. [DOI] [PubMed] [Google Scholar]
- Friese B, Grube JW. Differences in drinking behavior and access to alcohol between Native American and White adolescents. Journal of Drug Education. 2008;38:271–282. doi: 10.2190/DE.38.3.e. [DOI] [PMC free article] [PubMed] [Google Scholar]
- Friese B, Grube JW, Seninger S, Paschall MJ, Moore RS. Drinking behavior and sources of alcohol: differences between Native American and White youths. Journal of Studies on Alcohol and Drugs. 2011;72:53–60. doi: 10.15288/jsad.2011.72.53. [DOI] [PMC free article] [PubMed] [Google Scholar]
- Heavyrunner-Rioux AR, Hollist DR. Community, family, and peer influences on alcohol, marijuana, and illicit drug use among a sample of Native American youth: An analysis of predictive factors. Journal of Ethnicity in Substance Use. 2010;9:260–283. doi: 10.1080/15332640.2010.522893. [DOI] [PubMed] [Google Scholar]
- Kim I, Zane NWS, Hong S. Protective factors against substance use among Asian American youth: A test of the peer cluster theory. Journal of Community Psychology. 2002;30:565–584. [Google Scholar]
- Kitsantas A, Ware HW, Marines-Arias R. Students’ perception of school safety: effects by community, school environment, and substance abuse variables. Journal of Early Adolescence. 2004;24:412–430. [Google Scholar]
- Kubrin CE, Weitzer R. New directions in social disorganization theory. Journal of Research in Crime and Delinquency. 2003;40:374–402. [Google Scholar]
- Lipperman-Kreda S, Paschall MJ, Grube JW. Perceived local enforcement, personal beliefs, and underage drinking: an assessment of moderating and main effects. Journal of Studies on Alcohol. 2009;70:64–69. doi: 10.15288/jsad.2009.70.64. [DOI] [PMC free article] [PubMed] [Google Scholar]
- MacKinnon DP, Warsi G, Dwyer JH. A simulation study of mediated effect measures. Behavior Research and Therapy. 1995;30:41–62. doi: 10.1207/s15327906mbr3001_3. [DOI] [PMC free article] [PubMed] [Google Scholar]
- Markus HR, Kitayama S. Culture and the Self: Implications for cognition, emotion and motivation. Psychological Review. 1991;98:224–253. [Google Scholar]
- McLellan L, Rissel C, Donnelly N, Bauman A. Health behavior and the school environment in New South Wales, Australia. Social Science and Medicine. 1999;49:611–619. doi: 10.1016/s0277-9536(99)00136-7. [DOI] [PubMed] [Google Scholar]
- McNeely C, Falci C. School connectedness and the transition into and out of health-risk behavior among adolescents: a comparison of social belonging and teacher support. Journal of School Health. 2004;74:284–292. doi: 10.1111/j.1746-1561.2004.tb08285.x. [DOI] [PubMed] [Google Scholar]
- Montana Department of Public Health and Human Services. Montana prevention needs assessment student survey: State report 2010. 2010 Retrieved from: http://prevention.mt.gov/pna/2010/01.%20State%20Data/Montana%202010%20State%20Report.pdf.
- Montana Department of Public Health and Human Services, Chemical Dependency Bureau. Montana Prevention Needs Assessment Survey Results for 2008. 2008 Retrieved from http://prevention.mt.gov/pna/2008/10.%20Native%20American%20Montana%20Students/Native%20American%20Students%20-%20On-Reservation%20and%20Off-Reservation%20Profile%20Report.pdf.
- Montana Office of Public Instruction. Montana Indians: Their history and location. 2009 Retrieved from http://www.opi.mt.gov/pdf/IndianEd/Resources/MTIndiansHistorylocation.pdf.
- Mujahid MS, Diez Roux AV, Morenoff JD, Raghunathan T. Assessing the measurement properties of neighborhood scales: From psychometrics to econometrics. American Journal of Epidemiology. 2007;165:858–867. doi: 10.1093/aje/kwm040. [DOI] [PubMed] [Google Scholar]
- Naimi TS, Cobb N, Boyd D, Jarman DW, Brewer R, Nelson DE, et al. Alcohol-Attributable Deaths and Years of Potential Life Lost Among American Indians and Alaska Natives — United States, 2001–2005. Morbidity and Mortality Weekly Report. 2008;57:938–941. [PubMed] [Google Scholar]
- Nalls AM, Mullis RL, Mullis AK. American Indian youths’ perceptions of their environment and their reports of depressive symptoms and alcohol/marijuana use. Adolescence. 2009;44:965–978. [PubMed] [Google Scholar]
- Napoli M, Marsiglia FF, Kulis S. Sense of belonging in school as protective factor against drug abuse among Native American urban adolescents. Journal of Social Work Practice in the Addictions. 2003;3:25–41. doi: 10.1300/J160v03n02_03. [DOI] [PMC free article] [PubMed] [Google Scholar]
- National Center for Education Statistics. Public high school graduates and dropouts by race/ethnicity and state or jurisdiction: 2006–07. 2007 Retrieved May 11, 2010 from http://nces.ed.gov/programs/digest/d09/tables/dt09_106.asp.
- Pan SW, Christian CW, Pearce ME, Blair AH, Jongbloed K, Zhang H, Teegee M, Thomas V, Schechter MT, Spitall PM. The Cedar Project: Impacts of policing among young Aboriginal people who use injection and non-injection drugs in British Columbia, Canada. International Journal of Drug Policy. 2013;24(5):449–459. doi: 10.1016/j.drugpo.2013.04.009. [DOI] [PubMed] [Google Scholar]
- Resnick MD, Bearman PS, Blum RW, Bauman KE, Harris M, Jones J, Tabor J, Beuhring T, Sieving RE, Shew M, Ireland M, Bearinger LH, Udry JR. Protecting adolescents from harm: findings from the National Longitudinal Study of Adolescent Health. Journal of the American Medical Association. 1997;278:823–832. doi: 10.1001/jama.278.10.823. [DOI] [PubMed] [Google Scholar]
- Robers S, Kemp J, Truman J. Indicators of School Crime and Safety: 2012 (NCES 2013-036/NCJ 241446) National Center for Education Statistics, U.S Department of Education, and Bureau of Justice Statistics, Office of Justice Programs, U.S. Department of Justice; Washington, DC: 2013. [Google Scholar]
- Sampson RJ, Raudenbush SW, Earls F. Neighborhoods and violent crime: a multi-level study of collective efficacy. Science. 1997;277:918–924. doi: 10.1126/science.277.5328.918. [DOI] [PubMed] [Google Scholar]
- Spear S, Longshore D, McCaffrey D, Ellickson P. Prevalence of substance use among White and American Indian young adolescents in a Northern Plains State. Journal of Psychoactive Drugs. 2005;37(1):1–6. doi: 10.1080/02791072.2005.10399743. [DOI] [PubMed] [Google Scholar]
- Szlemko WJ, Wood JW, Thurman PJ. Native Americans and Alcohol: Past, Present, and Future. Journal of General Psychology. 2006;133:435–451. doi: 10.3200/GENP.133.4.435-451. [DOI] [PubMed] [Google Scholar]
- Tobler AL, Komro KA, Maldonado-Molina MM. Relationship between neighborhood context, family management practices and alcohol use among urban, multi-ethnic, young adolescents. Prevention Science. 2009;10:313–324. doi: 10.1007/s11121-009-0133-1. [DOI] [PMC free article] [PubMed] [Google Scholar]
- Treno AJ, Ponicki WR, Remer LG, Gruenewald PJ. Alcohol outlets, youth drinking, and self-reported ease of access to alcohol: A constraints and opportunities approach. Alcoholism: Clinical and Experimental Research. 2008;32:1372–1379. doi: 10.1111/j.1530-0277.2008.00708.x. [DOI] [PMC free article] [PubMed] [Google Scholar]
- Urban Indian Health Institute, Seattle Indian Health Board. Community Health Profile: Eastern Montana Urban Indian Health Organization Service Areas. Seattle, WA: Urban Indian Health Institute; 2011. Retrieved from http://www.uihi.org/wp-content/uploads/2012/01/CHP_Eastern-MT_Final.pdf. [Google Scholar]
- Winstanley EL, Steinwachs DM, Ensminger ME, Latkin CA, Stitzer ML, Olsen Y. The association of self-reported neighborhood disorganization and social capital with adolescent alcohol and drug use, dependence, and access to treatment. Drug and Alcohol Dependence. 2008;92:173–82. doi: 10.1016/j.drugalcdep.2007.07.012. [DOI] [PMC free article] [PubMed] [Google Scholar]
- Voison DR, Salazar LF, Crosby R, Diclemented RJ, Yarber WL, Staples-Horne M. Teacher connectedness and health-related outcomes among detained adolescents. Journal of Adolescent Health. 2005;37:337.e17–337.e23. doi: 10.1016/j.jadohealth.2004.11.137. [DOI] [PubMed] [Google Scholar]
- Yabiku ST, Rayle AD, Okamoto SK, Marsiglia FF, Kulis S. The effect of neighborhood context on the drug use of American Indian youth of the Southwest. Journal of Ethnicity in Substance Abuse. 2007;62:181–204. doi: 10.1300/j233v06n02_11. [DOI] [PMC free article] [PubMed] [Google Scholar]
- Youngblade LM, Theokas C, Schulenberg J, Curry L, Huang IC, Novak M. Risk and promotive factors in families, schools, and communities: a contextual model of positive youth development in adolescence. Pediatrics. 2007;119:S47–53. doi: 10.1542/peds.2006-2089H. [DOI] [PubMed] [Google Scholar]