

Abstract
Background & Aims
Published estimates for the rate of progression from Barrett’s esophagus (BE) to esophageal adenocarcinoma (EAC) vary. We used simulation modeling to reconcile published data and more accurately estimate the incidence of EAC among people with BE.
Methods
We calibrated the ERASMUS/UW model for EAC to match the 0.18% annual rate of progression from population-based studies. This model was then used to simulate the design of prospective studies, introducing more endoscopic surveillance. We used the model to predict rates of progression for both types of studies and for different periods of follow up, and compared the predicted rates with published data.
Results
For the first 5 y of follow up, the model reproduced the 0.19% average annual rate of progression observed in population-based studies; the same disease model predicted a 0.36% annual rate of progression in studies with a prospective design (0.41% reported in published articles). After 20 y these rates each increased to 0.63%–0.65% annually, corresponding with a 9.1%–9.5% cumulative cancer incidence. Between these periods, the difference between the progression rates of both study designs decreased from 91% to 5%.
Conclusions
In the first 5 y after diagnosis, the rate of progression from BE to EAC is likely to more closely approximate the lower estimates reported from population-based studies than the higher estimates reported from prospective studies, in which EAC is detected by surveillance. Clinicians should use this information to explain to patients their short-term and long-term risk if no action is taken, and then discuss the risks and benefits of surveillance.
Keywords: Esophageal cancer, Population-based modeling, microsimulation, early detection
Introduction
In the last four decades, esophageal adenocarcinoma (EAC) has become an important cancer in terms of incidence and mortality due to a spectacular rise in incidence in the western world. The discrepancy between EAC incidence rates by gender is large: the incidence of EAC in men is at least 7-fold that in women and this difference is consistently seen in all western countries. Barrett’s esophagus (BE) is the precursor of EAC and its estimated prevalence in the total population ranges between 1.6%–6.8%, depending on study.1
Given its relevance for clinical management of BE, many have studied the progression rate from BE to EAC. Usually, one calculated the annual progression rate by dividing the number of EAC cases observed in a specified BE cohort by the number of person-years of follow up in the specified cohort. The resulting estimates for the annual progression rate from BE to EAC vary widely in literature within a range of [0.07%, 3.6%], whereas the annual progression rates from BE to HGD/EAC are 1.5–2.5 fold higher.2–4 Apart from selection bias, publication bias, study size, and cohort characteristics, which all contribute to the difficulty of comparing these estimates, there are important differences in study design. Earlier, a plausible annual progression was estimated at between 0.41% and 0.5% based on meta-analyses that were restricted to prospective studies.2, 4, 5 However, several large recently published population-based studies suggest that the progression rate is actually much lower (~0.18%).6–8 The length of follow up in both designs is regularly between five to seven years.
The uncertainty in the progression rate from BE to EAC is a major driver of the controversy in the management of Barrett’s esophagus because the (cost-) effectiveness of surveillance and treatment crucially depends on the incidence and progression rate of cancer in BE.9 Identifying the true risk of progression to cancer would greatly improve the decision making process. In this study, we hypothesize that the difference in estimates of progression rates between prospective and population-based studies could be explained by the practice of endoscopic surveillance performed in prospective studies, resulting in earlier detection of preclinical cancers. The aim of this study was to provide a more accurate estimate for the clinical cancer incidence in BE by reconciling published data.
Material and Methods
This section includes the description of the methods used in our study. We firstly describe the features of the microsimulation model after which we discuss which characteristics are applied to the model in order to reproduce the population-based study design. Next, we discuss the assumptions for model calibration using the characteristics of the population-based design which is followed by a description of the model simulations including the characteristics of the simulated population and the differences between the two designs. We conclude with an overview of the outcomes and sensitivity analysis.
The ERASMUS/UW-Esophageal adenocarcinoma (EAC) model
The ERASMUS/UW-EAC model was developed as part of a collaboration between the Erasmus Medical Center (Rotterdam, the Netherlands) and the University of Washington (Seattle, U.S.A.). The model was previously used in a comparative modeling study to explore the future trends of EAC incidence and in a study to evaluate the influence of the uncertainty in progression rates on hypothetical screening and treatment interventions.9, 10
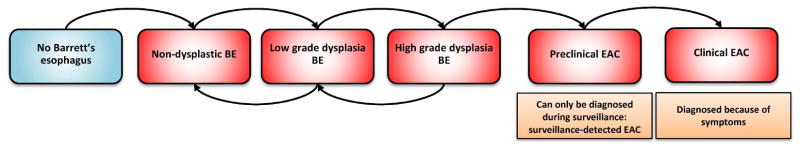
A more detailed description of the model with the quantification of inputs and calibration targets is given in the appendix. In brief, the model simulates the life histories of a large population of individuals from birth to death. Part of the population has symptomatic gastro-esophageal reflux disease (GERD). People may develop non-dysplastic (ND) BE (disease onset) depending on age and the presence of GERD symptoms (6-times increased risk compared to no GERD symptoms). Once BE has developed, low-grade dysplasia (LGD) may develop in BE which in time may progress to high-grade dysplasia (HGD). Furthermore, there is also a probability that HGD will regress towards LGD, and LGD towards ND BE. In HGD malignant cells can arise, transforming to localized EAC that can progress sequentially into regional and distant EAC. In every preclinical cancer stage there is a probability of the cancer being diagnosed due to the development of symptoms versus remaining asymptomatic and progressing undiagnosed into the next cancer stage (figure 1). Once a cancer is diagnosed, individuals may die from it, depending on its stage and age. As a competing risk, persons may die of other causes at any moment during their lifetime.
Figure 1.
Graphical representation of the Erasmus/UW Model
Reproducing population-based design
We adjusted the model in order to reproduce the characteristics of the population-based study design by implementing realistic surveillance and diagnostic inaccuracy as observed in population-based studies. BE with or without LGD was detected at index endoscopy. The occurrence of subsequent surveillance was based on two population-based studies reporting percent of the study population having surveillance6, 8 and the surveillance intervals as observed in Jonge et al.8 In this study 38% of the patients with only BE and 52% of those with also LGD received surveillance, with an initial surveillance interval of 2.0 and 1.4 years for ND and LGD patients respectively. These surveillance intervals are different than the current recommended endoscopic surveillance intervals (which are 3.0 (ND) and 1.0 (LGD) years) but are more consistent with the interval recommendations before 2011. Because there were no adherence data on repeat surveillance endoscopy from population-based studies, we used El Serag et al, reporting that 54% of the cohort follows recommended surveillance practice while 46% of the cohort adhered only to the first surveillance endoscopy. 11 In line with this study we assumed that after each endoscopy the adherence to the next endoscopy will diminish with similar rates. For all surveillance intervals after the initial interval, we used the recommended intervals for all following endoscopies (every 3 year, annually and every 3 months for respectively ND, LGD and HGD patients).
The assumed diagnostic inaccuracy for BE specimens was based on data gathered from literature (figure 2).12 In practice some degree of misdiagnosis of the dysplastic grade is very common because interpretation and grading of biopsies specimens is subjective. In addition there is sampling error, defined as dysplastic or malignant tissue that is missed when obtaining the biopsy.
Figure 2.
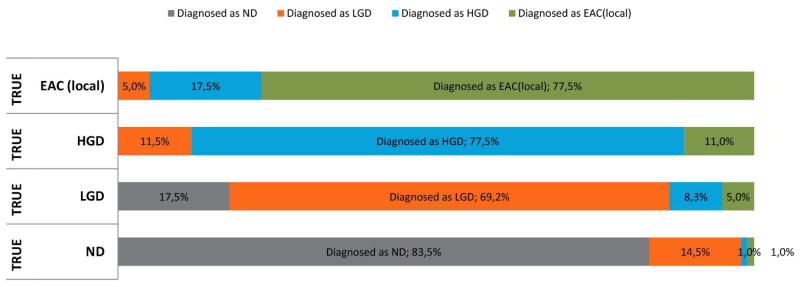
Diagnostic inaccuracy of endoscopic surveillance in the main analysis of our model
Calibration of the model
The model was calibrated to the 2000–2009 incidence data from SEER, the proportion of LGD and HGD in the BE population and the average sojourn time of preclinical (asymptomatic) EAC before becoming clinical (symptomatic) EAC. The model was calibrated to fit the BE to EAC weighted annual progression rate for males in recently published population based studies (~0.18% annually). 6–8
Population simulated
Since the average age of diagnosis of BE is 60–65 in most studies we have chosen to consider individuals within our simulated cohort with BE at age 65 and follow them until EAC incidence, death by other causes or end of follow up. Furthermore, because most studies excluded HGD at baseline in their reports of surveillance and cancer incidence, we have included only diagnosed non-dysplastic (ND) and low-grade dysplastic (LGD) BE. However, this includes HGD and EAC patients underdiagnosed as ND and LGD.
Simulation of cohort and design
We subsequently used the calibrated model to simulate the population according to three scenarios: 1) without surveillance, 2) population-based study design and 3) prospective cohort design. The only difference between the three scenarios is the intensity of surveillance applied after the initial endoscopy. In the scenario without surveillance, none of the included BE patients received any surveillance. For the population-based study design, as for the calibration, 38% of the BE ND patients and 52% of LGD patients received initial surveillance, while in the prospective design 100% of BE ND and LGD patients received initial surveillance. Repeat surveillance and diagnostic inaccuracy are assumed to be similar in the two designs and as stated above (see Reproducing population-based design).
Outcomes
We evaluated two primary outcomes: annual progression rate to EAC diagnosis and annual progression rate to HGD detection or EAC diagnosis combined. In line with published studies we removed the cancers that were detected within the first six months of follow up. We distinguished clinical EAC and surveillance-detected EAC. We define clinical EAC as a cancer being diagnosed by symptoms, whereas surveillance-detected EAC is a cancer diagnosed during surveillance endoscopy.
In the first outcome (EAC cases only), when HGD is detected at surveillance, there is no treatment but there is an increase in frequency of the surveillance by shortening the interval to 3 months (individual is still considered in follow up). Only if the patient develops EAC he/she is considered an endpoint and included as a case in the progression rate calculation. For the second outcome (HGD and EAC cases combined), when HGD is detected by surveillance, this is included as a case and considered as an endpoint (individual no longer considered in the follow up), corresponding with the situation where HGD is treated. The annual progression rate was defined by the number of diagnosed cases divided by the number of person-years in follow up. We included only the true-positive diagnosed EAC in the final outcomes, assuming that overdiagnosed or false positive EAC cases would have been recognized as such during the further staging process and therefore were also not counted in the studies. We calculated the annual progression rate without any influence of surveillance (clinical progression rate). Additionally, for both designs and varying lengths of follow up the annual progression rate and the cumulative cancer incidence were calculated. The key outcome of our study is the difference in percentages between the predicted rates of both study designs for varying follow up lengths. This difference was calculated by dividing the difference in predicted rates between the two designs by the predicted rate of the population-based design.
Sensitivity analysis
In addition to the progression rate throughout the disease to EAC, which has been addressed to by calibration as the central issue to our analysis, we addressed in the sensitivity analyses other uncertain assumptions that would influence EAC incidence during follow up: 1) the intensity of surveillance during follow up, 2) overdiagnosis of BE at baseline in the population based design, and 3) the duration of surveillance over time.
Perfect surveillance scenario
Since the frequency of surveillance incurs large uncertainty, we explored the impact of the most extreme difference in surveillance between the two study types. In this scenario we assumed no surveillance (0%) for the population-based study design, and 100% surveillance (every 3 year, annually and every 3 months for respectively ND, LGD and HGD patients) for all individuals over the total follow up period for the prospective design.
False-positive BE scenario
We have looked at the validity of BE diagnosis within population-based studies. For population-based studies with large registries one may raise the question how often a coded BE registration is correctly defined. We have alternatively assumed that within the population-based design only 61.9% of the registered BE cases has true BE in accordance with the findings of Corley et al.13, and that the other 38.1% are false-positive diagnosed individuals which should not contribute to the denominator when calculating the progression rate.
Halting surveillance scenario
We looked at the impact of diminishing surveillance over time. Because of comorbidity, there is a higher probability that patients may not be fit for endoscopy at older age. In practice it is therefore not uncommon that surveillance is halted for older patients. In this sensitivity analysis, we stopped offering surveillance after a 10 year period, at age 75.
Results
The calibration to the population-based study, including realistic surveillance, resulted in an annual progression rate of 0.19% for BE (ND+LGD) to EAC with a 5 year follow up. Without surveillance, the annual progression rate to clinical EAC (clinical progression rate) would only have been 0.07%. The same disease model predicted an annual progression rate to EAC for the prospective design of 0.36% after a five year follow up, 91% higher than in the population based design (figure 3). These estimates were close to the published estimates of 0.41% annual progression rate with a 128% difference between designs. Figure 4 shows that the number of EAC diagnosed by surveillance declined over time in both designs, due to the assumed diminishing number of surveillance endoscopies in both designs. Whereas in the first five years of follow up the proportion of surveillance detected cancers was 82% and 98% of the total cancer diagnosis for the population-based and prospective design respectively, this proportion declined to 26% and 62% for years 15–20 of follow up. The earlier diagnosis of cancer caused by surveillance is mainly relevant on the short term. After 20 years the model predicted that 9.1%–9.5% of the BE (ND+LGD) population would have developed EAC, with a difference between the designs of only 5% (table 1).
Figure 3.

Cancer incidence rates for different lengths of follow up in the realistic scenario: A) average annual progression rates toward EAC and B) cumulative cancer incidence towards EAC
Figure 4.

A) Cumulative cancer incidence rates per 1000 BE patients for 20 years of follow up in the population-based design without any surveillance (perfect surveillance scenario), in the population-based and prospective design for the realistic scenario. A) Cancer incidence rates per 1000 BE patients for 20 years of follow up in the population-based design without any surveillance (perfect surveillance scenario), in the population-based and prospective design for the realistic scenario.
Table 1.
Simulation results of the population-based design and prospective design for the realistic scenario. The table shows the average annual progression rate and the cumulative cancer incidence rates for both i) EAC diagnosis and ii) HGD and EAC diagnosis for follow up lengths of 5,10,15 and 20 years. In addition, the average number of person-years is shown for each scenario. BE: Barrett’s esophagus; EAC: Esophageal adenocarcinoma
| Annual progression rate | ||||||
|---|---|---|---|---|---|---|
|
| ||||||
| EAC | HGD and EAC | |||||
|
| ||||||
| Follow up length | Population-based | Prospective | Difference | Population-based | Prospective | Difference |
| 5 year follow up | 0.19% | 0.36% | 92% | 0.27% | 0.56% | 110% |
| 10 year follow up | 0.43% | 0.53% | 22% | 0.48% | 0.64% | 34% |
| 15 year follow up | 0.57% | 0.62% | 9% | 0.61% | 0.72% | 18% |
| 20 year follow up | 0.63% | 0.65% | 5% | 0.66% | 0.74% | 13% |
|
| ||||||
| Cumulative progression rate | ||||||
|
| ||||||
| EAC | HGD and EAC | |||||
|
| ||||||
| Population-based | Prospective | Population-based | Prospective | Difference | ||
| 5 year follow up | 0.9% | 1.8% | 91% | 1.3% | 2.8% | 108% |
| 10 year follow up | 4.0% | 4.8% | 21% | 4.4% | 5.8% | 33% |
| 15 year follow up | 7.0% | 7.6% | 8% | 7.5% | 8.7% | 17% |
| 20 year follow up | 9.1% | 9.5% | 4% | 9.6% | 10.6% | 11% |
|
| ||||||
| Average number of person-years per BE patient | ||||||
|
| ||||||
| EAC | HGD and EAC | |||||
|
| ||||||
| Population-based | Prospective | Population-based | Prospective | |||
| 5 year follow up | 5.0 | 5.0 | 5.0 | 4.9 | ||
| 10 year follow up | 9.2 | 9.1 | 9.0 | 8.6 | ||
| 15 year follow up | 12.4 | 12.3 | 12.0 | 11.3 | ||
| 20 year follow up | 14.6 | 14.5 | 14.0 | 13.0 | ||
A similar pattern was seen when evaluating the progression rate to HGD and EAC combined. Simulated progression rates were approximately 1.5 times higher than for EAC alone and the difference between the population-based and prospective design decreased from 110% (0.27% versus 0.56%) after a five year follow up to 13% (0.66% versus 0.74%) after 20 years. After 20 years, the model predicted a cumulative incidence of 9.6%–10.6% to HGD and EAC (figure 5).
Figure 5.

High-grade dysplasia and cancer incidence rates for different lengths of follow up in the realistic scenario: A) average annual progression rates toward HGD and EAC and B) cumulative cancer incidence towards HGD and EAC
Sensitivity analysis
Perfect surveillance scenario
Assuming no surveillance in the population-based study design and 100% surveillance in the prospective cohort design, resulted in considerably larger differences between the 5-year average annual progression rates (0.07% and 0.50% in the population-based and prospective design respectively, see figure 6a). This shows how sensitive the simulated progression rates are to intensity of surveillance. Without surveillance, 8.9% of the BE patients will develop EAC within 20 years. An additional 1.1% of the patients will be detected with EAC because of surveillance (figure 6b).
Figure 6.

Cancer incidence rates for different lengths of follow up in the sensitivity analysis:
Perfect surveillance scenario A) average annual progression rates toward EAC and B) cumulative cancer incidence towards EAC
False-positive BE scenario C) average annual progression rates toward EAC and D) cumulative cancer incidence towards EAC
Halting surveillance scenario E) average annual progression rates toward EAC and F) cumulative cancer incidence towards EAC
False-positive BE scenario
If we assumed that only 61.9% of the registered BE cases had true BE in the population-based design, and that the other 38.1% are false-positive diagnosed individuals, the progression rates in the population-based design increased with 30%. The observed progression rate of 0.18% actually only occurs in the 61.9% of the population with BE. In other words, the progression rate in BE patients is in reality 0.24% after 5 years of follow up (figure 6c). Calibrating the model to this rate would result in a clinical progression rate of 0.10% annually without surveillance. Our results only show the effect of the false-positive BE on the population-based studies, which means that the results for the prospective cohort design are identical to the base case scenario. The inclusion of false-positive BE patients in the population-based studies has a large influence on the estimated progression rate.
Halting surveillance scenario
Halting surveillance after a 10-year period of follow-up, only affects long term outcome since surveillance assumptions are identical to the base case for the first 10 years. After 20 years of follow up, the cancer incidence was 8.7% and 8.9% in the population-based and the prospective study design. Compared to our main analysis (with a cancer incidence of 9.1%–9.5% after 20 years) fewer cancers were detected in the long-term. Halting surveillance could therefore be a favorable option since the cancers that are not diagnosed by screening because of the halted surveillance are also not diagnosed because of symptoms. Overdiagnosis because of early surveillance-detected EAC is minimized when halting surveillance. (figure 6f)
Discussion
In a 60-year old with BE (ND or LGD) over a 5 year follow-up period we calculated a clinical progression rate to EAC of 0.07%/year. This annual rate increased to 0.37% when evaluated a 10 year follow up. The 0.19% and 0.36% annual progression rates after 5 years estimated in population-based and prospective designs, respectively, converged to 9.1% and 9.5% cumulative cancer incidence after 20 years. The relative differences between progression rates of the two designs decreased from 91% and 21% after 5 and 10 years, to 9% and eventually 5% after 15 and 20 years of follow up. Results including HGD show that in the long run at least 0.5% of the population-based cohort and 1.1% of the prospective cohort will be over diagnosed with HGD that would not have progressed to cancer even if not detected and treated. The differences between progression rates of the two designs diminish at a slower rate when evaluating both HGD and EAC instead of only EAC.
We believe this is the first study in which the difference between observed progression rates is explained using population-based modeling. Our results suggest that the gap between the published progression rates from population based studies and prospective studies can be largely explained by differences in study design, more specifically by the differences in the surveillance intensity. Performing endoscopic surveillance in individuals with BE leads to earlier detection of cancers and thus to a higher observed cumulative EAC incidence, especially if follow up time is not very long (e.g., 20 years). In the situation without surveillance, a proportion of these cancers (those not overdiagnosed) would have developed symptoms that lead to clinical cancer diagnosis. However, given closure of the study e.g. after five years, some of these cancers would not yet have been observed without surveillance. In our simulations, significant differences between the study designs mainly impacted the progression rates when the follow up length is less than 10 years, which is mainly explained by our assumption of diminishing surveillance over time. Thus, the true average annual incidence of clinically apparent EAC in BE over the long-term is approximately 0.64%/year, but much lower when observed only over 5 years (approximately 0.2%/year). Much of the later cancers may represent overdiagnosis of pseudo-disease as the risk of competing causes of death increase as the patient ages making the diagnosis of the cancer at those later time points less relevant to all-cause mortality.
Our study is limited by uncertainties. We have assumed the same surveillance intervals and diagnostic inaccuracy for EAC in those undergoing surveillance for both designs. However, the diagnostic accuracy may be higher in prospective studies because these trials are performed by more expert endoscopists using better-established biopsy and pathologist grading protocols than in an average population-wide practice. Next, the more exact frequency and intensity of surveillance was uncertain in both types of studies. We supported our base case assumptions using the few studies that quantitatively described surveillance. In order to evaluate the impact of our surveillance assumptions we simulated varying scenarios in the sensitivity analysis in which surveillance is altered. These analyses showed that when assuming perfect adherence to the protocol for all study participants in the prospective design, the 5-years progression rate was 0.50% annually instead of 0.36% with the base case less perfect surveillance compliance assumptions. This reflects the influence of the surveillance protocol on the predicted progression rate, indicating that the published progression rates for prospective studies are highly influenced by the intensity of the surveillance protocol on short term. Thirdly, we did not account for HGD treatment when calibrating the model on the BE to EAC progression rate. The reason is that the studies we used for the calibration were performed prior to the uptake of endoscopic therapy for dysplastic BE. If published progression estimates in prospective cohort studies show persistently lower progression rates than previously assumed (~0.50%), we aim to research the effect of this treatment intervention in future. Finally, there were only a limited number of population-based studies available to provide us with information concerning the progression rate, and each study is subject to their own limitations. These limitations magnify the uncertainty about the size of the difference between the study designs.
The published estimates for annual progression rates for 5 years of follow-up differed 128% between population-based and prospective studies (0.18% and 0.41% respectively). The model-predicted progression rates compared well with regards to the absolute level and resulted in a difference of 91%. Hence, more than two-thirds of the difference between published estimates for the short-term progression rate to EAC can be explained by differences in study design. The remaining unexplained difference could easily be caused by uncertainties in surveillance intensity and diagnostic accuracy assumptions. In particular, the impact of uncertainties concerning surveillance is large as shown in our sensitivity analysis: the most extreme estimated gap between designs by varying the surveillance intensity (0.07% versus 0.50% for no surveillance versus complete surveillance for all) was considerably larger than the observed gap between designs (0.18% and 0.41%).
Previous research examined whether publication bias, the selective reporting of studies featuring positive or extreme results, may have caused the wide range of progression rate published, and in particular resulted in overestimation of cancer risk in literature.4 The researchers found that reported cancer risk was strongly negatively associated with the size of the study, which could be explained by publication bias. Our study shows that this association may not be caused so much by study size but rather by study design, as large studies are more likely to be population based and characterized by low endoscopic surveillance.
Our findings have several implications for practice. First of all when the progression rate is inferred from a study, the surveillance practiced in the study should be carefully accounted for as well as the duration of follow-up. For example, calibrating a model to the rates observed in the cohort studies without including surveillance will overestimate progression rates and lead to cost-effectiveness analyses that support too intensive surveillance recommendations. Modelers must make the distinction between the progression rate to clinical cancer in the situation without surveillance, and progression rate with surveillance, including surveillance detected pre-clinical cancers. For (calibration to) the former, it is recommended that models use the lower end of the published estimates, approximating the clinical progression rate in order to prevent overestimation of cancer incidence without surveillance and thereby provide more valid cost-effectiveness calculations of surveillance and treatment. Next, especially towards patients but also between professionals, the so called clinical progression rate is the only definition which is unambiguous and relevant for risk interpretation: it is not influenced by surveillance. Even the direction of this influence can vary, depending on the intensiveness of the surveillance, combined with the aggressiveness of associated pre-cancer treatment (eradication of dysplasia could decrease the observed EAC progression rate) and the frequency of overdiagnosis (detection of clinically insignificant disease would increase observed progression rates). The clinical progression rate is also simple: it only includes the clinically diagnosed cancers that will develop in a situation without interventions before clinical symptoms develop. The clinical progression rate is best approximated by the published population-based studies.
Although population-based studies best approximate the true clinical progression rate, this does not mean that there is no use for the rates from prospective cohort studies. These studies can provide us with valuable information on the impact of surveillance practice on cancer incidence that clinicians can use to inform their patients on the risks (cancer diagnosis at earlier age with the possibility of overdiagnosis) and benefits (less invasive treatment and improvement of prognosis) of surveillance. Prospective cohort studies offer the possibility to estimate duration and significance of screen detectable disease and the sensitivity of surveillance for these precursors. This typically could be done by modeling with simultaneous calibration to studies incorporating infrequent and intensive surveillance. To this end, a good description of the interventions and of surveillance- versus symptom-detected cancers by length of follow-up in empirical studies is mandatory.
In conclusion, the published differences between the lower progression rates reported from population-based studies and the higher progression rates observed in prospective studies can be explained by detection bias from endoscopic surveillance in the prospective studies. For a short time frame the clinical progression rate from BE to EAC, reflecting the individual risk, is likely to be closer to the estimations in the population-based studies than prospective studies because less surveillance was performed in the former studies. Clinicians informing their BE patients about their cancer risk can best use this clinical progression rate, which is not influenced by surveillance detected cancers.
Acknowledgments
Grant support: U01 CA152926
We would like to thank the Cancer Intervention and Surveillance Modeling Network (CISNET).
Abbreviations
- BE
Barrett’s Esophagus
- ND
No dysplasia
- LGD
Low grade dysplasia
- HGD
high grade dysplasia
- EAC
Esophageal adenocarcinoma
APPENDIX
The Erasmus/UW model
MODEL OVERVIEW
The Erasmus/UW model (before, UW/MISCAN-EAC model) is a semi-Markov microsimulation model for esophageal adenocarcinoma (EAC). The population is simulated individual by individual, and each person can evolve through discrete disease states. However, instead of modeling yearly transitions with associated transition probabilities, the Erasmus/UW model generates durations in states. With the assumption of exponential distribution of the duration in each state, this way of simulating leads to similar results as a Markov model with yearly transition probabilities. The advantage of the MISCAN approach is that durations in a certain state need not necessarily be a discrete value but can be continuous. MISCAN uses the Monte Carlo method to simulate all events in the program. Possible events are birth and death of a person, Barrett’s incidence, and transitions from one state of disease to another. The basic structure of the Erasmus/UW model is separated in three main parts:
demography part
natural history part
screening part
These parts are not physically separated in the program, but it is useful to consider them separately.
Demography Part
The individual life histories are simulated in the demography part of the model. For each person, a birth date and death date is simulated for other causes than EAC. The distribution of births and deaths can be adjusted to represent the simulated population.
Natural history part
The natural history part of Erasmus/UW simulates the development of EAC in the population. The current models used in this paper do not include an increasing secular trend for the EAC increasing incidence over time. Because the focus of this paper is on effectiveness and efficiency, we decided that it could be best compared with the simulation of a cohort excluding secular trend effects before and after 2000–2009.
We assume that EAC develops through precursor Barrett’s Esophagus (BE). For each individual in the simulated population a personal risk index is generated. A minority of the population has symptomatic gastro-esophageal reflux disease (GERD), giving them a higher risk of developing BE during their lifetime. The development of BE is generated according to this personal risk index and an age specific incidence of onset. The sequence from the onset of BE to EAC diagnosis is governed by sojourn times between the different states. BE starts in a state with no dysplasia (ND), thereafter dysplasia can develop. Two states of dysplasia are defined: Low Grade (LGD) and High Grade dysplasia (HGD). There is a possibility that regression from HGD to LGD and from LGD to ND occurs. The probability to regress or progress is dependent on a transition rate matrix, and is therefore also influenced by the sojourn time. The probability of regression, progression and the according sojourn times can be calculated as follow:
From HGD malignant cells can arise that can transform from this stage to preclinical localized EAC, which can sequentially progress into Regional and Distant preclinical EAC. In each of these three states, there is a probability of the cancer being diagnosed. The sojourn times between these described states are exponentially distributed, and in some states (BE ND, BE LGD and BE HGD) age dependent. Because most sojourn times extend beyond the demography-generated age of death from other causes, only a small proportion of the population develop EAC from BE. The survival after clinical diagnosis depends on the cancer stage, and the year of diagnosis (period effect reflecting survival improvement over time). A graphical representation is shown in appendix Figure 1.
Screening part
The development of EAC can be interrupted by screening. Screening can detect BE, the dysplasia states and preclinical cancers. BE and dysplasia can be removed using treatment. Usually the cancers will be found in an earlier stage than with clinical diagnosis. In this way screening reduces EAC incidence or EAC death.
Integration of the three model components
For each individual, the demography part of the model simulates a time of birth and a time of death of other causes than EAC, creating a life history without EAC. Subsequently the onset of BE is simulated for that individual. For most individuals no dysplasia is generated. In the case of progressive BE, dysplasia may develop and HGD transforms into a malignant carcinoma, causing symptoms and eventually resulting in death from EAC. When a person dies from EAC before he dies from other causes, his death age is adjusted accordingly.
After the life history of a person is adjusted for EAC, the history can also be adjusted for the effects of screening. During screening BE with or without dysplasia is removed by a hypothetical treatment. This results in a combined life history for EAC in the presence of screening. BE is removed at the time of screening and this individual does not develop cancer because the precursor has been removed. Therefore the person dies from other causes and the effect of screening is the difference in life-years in between the simulation without screening and the simulation with screening.
MODEL QUANTIFICATION
For this analysis we developed two different models (perfect model, realistic model) varying in natural history assumptions.
DEMOGRAPHY PARAMETERS
There are two types of demography parameters: birth tables and life tables. The life tables were derived from the life tables published by the National Center for Health Statistics 1.
NATURAL HISTORY PARAMETERS
The parameters for the natural history are directly estimated from data or fit to reference data, based on expert opinion, or calibrated to fit the model. The average prevalence rate of symptomatic GERD is around 20% 2–5; therefore we have a fixed input parameter for which 20% of the total population suffers from symptomatic GERD.
The onset of BE was fitted per age group, we call this an optimized parameter. The parameter is relaxed and its final value results from the optimal calibrated model. Asymptomatic BE (no GERD symptoms) is a calibration target of the model, calibrated to be 40% of the total prevalence of BE in the model 6, 7.
The exponential scale parameter for the time from a preclinical state to clinical detection is restricted within the range of 2–9 years for each individual 8, 9. When evaluating the whole simulated population, the average time from onset of preclinical cancer to the diagnosis of clinical EAC is calibrated to be within the range of 4–5 years, which is a calibration target of the model.
Using published studies we estimated the proportion of LGD and HGD in a BE population (table A1), being 2.2% HGD 9.4% LGD, and 88.4% non-dysplastic BE, which were used as calibration targets in the models. Furthermore, the EAC incidence is calibrated to the total SEER esophageal cancer incidence rates from 2000 to 2009.
The assumption that differs between the models is the natural history parameter of the yearly progression rate from BE (ND+LGD) to EAC. The realistic model assumed 0.18% progression rate with partial surveillance and adherence with realistic diagnostic inaccuracy endoscopies. The realistic model incorporated clinical EAC and detected EAC (EAC diagnosed at surveillance endoscopy).
In the calibration process, all input assumptions are taken into account. Table A1 contains a summary of the model input, calibration values and its data sources, and the calibration results for the natural history. The BE prevalence is not specified and therefore allowed to optimize for each model, which results in varying estimations. Other optimized parameters are the exponential sojourn times and the regression probabilities.
SURVEILLANCE PARAMETERS
Realistic model calibration
We have used a one-time screening examination at age 65 in the calibration, in which every person is categorized as having BE ND or BE LGD, incorporating false-positive ND and LGD patients. 38% (52%) of the ND(LGD) diagnosed patients will go to surveillance, getting their next endoscopy after 2 (1.4) years. At each endoscopy the patient will be categorized into a dysplastic state or cancer, and can be detected. After the first surveillance endoscopy, 46% of the patients will not adhere to the next endoscopy, and will not be offered any subsequent surveillance in our model. When they develop symptomatic EAC, the patient will be diagnosed with clinical EAC. The remaining patients in the surveillance cohort will be offered surveillance every 3 years (ND), 1 year (LGD) and 3 months (HGD) until cancer detection or death. The stage-specific survival of patients with surveillance-detected cancer is assumed to be the same as the survival of patients with cancers clinically diagnosed in the same stage.
CALIBRATION PROCESS
The Erasmus/UW model is calibrated to fit several calibration targets in order to optimize the unknown natural history parameters. For all three models, the incidence of BE per 10-year age group, the sojourn times in BE ND, the transition rates of regression and progression in LGD and HGD and the sojourn times is the preclinical states have to be optimized.
During the optimization the Pearson chi-square Goodness of fit function was minimized on the basis of the number of observed and expected rates. The deviation of each of the four main calibration targets (SEER-EAC incidence rates per age group, annual progression rate from BE to EAC, proportions of dysplasia and average preclinical sojourn time) were summed to calculate the overall Goodness of fit of the model given a certain set of parameters. The search for new parameters was performed following the Nelder-Mead simplex method.
The regression and progression transition probabilities are highly correlated with the progression rate from BE towards EAC, which hampers the ability to identify these parameters. Although there are a large number of feasible parameters solutions, there is one optimal parameter solution resulting in the best fit which can be found in the calibration process 10.
VALIDATION OF MORTALITY RATES
The model-projected EAC mortality rates are estimated using incidence-based mortality rates by cancer stage reported in SEER. A direct comparison of model-projected EAC mortality and EAC mortality in SEER is not possible, because SEER does not distinguish mortality from EAC vs mortality from esophageal squamous cell carcinoma. Even if this distinction were possible, the appropriateness of stage migration effects of screening could not be validated with SEER data: SEER does not distinguish method of diagnosis and the estimated percentage of EAC diagnosed by screening or surveillance (7.6%) is too small test a hypothesis of stage migration.
Appendix Figure 1.

Graphical representation of the natural history of EAC in the Erasmus/UW model.
Appendix Table 1.
Main natural history assumptions and results of the Erasmus/UW perfect and realistic model
| Model parameter/value | Value in realistic model | Source | Parameter characteristic * |
|---|---|---|---|
| Symptomatic GERD prevalence | 20% of the total population | Prevalence studies 2–5 | Fixed Input |
|
| |||
| BE from symptomatic GERD population | 60% of total BE is from symptomatic GERD population | Published estimates 6, 7 | Fixed Input |
|
| |||
| BE prevalence age 60–64 | 1.4% | BE onset per 10 year age group | Optimized parameter |
|
| |||
| Percent of LGD in total BE at age 60–65 | 8.2% | Derived from published studies | Calibration target: 9.4% |
|
| |||
| Percent of HGD in total BE at age 60–65 | 1.2% | Derived from published studies | Calibration target: 2.2% |
|
| |||
| Annual progression rate from diagnosed BE (ND+LGD) to clinical EAC | 0.07% | Optimized parameter | |
| Annual progression rate from diagnosed BE (ND+LGD) to clinical and detected EAC | 0.18% | Published estimates 11–16 Definition: 5 year follow up from age 65 |
Calibration target: 0.18% in realistic model |
|
| |||
| Average sojourn time from preclinical cancer to clinical cancer, given transition | 5.0 | Published estimates 8, 9 | Calibration target: 4–5 year |
|
| |||
| Average time in BE to next transition | 6.7 | Exponential sojourn times: BE ND to LGD | Optimized parameter |
| Average time in LGD to next transition | 1.0 | LGD to BE ND or HGD | |
| Average time in HGD to next transition | 1.1 | HGD to LGD or Preclinical Localized | |
|
| |||
| Regression transition probability | Regression transition probability | Optimized parameter | |
| P(LGD to ND BE) | 88% | ||
| P(HGD to LGD) | 15% | ||
Fixed input: the parameter is defined as a fixed input of the model, Optimized parameter: the parameter is relaxed and is optimized during calibration of the model, the value is a results of the model; Calibration target: the model is calibrated to fit the fixed calibration targets as good as possible. Model is furthermore calibrated on the SEER-9 EAC incidence data from 2000–2009 for all males. GERD: Gastro-esophageal reflux disease; BE: Barrett’s esophagus; ND: No dysplasia; LGD: Low grade dysplasia; HGD: High grade dysplasia; EAC: Esophageal adenocarcinoma
- 1.(http://www.cdc.gov/nchs/products/pubs/pubd/lftbls/).
- 2.Chiocca JC, Olmos JA, Salis GB, Soifer LO, Higa R, Marcolongo M Argentinean Gastro-Oesophageal Reflux Study G. Prevalence, clinical spectrum and atypical symptoms of gastro-oesophageal reflux in Argentina: a nationwide population-based study. Aliment Pharmacol Ther. 2005;22:331–42. doi: 10.1111/j.1365-2036.2005.02565.x. [DOI] [PubMed] [Google Scholar]
- 3.Locke GR, 3rd, Talley NJ, Fett SL, Zinsmeister AR, Melton LJ., 3rd Risk factors associated with symptoms of gastroesophageal reflux. Am J Med. 1999;106:642–9. doi: 10.1016/s0002-9343(99)00121-7. [DOI] [PubMed] [Google Scholar]
- 4.Locke GR, 3rd, Talley NJ, Fett SL, Zinsmeister AR, Melton LJ., 3rd Prevalence and clinical spectrum of gastroesophageal reflux: a population-based study in Olmsted County, Minnesota. Gastroenterology. 1997;112:1448–56. doi: 10.1016/s0016-5085(97)70025-8. [DOI] [PubMed] [Google Scholar]
- 5.Mohammed I, Cherkas LF, Riley SA, Spector TD, Trudgill NJ. Genetic influences in gastro-oesophageal reflux disease: a twin study. Gut. 2003;52:1085–9. doi: 10.1136/gut.52.8.1085. [DOI] [PMC free article] [PubMed] [Google Scholar]
- 6.Ronkainen J, Aro P, Storskrubb T, Johansson SE, Lind T, Bolling-Sternevald E, Vieth M, Stolte M, Talley NJ, Agreus L. Prevalence of Barrett’s esophagus in the general population: an endoscopic study. Gastroenterology. 2005;129:1825–31. doi: 10.1053/j.gastro.2005.08.053. [DOI] [PubMed] [Google Scholar]
- 7.Barrett’s esophagus: epidemiological and clinical results of a multicentric survey. Gruppo Operativo per lo Studio delle Precancerosi dell’Esofago (GOSPE) Int J Cancer. 1991;48:364–8. [PubMed] [Google Scholar]
- 8.Guanrei Y, Songliang Q, He H, Guizen F. Natural history of early esophageal squamous carcinoma and early adenocarcinoma of the gastric cardia in the People’s Republic of China. Endoscopy. 1988;20:95–8. doi: 10.1055/s-2007-1018145. [DOI] [PubMed] [Google Scholar]
- 9.Provenzale D, Kemp JA, Arora S, Wong JB. A guide for surveillance of patients with Barrett’s esophagus. Am J Gastroenterol. 1994;89:670–80. [PubMed] [Google Scholar]
- 10.Lansdorp-Vogelaar I, van Ballegooijen M, Boer R, Zauber A, Habbema JD. A novel hypothesis on the sensitivity of the fecal occult blood test: Results of a joint analysis of 3 randomized controlled trials. Cancer. 2009;115:2410–9. doi: 10.1002/cncr.24256. [DOI] [PMC free article] [PubMed] [Google Scholar]
- 11.Shaheen NJ, Crosby MA, Bozymski EM, Sandler RS. Is there publication bias in the reporting of cancer risk in Barrett’s esophagus? Gastroenterology. 2000;119:333–8. doi: 10.1053/gast.2000.9302. [DOI] [PubMed] [Google Scholar]
- 12.Desai TK, Krishnan K, Samala N, Singh J, Cluley J, Perla S, Howden CW. The incidence of oesophageal adenocarcinoma in non-dysplastic Barrett’s oesophagus: a meta-analysis. Gut. 2012;61:970–6. doi: 10.1136/gutjnl-2011-300730. [DOI] [PubMed] [Google Scholar]
- 13.Yousef F, Cardwell C, Cantwell MM, Galway K, Johnston BT, Murray L. The incidence of esophageal cancer and high-grade dysplasia in Barrett’s esophagus: a systematic review and meta-analysis. Am J Epidemiol. 2008;168:237–49. doi: 10.1093/aje/kwn121. [DOI] [PubMed] [Google Scholar]
- 14.Hvid-Jensen F, Pedersen L, Drewes AM, Sorensen HT, Funch-Jensen P. Incidence of adenocarcinoma among patients with Barrett’s esophagus. N Engl J Med. 2011;365:1375–83. doi: 10.1056/NEJMoa1103042. [DOI] [PubMed] [Google Scholar]
- 15.Bhat S, Coleman HG, Yousef F, Johnston BT, McManus DT, Gavin AT, Murray LJ. Risk of malignant progression in Barrett’s esophagus patients: results from a large population-based study. J Natl Cancer Inst. 2011;103:1049–57. doi: 10.1093/jnci/djr203. [DOI] [PMC free article] [PubMed] [Google Scholar]
- 16.de Jonge PJ, Steyerberg EW, Kuipers EJ, Honkoop P, Wolters LM, Kerkhof M, van Dekken H, Siersema PD. Risk factors for the development of esophageal adenocarcinoma in Barrett’s esophagus. Am J Gastroenterol. 2006;101:1421–9. doi: 10.1111/j.1572-0241.2006.00626.x. [DOI] [PubMed] [Google Scholar]
Footnotes
Disclosures: None
Author Contributions:
Study concept and design SK IL JI MB JR RM HK
Acquisition of data SK
Analysis and interpretation of data SK IL JI MB JR RM HK
Drafting of the manuscript SK
Critical revision of the manuscript for important intellectual content SK IL JR HK RM JI MB
Statistical analysis SK RM IL JR MB JI
Obtained funding IL JI MB
Administrative, technical, or material support RM IL
Study supervision JR IV JI MB
Publisher's Disclaimer: This is a PDF file of an unedited manuscript that has been accepted for publication. As a service to our customers we are providing this early version of the manuscript. The manuscript will undergo copyediting, typesetting, and review of the resulting proof before it is published in its final citable form. Please note that during the production process errors may be discovered which could affect the content, and all legal disclaimers that apply to the journal pertain.
References
- 1.Gilbert EW, Luna RA, Harrison VL, et al. Barrett’s esophagus: a review of the literature. J Gastrointest Surg. 2011;15:708–18. doi: 10.1007/s11605-011-1485-y. [DOI] [PubMed] [Google Scholar]
- 2.Yousef F, Cardwell C, Cantwell MM, et al. The incidence of esophageal cancer and high-grade dysplasia in Barrett’s esophagus: a systematic review and meta-analysis. Am J Epidemiol. 2008;168:237–49. doi: 10.1093/aje/kwn121. [DOI] [PubMed] [Google Scholar]
- 3.Desai TK, Krishnan K, Samala N, et al. The incidence of oesophageal adenocarcinoma in non-dysplastic Barrett’s oesophagus: a meta-analysis. Gut. 2012;61:970–6. doi: 10.1136/gutjnl-2011-300730. [DOI] [PubMed] [Google Scholar]
- 4.Shaheen NJ, Crosby MA, Bozymski EM, et al. Is there publication bias in the reporting of cancer risk in Barrett’s esophagus? Gastroenterology. 2000;119:333–8. doi: 10.1053/gast.2000.9302. [DOI] [PubMed] [Google Scholar]
- 5.Spechler SJ, Sharma P, Souza RF, et al. American Gastroenterological Association technical review on the management of Barrett’s esophagus. Gastroenterology. 2011;140:e18–52. doi: 10.1053/j.gastro.2011.01.031. quiz e13. [DOI] [PMC free article] [PubMed] [Google Scholar]
- 6.Bhat S, Coleman HG, Yousef F, et al. Risk of malignant progression in Barrett’s esophagus patients: results from a large population-based study. J Natl Cancer Inst. 2011;103:1049–57. doi: 10.1093/jnci/djr203. [DOI] [PMC free article] [PubMed] [Google Scholar]
- 7.Hvid-Jensen F, Pedersen L, Drewes AM, et al. Incidence of adenocarcinoma among patients with Barrett’s esophagus. N Engl J Med. 2011;365:1375–83. doi: 10.1056/NEJMoa1103042. [DOI] [PubMed] [Google Scholar]
- 8.de Jonge PJ, van Blankenstein M, Looman CW, et al. Risk of malignant progression in patients with Barrett’s oesophagus: a Dutch nationwide cohort study. Gut. 2010;59:1030–6. doi: 10.1136/gut.2009.176701. [DOI] [PubMed] [Google Scholar]
- 9.Kroep S, Lansdorp-Vogelaar I, van der Steen A, et al. The Impact of Uncertainty in Barrett’s Esophagus Progression Rates on Hypothetical Screening and Treatment Decisions. Med Decis Making. 2014 doi: 10.1177/0272989X14551640. [DOI] [PMC free article] [PubMed] [Google Scholar]
- 10.Kong CY, Kroep S, Curtius K, et al. Exploring the recent trend in esophageal adenocarcinoma incidence and mortality using comparative simulation modeling. Cancer Epidemiol Biomarkers Prev. 2014;23:997–1006. doi: 10.1158/1055-9965.EPI-13-1233. [DOI] [PMC free article] [PubMed] [Google Scholar]
- 11.El-Serag HB, Duan Z, Hinojosa-Lindsey M, et al. Practice patterns of surveillance endoscopy in a Veterans Affairs database of 29,504 patients with Barrett’s esophagus. Gastrointest Endosc. 2012;76:743–55. doi: 10.1016/j.gie.2012.06.022. [DOI] [PMC free article] [PubMed] [Google Scholar]
- 12.Inadomi JM, Somsouk M, Madanick RD, et al. A cost-utility analysis of ablative therapy for Barrett’s esophagus. Gastroenterology. 2009;136:2101–2114. e1–6. doi: 10.1053/j.gastro.2009.02.062. [DOI] [PMC free article] [PubMed] [Google Scholar]
- 13.Corley DA, Kubo A, DeBoer J, et al. Diagnosing Barrett’s esophagus: reliability of clinical and pathologic diagnoses. Gastrointest Endosc. 2009;69:1004–10. doi: 10.1016/j.gie.2008.07.035. [DOI] [PMC free article] [PubMed] [Google Scholar]