Abstract
Carcinomas are the most commonly diagnosed cancers originating in the skin, lungs, breasts, pancreas, and other organs and glands. In most of the cases, the microenvironment within the tissue changes with the progression of disease. A key challenge is to develop a device capable of providing quantitative indicators in diagnosing cancer by measuring alteration in electrical and mechanical property of the tissues from the onset of malignancy. We demonstrate micro-electro-mechanical-systems (MEMS) based flexible polymer microsensor array capable of simultaneously measuring electro-mechanical properties of the breast tissues cores (1mm in diameter and 10μm in thickness) from onset through progression of the cancer. The electrical and mechanical signatures obtained from the tissue cores shows the capability of the device to clearly demarcate the specific stages of cancer in epithelial and stromal regions providing quantitative indicators facilitating the diagnosis of breast cancer. The present study shows that electro-mechanical properties of the breast tissue core at the micro-level are different than those at the macro-level.
1. Introduction
Cancer has been recognized as a human ailment for thousands of years and yet the underlying mechanisms of its progression are still not fully understood.1–10 Breast cancer is the most prevalent type of cancer and second most frequent cause of cancer deaths in females.11 According to the American Cancer Society, this year approximately 234,190 (2,350 males and 231,840 females) will be diagnosed with breast cancer in the United States. An estimated 40,730 (440 males and 40,290 females) are expected to die of the disease this year.11 A disruption of normal tissue homeostasis occurs during the growth of tumor and progression in the encompassing healthy tissue.12
It is believed that in case of breast cancer, in an effort to repair the damaged tissue caused by carcinoma cell invasion, the normal tissue stroma responds with excess collagen deposition.12–14 Accumulation of collagen in the benign tissue located proximal to the tumor leads to coagulation which may be associated with increasing tumor grade. This process causes changes in tissue elasticity.12–14 The changes in elasticity and electrical conductivity of these tissues are related to the degree of malignancy.7–10,15–23 Biophysical and electrophysiology studies reveal that the conductivity and elasticity of the cells and tissue changes during the course of progression of the disease.3,5,10,15,18–23 A reliable method to quantify both mechanical and electrical properties in normal and diseased tissues could serve to support early detection and more accurate staging of specimens. Palpable lumps are often the first patient-reported symptoms of breast cancer.24 Other physical properties, such as dense appearance on mammogram as well as hypo-reflectivity in ultrasound, establish the first line of screening and diagnosis of breast disease.25 These gross manifestations are undoubtedly rooted in the underlying changes that occur in microscopic components of the tissue. Stroma stiffness as well as cytoskeletal tension is generally considered the main contributors of the overall rigidity of cancer tissue. The desmoplastic change that is often found around tumors is characterized by increased proliferation of fibroblasts and high numbers of extracellular fibers. Fibroblast cells may undergo transformation into a myofibroblastic phenotype to be stained positively for smooth-muscle actin (SMA).
On the contrary, the breast cancer cells, which are the actual origin and carrier of disease, have been shown to be more pliable when examined at the microscopic scale, in both in vitro and ex vivo environments. Recent development of mechanical property measurement techniques at the micro- and nano-scale facilitates the study of cancer biomechanics.19–26 To study the nanomechanical properties associated inherent to metastatic adenocarcinoma cells conventional atomic-force microscopy (AFM) and scanning-force microscopy techniques were used.19,20,21–23
When probed with AFM, breast cancer cells lines and tissues were shown to be less stiff than their benign counterparts in culture.19–26 In recent AFM experiment performed on human breast core biopsy, sampling regions near center of the tumors also displayed less stiffness whereas the peripheral region were stiff.19 Various quantitative mechanical and physical assays has been studied to extract the elastic and viscoelastic deformability of cancer cells. A detailed study has also been carried out on mechanistic discussions of the changes in cell deformability, cytoadherence, migration, invasion and tumor metastasis.23 Our group applied a range of different biophysical and biomechanical sensors on FFPE (formalin-fixed paraffin-embedded) specimen of breast cancer and observed that epithelial and stromal tissue exhibit different measurable characteristics which follow a distinctive vicissitudes from benign to cancerous state.20, 26–27
AFM has been considered as a reliable and accurate method for the mechanical characterization of breast tissues due to its high precision capabilities and minimal sample preparation.19–20 However, this method has inherent drawbacks of dependency on complex electronics, hefty optics and fragility of AFM cantilevers.28–34 Piezoresistive sensing which translates the force to resistance overcomes the drawback of AFM. The piezoresistive sensors fabricated from silicon-on-insulator (SOI) has been used to study biomechanical property of the tissue.28–29 However, the piezoresistive sensors fabricated using silicon is fragile in nature. Since, the tip/pillar size on these devices is much smaller (10–20μm), it takes longer time to sample the entire region of interest of the tissue (often 100–200μm).
To our knowledge, there currently is no device that is capable of measuring electro-mechanical characteristics of tissue core samples simultaneously in a high throughput manner. In this article, we emphasize the fabrication and application of a novel micro-electromechanical-system (MEMS) based flexible sensor array for performing simultaneous, objective, reproducible measurements of the electro-mechanical properties of epithelial and stromal regions of normal and cancerous breast tissue cores. The device used in the present study covers the entire region of interest of the tissue reducing the sampling time as compared to the existing techniques like AFM or piezoresistive cantilever.
The device designed with an integrated array of strain gauges and electrically conducting SU-8 pillars is fabricated on poly (dimethylsiloxane) PDMS material. Serial sections of tissue specimen were stained with related cancer markers to confirm the region saliency. It is widely accepted that a carcinoma in situ, which is enclosed in an intact lining of basement membrane, may progress into an invasive tumor and disseminate into surrounding tissue upon breaking this enclosure.35,36 As breast tumors are often heterogeneous in their composition, coexistence of in situ and invasive histologic type is often seen in the morphological presentation of cases. The pathological staging of tumor based on the existence and co-existence of these components reflects the aggressiveness of the disease and can provide valuable insight regarding the clinical management of the disease.37 An absolute majority, 75–80%, of breast cancer cases are of ductal origin.38 Lobular carcinoma of breast originates from the lobular and terminal duct epithelium and represents another 5–10% of cases.39 In this experiment we study the in situ and invasive pathological groups of these subtypes to better understand the biomechanical and electrical change of breast cancer tissue during disease progression.
The breast tissue specimens used in this study were fixed tissue. In our previous studies using fixed tissue specimens, our results revealed changes in mechanical properties of cancerous tissue specimens compared to their benign counterparts.20,26–27 Furthermore, these changes correlated with the finding from studies performed on cancer cell lines as well as fresh tissue needle biopsy specimens.19–26 Therefore, extending the same line of research, we started with similar fixed tissue specimen.
Our experimental design focuses on sensing differences and distinct changes of disparate tissue components of the breast tissue specimens and the corresponding tumor marker signatures of those components. This is achieved by careful preparation and configuration of tissue specimens as well as use of digital pathology methodology (Supplementary Fig. S1). Tissue components revealed by histologic staining were highlighted by board-certified pathologist. These annotations were used to direct the MEMS-based flexible sensor array to the corresponding microscopic region-of-interest on the unstained serial slice of tissue. Biomarker expression of the same regions was further revealed by immunohistochemical staining of a stack of adjacent tissue slices.
This design establishes unique tissue mechanical-electrical-histological-immunohistochemical profile of distinct tissue regions.
2. Materials and Methods
2.1 Flexible Sensor Array Fabrication and Experimental Setup
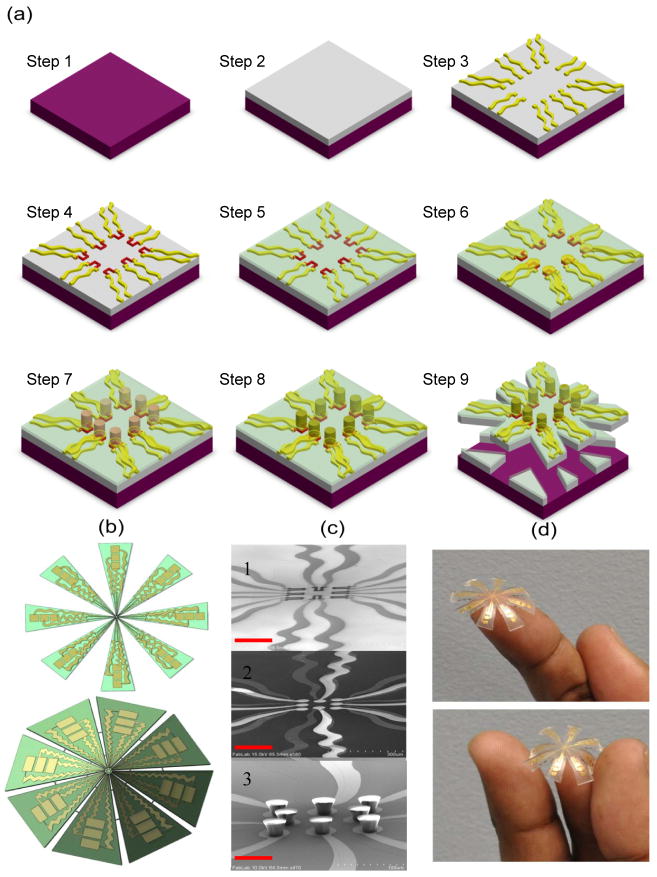
The process flow for fabricating flexible micro-electro-mechanical sensor array is shown in Fig. 1a. Due to the known issue of a mismatch of the coefficient of thermal expansion (CTE) between the photoresist (PR) and PDMS, an alternate approach is used for patterning metal on PDMS, in which, instead of prebaking PR at high temperature, it was allowed to settle for about 10 minutes before UV exposure. This method keeps the PDMS and metal film intact. The advantages of PEDOT:PSS conducting polymer are: easy to use, strong mechanical bending and higher sheet resistance than other conducting polymer which makes it a feasible material for fabricating the strain gauges.40–42
Fig. 1. Fabrication of flexible electro-mechanical device.
a, Schematic process for the fabrication of electro-mechanical device incorporating PDMS and SU-8 polymers. A silicon (Si) wafer is used as the base material for spin coating PDMS (Step 1). PDMS is spin coated on Si and cured at 80 °C for about 12 hours in furnace (Step 2). Gold (Au) 0.5 μm was deposited on PDMS using e-beam evaporation and patterned using photolithography to form array of electrodes (Step 3). Poly(3,4-thylenedioxythiophene) poly(styrenesulfonate) (PEDOT:PSS) conducting polymer (0.6 μm was spin coated and patterned to form array of strain gauges (Step 4). An insulating layer of silicon dioxide (SiO2 = 0.8 μm thick) is deposited using plasma-enhanced chemical vapor deposition (PECVD) (Step 5). The SiO2 from electrical contact pads is etched using reactive ion etching (RIE), gold (0.5 μm) is deposited and patterned to form array of electrodes with circular pad (50 μm in diameter) over each strain gauge (Step 6). SU-8 2025 (50 μm) thick is spin coated and patterned to form array of pillars (each pillar is 30 μm in diameter) (Step 7). The array of pillars is coated with gold (Step 8) (note: The top and only one side of SU-8 pillar is coated and not entire pillar). The PDMS is scribed and device is realized (Step 9). b, Flat and curved schematic of the device. c, Cross-sectional SEM images of 1) array of strain gauges, 2) circular pads over strain gauges, 3) array of gold coated SU-8 pillars on gold pads. The scale bar in each case is 100 μm. d, Photographs of the final device.
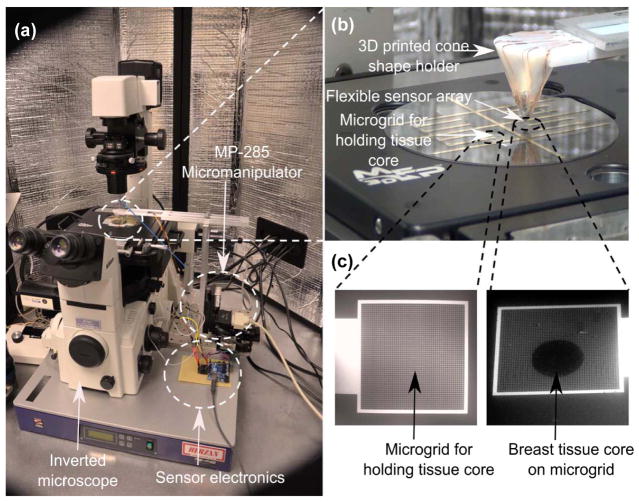
The SU-8 pillars in our design are coated with gold to enable transmission of current from the SU-8 pillar to the base plate through the tissue specimen. Thus, the novelty of our design is that the SU-8 pillars act as both a mechanical force transmission component (by transmitting the indentation force to the strain gauges) as well as electrically conducting probes to measure the tissue resistance. Figure 1b shows the flat and curved schematic diagrams of the device. The SEM images of the array of strain gauge, array of gold pads over strain gauge separated by insulating layer, and array of SU-8 pillars (acting as electrodes [E1]) can be seen from Fig. 1c. The photograph of the device is shown in Fig. 1d. Figure 2(a) shows the overall experimental system comprising of the inverted microscope, MP-285 micromanipulator, and sensor electronics. The flexible sensor array was mounted on 3D printed cone shaped holder (Fig. 2b). The breast tissue cores were placed on the bottom electrodes [E2] which consists of metallic grids (5 μm width and 20 μm spacing) (Fig. 2c). In the present work, we have used inverted microscope which enforces the use of grid pattern in the bottom electrodes instead of metallic pad.
Fig. 2. Experimental set-up for measuring electrical and mechanical properties of the breast tissue.
a, the inverted microscope facilitates in directing the flexible sensor array on to the region-of-interest in the breast tissue core. Indentation is carried out using micromanipulator and sensor electronics processes the output from the sensor and displays it on the screen. b, the flexible sensor array mounted on a 3D printed cone c, bottom electrodes with micro-grids for holding tissue cores. The scale bar is 200 μm.
2.2 Study design
This is a retrospective study based on banked tumor tissue specimen obtained from Biospecimen Repository Service at Rutgers Cancer Institute of New Jersey. Usage of de-identified human specimen in this study was approved by Institutional Review Board of Rutgers Cancer Institute of New Jersey, Rutgers University, The State University of New Jersey. Disease group of tissue specimen was first determined from deidentified pathology description associated with each specimen, and subsequently verified by board-certified pathologist by examining specimen morphology under the microscope. (Disease groups of ductal hyperplasia and lobular hyperplasia were not included in the reported data as there was not enough representative specimens identified and constructed from these groups.)
2.3 Sample preparation
Candidate breast tissue blocks with different histologic types were acquired from the Biospecimen Repository Core Facility at Rutgers Cancer Institute of New Jersey according to IRB protocols which have been approved by Rutgers University. Hematoxylin and eosin (H&E) sections of these donor blocks were examined by board-certified pathologist to highlight regions corresponding to the desired histologic groups. Tissue cores of 1mm diameter were extracted and placed into a recipient paraffin block. One additional 0.6mm diameter tissue core of different origin was placed at distance of 4mm from the breast tissue cores as orientation aid in subsequent experiment steps. The board-certified pathologist quality-controlled the H&E stained section of the two-core tissue microarrays (TMAs) and highlighted regions-of-interests (ROIs) of the desired morphology. The H&E section was digitized by Trestle MedMicroscopy® system at 20x equipment setting. The resulting whole slide images were hosted for online access at Rutgers Cancer Institute Imaging Shared Resource with the ROIs digitally annotated.
The first 10μm section was carefully transferred to the device by positioning the 1mm breast tissue core at center of the microgrid. Another 10μm section was mounted on cover glass and deparaffinized for FE-SEM imaging. The rest of the tissue block was serial-sectioned at 4μm thickness for immunohistochemical stains.
All the designed tissue cores were assembled onto a device, the device was deparaffinized and kept in PBS before performing the experiment.
2.4 IHC Staining
2.4.1 General Protocol
All IHC were performed using Ventana Discovery XT automated IHC/ISH slide staining system. Slides were cut at 4–5um. Deparaffinization and antigen retrieval were performed using CC1 (Cell Conditioning I, Ventana Medical Systems, Cat # 950-124). All primary antibodies were incubated at 37°C for 1 hour. Universal Secondary Antibody (Ventana Medical Systems, Cat#760-4205) was incubated for 12 minutes followed by chromogenic detection kit DAB Map (Ventana Medical Systems, Cat # 760-124) or Red Map (Ventana Medical Systems, Cat # 760-123). Slides were counterstained with Hematoxylin, then dehydrated and cleared before cover slipping from Xylene.
2.4.2 Estrogen Receptor (ER)
Paraffin slides were cut at 4–5um. Deparaffinization and antigen retrieval was performed using CC1 (Cell Conditioning Solution, Ventana Medical Systems, Cat# 950-124). Anti-ER (Ventana Medical Systems, Cat#790-4324, rabbit monoclonal antibody) was applied and slides were incubated at 37°C for 1 hour. Universal Secondary antibody (Ventana Medical Systems, Cat#760-4205) was incubated for 12 minutes followed by chromogenic detection kit DABMap (Ventana Medical Systems, Cat# 760-124). Slides were counterstained with Hematoxylin, then dehydrated and cleared before cover slipping from Xylene.
2.4.3 Progesterone Receptor (PR)
Paraffin slides were cut at 4–5um. Deparaffinization and antigen retrieval were performed using CC1 (Cell Conditioning Solution, Ventana Medical Systems, Cat# 950-124). Anti-PR (Ventana Medical Systems, Cat# 790-2223, rabbit monoclonal antibody) was applied and slides were incubated at 37°C for 1 hour. Universal Secondary antibody (Ventana Medical Systems, Cat#760-4205) was incubated for 12 minutes followed by chromogenic detection kit DABMap (Ventana Medical Systems, Cat# 760-124). Slides were counterstained with Hematoxylin, then dehydrated and cleared before cover slipping from Xylene.
2.4.4 Dual IHC staining: P63+Smooth Muscle Actin (SMA)
Paraffin slides were cut at 4–5um. Deparaffinization and antigen retrieval were performed using CC1 (Cell Conditioning Solution, Ventana Medical Systems, Cat # 950-124). Anti-P63 (Ventana Medical Systems, Cat#790-4509, mouse monoclonal antibody) was applied and slides were incubated at 37°C for 1 hour. Universal Secondary antibody (Ventana Medical Systems, Cat#760-4205) was incubated for 12 minutes followed by chromogenic detection kit DABMap (Ventana Medical Systems, Cat# 760-124). Slides were well-rinsed and re-labeled with proper protocols. Anti-SMA antibody (Ventana Medical Systems, Cat#760-2833, mouse monoclonal antibody) was applied and slides are incubated at 37°C for 1 hour. Universal Secondary antibody (Ventana Medical Systems, Cat # 760-4205) was incubated for 12 minutes followed by chromogenic detection kit RedMap (Ventana Medical Systems, Cat #760-123). Slides were counterstained with Hematoxylin, then dehydrated and cleared before cover slipping from Xylene.
2.4.5 Imaging and biomarker evaluation
Stained specimens were imaged using a Trestle whole slide scanner under 20X objective. The images had a scale of 0.33μm/pixel and were displayed on image servers at Rutgers Cancer Institute of New Jersey. Board-certified pathologist visually evaluated the immunohistochemical specimens using the TMA-Miner software developed in house, grading each tissue core with strategically designed evaluation qualifiers.
3. Results and discussion
Electro-mechanical signatures of breast biopsies
The mechanical signatures of the breast tissue cores are obtained by indenting it using flexible sensor array attached to the micro-manipulator with the sensor electronics capturing the data from individual strain gauge (Supplementary Fig. S2). Since tissues consist of cells and extracellular medium, their electrical properties can be measured. The cell’s electrical characteristics depend on the microscopic structures and proteins which are presented in intracellular material and which charges and moves in response to the applied fields.43 To measure the electrical properties of the tissue cores, a constant voltage is applied between the electrodes [E1] and [E2] (Supplementary Fig. S3). When the SU-8 pillars come in contact with the tissue cores, the current passes through SU-8 pillars [E1] to the bottom electrodes [E2] through the intermediate tissue layer sandwiched between the two electrodes. The SU-8 pillars are partially coated as it is enough to complete electrical path from top of pillar to electrode [E2] which comprises of metallic grid pad to hold the tissue. This configuration is connected with a resistor in series and the potential difference caused due to tissue resistance is measured.
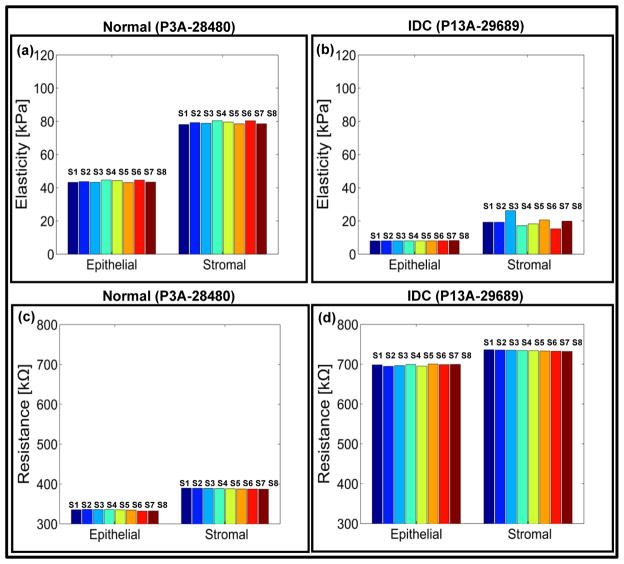
We hypothesize that the conductivity of the breast tissue changes throughout the course of disease progression in cancer and thus so does the corresponding measured voltage. This change in voltage is correlated with the change in tissue resistance which is plotted as the electrical signature of the breast tissue. The sensor calibration and sensitivity measurement is shown in Supplementary Figs. S4 and S5. The elasticity and resistance of the breast tissue cores are measured when the sensor array is displaced down by 6 μm. To explicate and correlate the electro-mechanical profiles of the breast tissue with the progression of cancer, the breast tissue cores are stained using various staining methods. Field-emission-scanning-electron-microscopy (FE-SEM) is used to observe the micro-structural changes in breast tissue core (Supplementary Fig. S7). The stiffness value of the breast tissue from each sensor is obtained by indenting the sensor array for 6μm and is plotted for normal and diseased tissue (Fig. 3 and Fig. 4).
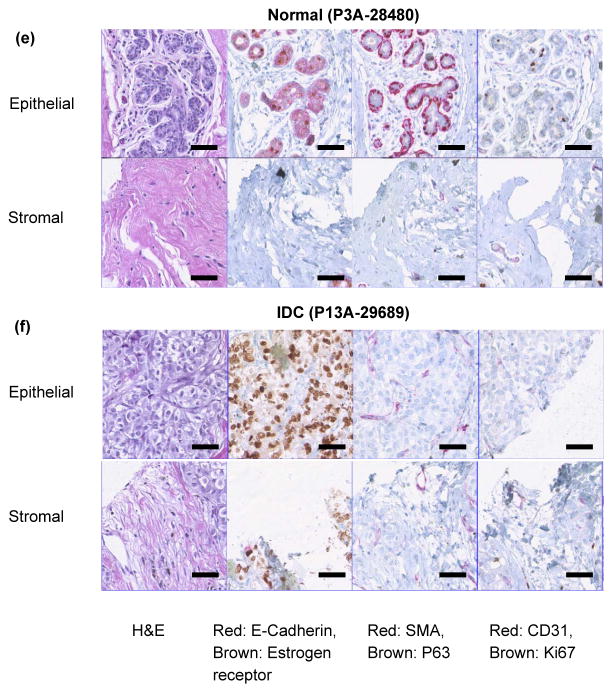
Fig. 3. Electro-mechanical signatures of human breast tissue and corresponding immunohistochemistry.
a,b, Elasticity map and c,d, change in electrical signals for epithelial and stromal regions of normal (P3A-28480) and invasive ductal carcinoma (P13A-29689) tissue cores respectively. e,f staining of normal (P3A-28480) and invasive ductal carcinoma (P13A-29689) cores. Each pillar in the plot represents output from a single sensor. In the present case, the sensor array consists of eight sensors. Scale bar for all images is 50 μm.
Fig. 4. Electro-mechanical signatures of human breast tissue with tumor progression.
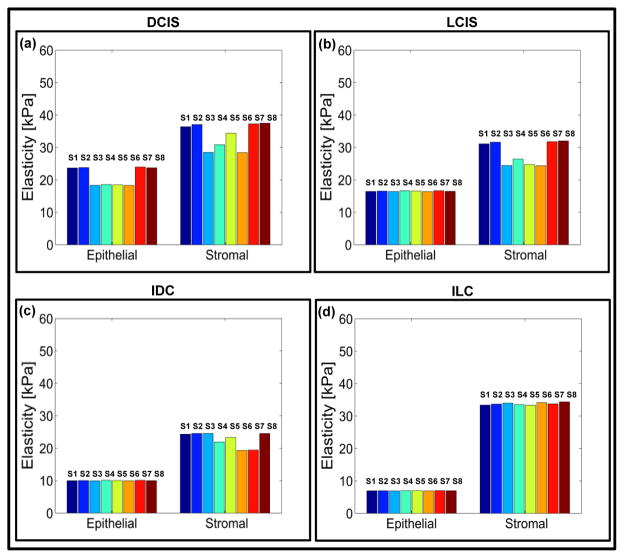
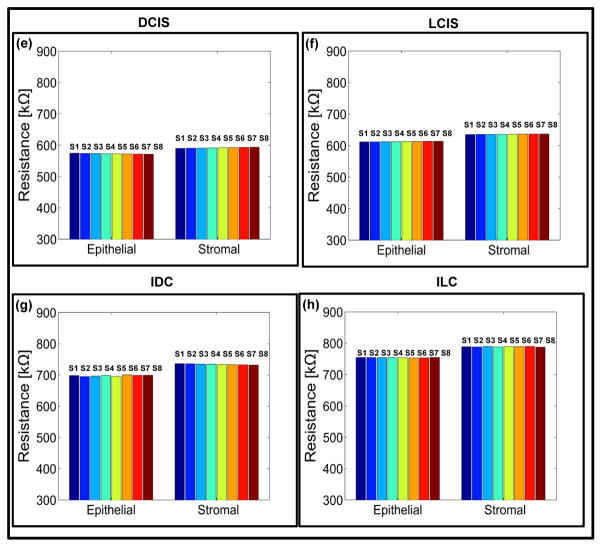
a,b,c,d Elasticity map and e,f,g,h change in electrical signals for epithelial and stromal regions of ductal carcinoma in-situ (DCIS) (P6A-11809), lobular carcinoma in-situ (LCIS) (P10A-27928), invasive ductal carcinoma (P14A-26249) and invasive lobular carcinoma (P19A-26763). The pillar in the plot shows the reading from an individual sensor in the sensor array.
The average value of elasticity obtained from sensor array is 43.79 ± 4.60 kPa for normal epithelial region of breast tissue core (Fig. 3a). The histology images (Fig. 3e) show that the normal tissue demonstrated well defined lobules and terminal ducts, surrounded by loose intralobular stroma and dense interlobular stroma. Our measurement at denser interlobular stromal region had higher value of elasticity (79.18 ± 7.82 kPa) (Fig. 3a). Epithelial cells were of two types, the majority is columnar lining the lumen with myoepithelial cells lying between the epithelial layer and basal lamina. Myoepithelials demonstrated nuclear reactivity to P63 and staining of Smooth Muscle Actin (SMA).
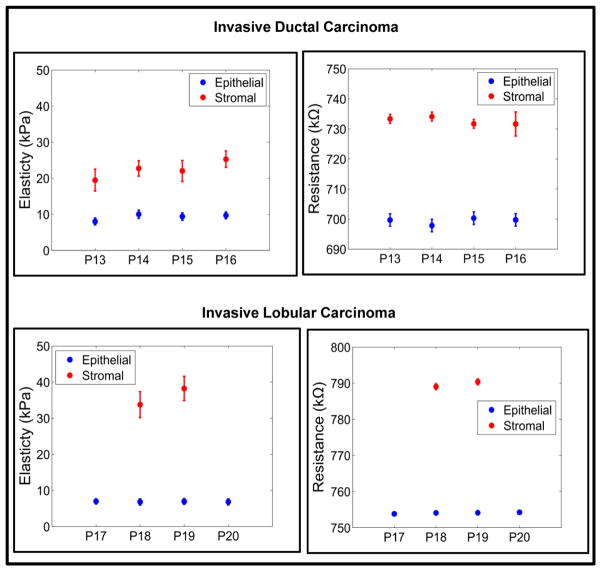
Mitotic activity as displayed by Ki67 was not brisk. Scattered cells showed immunoreactivity with estrogen receptor. Delicate vascular network was highlighted by CD31, especially in inter-lobular distribution. The electrical resistance of epithelial and stromal region of breast tissue cores is 334.95 ± 7.43 kΩ and 387.38 ± 0.93 kΩ respectively (Fig. 3c). For invasive ductal carcinoma (IDC), the resistance values for epithelial and stromal regions increased to 699.69 ± 2.07 kΩ and 733.37 ± 1.49 kΩ (fig. 3d). The reason for lower electrical resistance for normal tissue compared to cancer could be attributed to the organized glandular structure with intact basement membrane, while the stroma formed delicate network of fibers (Supplementary Fig S7). In carcinoma, on the other hand, the stroma was composed of loose but thickened fiber bundles and the tumor region not only lost their normal architecture but also presented increased fenestration (Supplementary Fig S7) resulting in higher resistance and lower conductivity. It has been shown that there is a significant difference between the resistivity of normal living tissue and that of dead tissue.43 The conductivity changes as a function of time after death because the permeability of the cell membrane changes within hours of cell death. Thus, in vitro experiments of normal living tissue could give a different set of electrical readings than the result shown in the present study.43 The elasticity of the epithelial and stromal region for IDC was found to be 8.03 ± 0.97 kPa and 19.49 ± 3.02 kPa, respectively (Fig. 3b). The immunohistochemistry for invasive carcinoma demonstrated solid growth pattern (Fig. 3f). Loss of myoepithelial layer was demonstrated by the absence of staining with SMA and P63. The ductal carcinoma was strongly ER positive. Proliferation index was low by Ki67. A more edematous area was observed possibly due to fluid build-up in the tissue resulting in softening of tissue as measured by the sensor array.
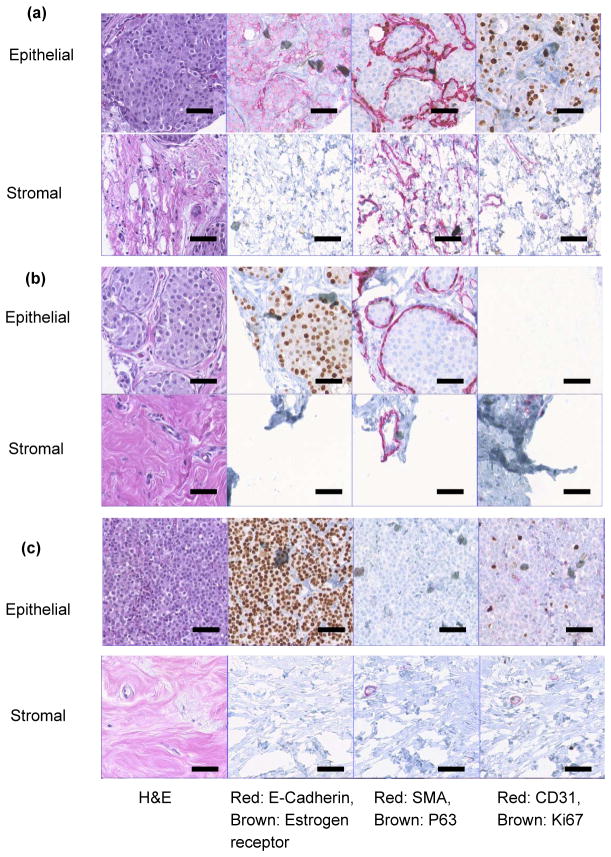
To study the intermediate stages of the breast cancer, the breast tissue cores from ductal carcinoma in situ (DCIS), lobular carcinoma in situ (LCIS), invasive ductal carcinoma (IDC) and invasive lobular carcinoma (ILC) were indented and the electro-mechanical response was measured (Fig. 4). The DCIS was characterized by proliferation of neoplastic cells without breaking the myoepithelial layer (As demonstrated by SMA and P63) (Fig. 5a). This particular sample of DCIS was of high grade, comedo type displaying luminal necrosis, high index of proliferation by Ki67 and negative for estrogen receptor. In case of LCIS, the lobules are distended and distorted by proliferation of neoplastic cells monotonous (low nuclear grade) in appearance. The basement membrane and myoepitheilal layer were intact. Neoplastic cells were ER positive with low proliferation index (Fig. 5b). The technology of immunohistochemistry staining involved additional rigorous processing to the specimen and as a result some tissue cores may fall off the glass slide or show tearing artifacts. The corresponding tissue cores with CD31 and Ki67 staining did suffer from this artifact as shown in Fig. 5(b).
Fig. 5. Immunohistochemistry of breast tissue cores.
a, ductal carcinoma in-situ (DCIS) (P6A-11809). b, lobular carcinoma in-situ (LCIS) (P10A-27928). c, invasive lobular carcinoma (P19A-26763) breast tissue cores. Staining with 1) H&E; 2) Red: E-cadherin, Brown: Estrogen receptor; 3) Red: Smooth Muscle Actin (SMA), Brown: P63; and 4) red: CD31, brown: Ki67. The scale bar in each case is 50 μm.
This results in soft and moderately stiff areas resulting in different peaks for each sensor (Fig. 4a and Fig. 4b). A fried egg appearance with central-located nuclei and pale cytoplasm was displayed by the ILC tissue core (Fig. 5c). Neoplastic cells broke through the basement membrane and filled out the surrounding stroma. The immunoreactivity for P63 is absent, the cells are strongly and diffusely ER positive, with mild increase in proliferating activity. Lobular carcinoma diagnosis has been on the rise, possibly caused by hormonal treatment for postmenstrual managements. Lobular carcinoma cases often do not display pathologic response to chemotherapy44 but has low rate of recurrence.45 Most prominent molecular traits of lobular carcinoma include loss of E-cadherin expression and down regulation of an adhesion protein CDH146, which may be the reason that lobular carcinoma displays less desmoplastic fibroblastic proliferation, instead, ILC invades surrounding tissue in its distinct single file pattern and shows a signature “targetoid” morphology surrounding ducts and lobules.38 This lack of stroma disturbance was reflected in our observation by withholding more elasticity in stroma than invasive ductal carcinoma. Compared with epithelial and stromal region from normal specimen, in situ and invasive carcinoma from both ductal and lobular origin displayed remarkable loss of elasticity (Figs. 4a, 4b, 4c, and 4d). Both invasive tumors displayed a magnitude of reduction in elastic modulus from normal breast tissue, which agreed with previous in vitro studies.19,20,26 Interestingly in situ forms of breast cancer displayed intermediate level of firmness before they break open the basement membrane and disseminate into surrounding tissue. It can be further observed that the electrical properties of the breast tissue cores changes with progression of disease and thus the measurement of the electrical resistance of each core could act as distinct signature for the disease stage (Figs. 4e, 4f, 4g, and 4f). The plots representing electro-mechanical properties of breast tissue cores for 20 patients (5 normal, 4 ductal carcinoma in-situ, 3 lobular carcinoma in-situ, 4 invasive ductal carcinoma and 4 invasive lobular carcinoma) are displayed in Supplementary Fig. S8 and the elasticity and tissue resistance values are summarized in Supplementary Table S1. Supplementary Table S2 shows group-wise distribution of data for elasticity and electrical resistance of the breast tissue.
In the case of normal tissue, the elasticity range was being 39.94 ± 4.20 kPa to 43.80 ± 4.54 kPa and the electrical resistance of the tissue was 331.78 ± 1.49 kΩ to 346.25 ± 7.63 kΩ for epithelial region indicating stiffer phenotype. As cancer progresses, the tissue becomes softer and the resistance of the tissue also changes (6.83 ± 0.86 kPa to 6.98 ± 0.72 kPa and 753.84 ± 0.46 kΩ to 754.26 ± 0.47 kΩ in case of ILC). The results obtained for nanomechanical phenotyping representing the loss of tissue stiffness with progression of cancer matches with the existing literature.19 It was found that the stromal region of cancerous breast tissue loses stiffness compared to normal breast tissue core. The reason for this phenomenon is not clear. The elemental reasoning is that the mechanical heterogeneity changes depending on the region from which tissue is extracted from. In some cases adjacent neoplastic change affects properties of the stroma resulting in softening of tissue core in stromal region. Statistical significance was consistently found (Supplementary Fig. S9) demonstrating the gradual reduction of elasticity and increase in resistance for both origins; with p-values from double tailed t-test between diseased groups listed in Table 1.
Table 1.
Double tailed t-test between diseased groups from electro-mechanical characterization.
| Mechanical Characterization | ||
|---|---|---|
| Between normal and in situ | Between in situ and invasive | |
| Ductal origin | 3.3×10⁻⁴ (n=9) | 4.6×10⁻⁴ (n=7) |
| Lobular origin | 8.3×10⁻⁵ (n=8) | 2.0×10⁻³ (n=7) |
| Electrical Characterization | ||
| Between normal and in situ | Between in situ and invasive | |
| Ductal origin | 3.7×10⁻⁴ (n=9) | 1.7×10⁻⁵ (n=7) |
| Lobular origin | 1.8×10⁻⁴ (n=8) | 5.5×10⁻⁵ (n=7) |
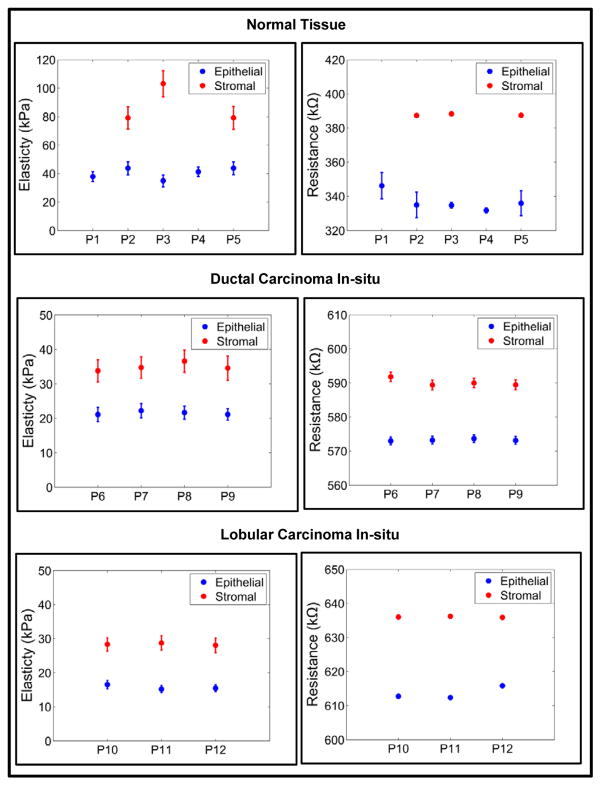
Although previous studies demonstrated certain consistency in genetic portraits of in situ and invasive carcinomas of breast36, the gradual elastic change detected in this experiment hinted a progression change in the mechanical environment. Figure 6 shows the group-wise distribution of data from normal to cancer.
Fig. 6.
A group-wise electro-mechanical analysis of the breast tissue cores.
The mechanical signature of the epithelial region in case of normal breast tissue is delineated by elasticity value ranging from 34.94 ± 1.49 kPa to 43.80 ± 4.54 kPa. The force curve obtained by indenting breast tissue cores is shown in Supplementary Fig. S10. From Fig. 3 it could be observed that the normal region shows well organized ductal and glandular structure. An intact layer of myoepithelial cells that outlined the glands are highlighted by P63 and SMA. The tumor specimen, on the contrary, displays strong positivity for estrogen receptor as well as evidence of angiogenesis as shown in sporadic CD31 staining. Myoepithelial cell layer is destroyed and SMA appeared in stroma with a different pattern, which is considered a sign of desmoplastic change (Fig. 5). The elasticity and resistance values obtained from each group (Normal, DCIS, LCIS, IDC, ILC) are plotted in Fig. 6. The cancerous epithelial regions are demonstrated by elasticity ranging from 6.83 ± 0.86 kPa to 6.98 ± 0.72 kPa. The normal stromal and cancerous stromal regions in the breast tissue can also be identified in similar way. The electrical signatures of the epithelial region of normal breast tissue is given by resistance ranging from 331.78 ± 1.49 kΩ to 346.25 ± 7.63kΩ, in case of cancerous epithelial region the range is 572.99 ± 1.13 kΩ to 753.84 ± 0.46 kΩ. The resistance range of normal stromal and cancer stromal is from 387.38 ± 0.93 kΩ to 388.32 ± 0.96 kΩ and 589.42 ± 1.16 kΩ to 790.40 ± 0.82 kΩ, respectively. It is unclear whether the additional tension in in situ tumor was a result of the encasement from basement membrane or, very likely, disseminated tumor cells incur even more cytoskeletal relaxation in the process of migrating through the connective tissue.
It is worth noting that banked normal breast tissue samples mainly originated from mammary reduction procedure and patients undergoing such procedure usually belongs to younger age group (as shown in the Supplementary Table S1). There may be certain changes between younger and older breast tissue that were not captured in current experimental design. On the other hand, it is commonly accepted that breast tissue goes through changes during menstrual cycle and that in breast tissue; the density varies amongst normal women. Our results clearly reflected such variation amongst subjects in the normal group. The tumor microenvironment, on the contrary, displayed much similarity within disease groups signaling common changes which may be captured in devices such as those demonstrated in this study. The ultimate goal of this research is to detect the biophysical changes, which reflect underlying biochemical or genetic alterations and help in clinical decision-making. In this era when smaller and smaller lesions are detected by imaging studies, and with more diagnostic tests awaiting to be performed, we hope that with a small device and small amount of tissue specimen, we will be able to generate combinations of biophysical readings that will be helpful for diagnosis and/or prognosis.
Conclusions
The pathological change in cells and tissue microstructures causes measurable changes in the electro-mechanical properties and thus providing a diagnostic tool in studying the carcinogenic tissues. We have demonstrated a method for simultaneous electro-mechanical phenotyping of the breast cancer using a novel MEMS-based flexible sensor array, whereby simultaneous mechanical and electrical properties of the breast tissue can be measured. A flexible sensor array is fabricated from low cost polymer (PDMS) as a substrate, conducting polymer (PEDOT:PSS) as piezoresistive sensor and a viscous polymer (SU-8) as conducting pillars. A notable observation is the change in electrical resistance and softening (lower mechanical stiffness) of the tissue regions with the progression of cancer. The work presented in this paper can serve as an alternative technique for observing the underlying architectural changes that occur during the course the progression of breast cancer. There still remains intriguing questions on how the technology can be used to make a portable device capable of performing out of lab experiments to detect breast cancer. This is the topic of our current research.
Supplementary Material
Acknowledgments
Research reported in this publication was supported by the National Cancer Institute of the National Institutes of Health under award number R01CA161375. The content is solely the responsibility of the authors and does not necessarily represent the official views of the National Institutes of Health. We acknowledge the support of Maryland Nanocenter for FE-SEM images and sensor fabrication, as well as Histopathology and Imaging Shared Resources of the Rutgers Cancer Institute of New Jersey (P30CA072720) for tissue archive and specimen preparation.
Footnotes
Electronic Supplementary Information (ESI) available: [details of any supplementary information available should be included here]. See DOI: 10.1039/b000000x/
Author contributions
H.J.P. and J.P.D. conceived the method. H.J.P., W.C., D.J.F and J.P.D. planned the experiments; H.J.P. fabricated the flexible sensor array; H.J.P. and K.P. performed the experiments; D.J.F., and W.C. coordinated sample selection, preparation and digitization as well as analysed results; M.A.C. selected specimen and sampling ROIs; M.A.C. and W.C. analysed the FE-SEM images and histopathology images; H.J.P., W.C., K.P., D.J.F., and J.P.D. wrote the manuscript. All authors have given approval to the final version of the manuscript.
Competing financial interests:
The authors declare no competing financial interests.
References
- 1.Chenevert TL, Skovoroda AR, O’Donnel M, Emelianov SY. Elasticity reconstructive imaging via simulated echo MRI. Magnet ResonMed. 1998;39(3):482–490. doi: 10.1002/mrm.1910390319. [DOI] [PubMed] [Google Scholar]
- 2.Park CC, Bissell MJ, Barcellos-Hoff MH. The Influence of the Microenvironment on the Malignant Phenotype. Mol Med Today. 2000;6:324–329. doi: 10.1016/s1357-4310(00)01756-1. [DOI] [PubMed] [Google Scholar]
- 3.Needham D. Possible Role of Cell Cycle-dependent Morphology, Geometry, and Mechanical-properties in Tumor-Cell Metastasis. Cell Biophys. 1991;18:99–121. doi: 10.1007/BF02989809. [DOI] [PubMed] [Google Scholar]
- 4.Yamamoto Y, Yamamoto T. Measurement of electrical bioimpedance and its applications. Medical Process through Technology. 1987;12:171–183. doi: 10.1007/978-94-009-3361-3_15. [DOI] [PubMed] [Google Scholar]
- 5.Kumar S, Weaver V. Mechanics, Malignancy, and Metastasis: The Force Journey of a Tumor Cell. Cancer Metast Rev. 2009;28:113–127. doi: 10.1007/s10555-008-9173-4. [DOI] [PMC free article] [PubMed] [Google Scholar]
- 6.Ghenim L, Kaji H, Hoshino Y, Ishibashi T, Haguet V, Gidrol X, Nishizawa M. Monitoring impedance changes associated with motility and mitosis of a single cell. Lab Chip. 2010;10:2546–2550. doi: 10.1039/c004115g. [DOI] [PubMed] [Google Scholar]
- 7.Butcher DT, Alliston T, Weaver VM. A Tense Situation: Forcing Tumor progression. Nature Rev Cancer. 2009;9:108–122. doi: 10.1038/nrc2544. [DOI] [PMC free article] [PubMed] [Google Scholar]
- 8.Sinkus R, Lorenzen J, Schrader D, Lorenzen M, Dargatz M, Holz D. High-Resolution Tensor MR Elastography for Breast Tumor detection. Phys Med Biol. 2000;45:1649–1664. doi: 10.1088/0031-9155/45/6/317. [DOI] [PubMed] [Google Scholar]
- 9.Halter RJ, Schned A, Heaney J, Hartov A, Schutz S, Paulsen KD. Electrical impedance spectroscopy of benign and malignant prostatic tissues. J Urol. 2008;179:1580–1586. doi: 10.1016/j.juro.2007.11.043. [DOI] [PubMed] [Google Scholar]
- 10.Levental KR, Yu H, Kass L, Lakins JN, Egeblad M, Erler JT, Fong SF, Csiszar K, Giaccia A, Weninger W, Yamauchi M, Gasser DL, Weaver VM. Matrix Crosslinking Forces Tumor Progression by Enhancing Integrin Signaling. Cell. 2009;139:891–906. doi: 10.1016/j.cell.2009.10.027. [DOI] [PMC free article] [PubMed] [Google Scholar]
- 11.American Cancer Society. Cancer Facts & Figures 2015. Atlanta: American Cancer Society; 2015. [Google Scholar]
- 12.Dvorak HF. Wounds that do Not Heal. N Eng J Med. 1986;315:1650–1659. doi: 10.1056/NEJM198612253152606. [DOI] [PubMed] [Google Scholar]
- 13.Tuxhorn JA, Ayala GE, Rowley DR. Reactive Stroma in Prostate Cancer Progression. J Urology. 2001;166:2472–2483. [PubMed] [Google Scholar]
- 14.Tuxhorn JA, Ayala GE, Smith MJ. Reactive Stroma in Human Prostate Cancer: Induction of Myofibroblast Phenotype and Extracellular Matrix Remodeling. Clin Cancer Res. 2002:2912–2923. [PubMed] [Google Scholar]
- 15.Prodan C, Mayo F. Low-frequency, Low-Field Dielectric Spectroscopy of Living Cell Suspensions. J Appl Phys. 2004;95:3754–3756. [Google Scholar]
- 16.Gowrishankar TR, Weaver JC. An Approach to Electrical Modeling of Single and Multiple cells. Biophys J. 2003;100(6):3203–3208. doi: 10.1073/pnas.0636434100. [DOI] [PMC free article] [PubMed] [Google Scholar]
- 17.Tan L, Xie Q, Jia XE, Guo M, Zhang Y, Tang H, Yao S. Dynamic Measurement of the Surface Stress Induced by the Attachment and Growth of Cells on Au Electrode with a Quartz Crystal Microbalance, Biosens. Bioelectron. 2009;24:1603–1609. doi: 10.1016/j.bios.2008.08.021. [DOI] [PubMed] [Google Scholar]
- 18.Gheorghiu E, Asami K. Monitoring Cell Cycle by Impedance Spectroscopy: Experimental and Theoretical Aspects, Bioelectrochem. Bioenerg. 1998;45:139–143. [Google Scholar]
- 19.Plodinec M, Loparic M, Monnier CA, Obermann EC, Dallenbach RZ, Oertle P, Hyotyla JT, Aebi U, Bentires-Alj M, Lim RYH, Schoenenberger CA. The Nanomechanical Signature of Breast Cancer. Nat Nanotechnol. 2012;7:757–765. doi: 10.1038/nnano.2012.167. [DOI] [PubMed] [Google Scholar]
- 20.Roy R, Chen W, Goodell L, Hu J, Foran DJ, Desai JP. A SemiAutomated Positioning System for Contact-Mode Atomic Force Microscopy (AFM) IEEE Trans Autom Sci Eng. 2013;10:462–465. doi: 10.1109/TASE.2012.2226154. [DOI] [PMC free article] [PubMed] [Google Scholar]
- 21.Lekka M. Elasticity of Normal and Cancerous Human Bladder Cells Studied by Scanning Force Microscopy. Eur Biophys J. 1999;28:312–316. doi: 10.1007/s002490050213. [DOI] [PubMed] [Google Scholar]
- 22.Swift J, Ivanovska IL, Buxboim A, Harada T, Dingal DP, Pinter J, Pajerowski JD, Spinler KR, Shin JW, Tewari M, Rehfeldt F, Speicher DW, Discher DE. Nuclear Lamin-A Scales with Tissue Stiffness and Enhances Matrix-Directed Differentiation. Science. 2013;341:1240104-1–1240104-16. doi: 10.1126/science.1240104. [DOI] [PMC free article] [PubMed] [Google Scholar]
- 23.Suresh S. Biomechanics and Biophysics of Cancer Cells. Acta Mater. 2007;55:3989–4014. doi: 10.1016/j.actbio.2007.04.002. [DOI] [PMC free article] [PubMed] [Google Scholar]
- 24.O’Malley MS, Fletcher SW. Screening for breast cancer with breast self-examination: A critical review. JAMA. 1987;257:2196–2203. [PubMed] [Google Scholar]
- 25.Baker LH. Breast cancer detection demonstration project: Five-year summary report. CA: Cancer J Clin. 1982;32:194–225. doi: 10.3322/canjclin.32.4.194. [DOI] [PubMed] [Google Scholar]
- 26.Roy R. PhD Thesis. University of Maryland; College Park, USA: 2014. Mechanical Characterization of Normal and Cancerous Breast Tissue Specimens using Atomic Force Microscopy. [Google Scholar]
- 27.Pandya HJ, Chen W, Goodell LA, Foran DJ, Desai JP. Mechanical phenotyping of breast cancer using MEMS: a method to demarcate benign and cancerous breast tissues. Lab Chip. 2014;14:4523–4532. doi: 10.1039/c4lc00594e. [DOI] [PMC free article] [PubMed] [Google Scholar]
- 28.Gimzewski JK, Gerber C, Meyer E, Schlittler RR. Observation of a chemical-reaction using a micromechanical sensor. Chem Phys Lett. 1994;217:589–594. [Google Scholar]
- 29.Thundat T, Warmack RJ, Chen GY, Allison DP. Thermal and ambient induced deflections of scanning force microscope cantilevers. Appl Phys Lett. 1994;64:2894–2896. [Google Scholar]
- 30.Mukhopadhyay R, Sumbayev VV, Lorentzen M, Kjems J, Andreasen PA, Besenbacher F. Cantilever sensor for nanomechanical detection of specific proteins conformation. Nano Lett. 2005;5:2385–2388. doi: 10.1021/nl051449z. [DOI] [PubMed] [Google Scholar]
- 31.Ghatkesar MK, Lang HP, Gerber C, Hegner M, Braun T. Comprehensive Characterization of Molecular Interactions Based on Nanomechanics. PLoS One. 2008;3:1–6. doi: 10.1371/journal.pone.0003610. [DOI] [PMC free article] [PubMed] [Google Scholar]
- 32.Backmann N, Zahnd C, Huber F, Bietsch A, Pluckthun A, Lang HP, Guntherodt HJ, Hegner M, Gerber C. A label-free immunosensor array using single-chain antibody fragments. Proc Natl Acad Sci U S A. 2005;102:14587–14592. doi: 10.1073/pnas.0504917102. [DOI] [PMC free article] [PubMed] [Google Scholar]
- 33.Berger R, Delamarche E, Lang HP, Gerber C, Gimzewski JK, Meyer E, Guntherodt HJ. Surface stress in the self-assembly of alkanethiols on gold. Science. 1997;276:2021–2024. [Google Scholar]
- 34.Fritz J, Baller MK, Lang HP, Rothuizen H, Vettiger P, Meyer E, Guntherodt HJ, Gerber C, Gimzewski JK. Translating biomolecular recognition into nanomechanics. Science. 2000;288:316–318. doi: 10.1126/science.288.5464.316. [DOI] [PubMed] [Google Scholar]
- 35.Allred DC, Mohsin SK, Fuqua SA. Histological and biological evolution of human premalignant breast disease. Endocr Relat Cancer. 2001;8:47–61. doi: 10.1677/erc.0.0080047. [DOI] [PubMed] [Google Scholar]
- 36.Ma XJ, et al. Gene expression profiles of human breast cancer progression. Proc Natl Acad Sci U S A. 2003;100:5974–5979. doi: 10.1073/pnas.0931261100. [DOI] [PMC free article] [PubMed] [Google Scholar]
- 37.Edge S, Byrd D, Compton C, Green F, Trotti A. AJCC Cancer Staging Manual. 7. Springer; New York: 2010. [Google Scholar]
- 38.Rosen PP. Rosen’s Breast Pathology. 3. LIPPINCOTT WILLIAMS & WILKINDS; 2009. [Google Scholar]
- 39.Lacroix M, Toillon RA, Leclercq G. Stable ‘portrait’ of breast tumors during progression: data from biology, pathology and genetics. Endocrine-related cancer. 2004;11:497–522. doi: 10.1677/erc.1.00758. [DOI] [PubMed] [Google Scholar]
- 40.Lang U, Rust P, Dual J. Towards fully polymeric MEMS: Fabrication and testing of PEDOT/PSS strain gauges. Microelectron Eng. 2008;85:1050–1053. [Google Scholar]
- 41.Liu N, Fang G, Wan J, Zhou H, Long H, Zhao X. Electrospun PEDOT:PSS-PVA nanofiber based unltrhigh-strain sensors with controllable electrical conductivity. J Mater Chem. 2011;21:18962–18966. [Google Scholar]
- 42.Takamastu S, Takahata T, Muraki M, Iwase E, Matsumoto K, Shimoyama I. Transparent conductive-polymer strain sensors for touch input sheets of flexible displays. J Micromech Microeng. 2010;20:075017(1)–075017(6). [Google Scholar]
- 43.Hope T, Iles S. Technology review: The use of electrical impedance scanning in the detection of breast cancer. Breast Cancer Res. 2004;6:69–74. doi: 10.1186/bcr744. [DOI] [PMC free article] [PubMed] [Google Scholar]
- 44.Cristofanilli M, et al. Invasive lobular carcinoma classic type: response to primary chemotherapy and survival outcomes. J Clin Oncol. 2005;23:41–48. doi: 10.1200/JCO.2005.03.111. [DOI] [PubMed] [Google Scholar]
- 45.Yeatman TJ, et al. Tumor biology of infiltrating lobular carcinoma. Implications for management. Ann Surg. 1995;222:559–561. doi: 10.1097/00000658-199522240-00012. [DOI] [PMC free article] [PubMed] [Google Scholar]
- 46.Zhao H, et al. Different gene expression patterns in invasive lobular and ductal carcinomas of the breast. Mol Biol Cell. 2004;15:2523–2536. doi: 10.1091/mbc.E03-11-0786. [DOI] [PMC free article] [PubMed] [Google Scholar]
Associated Data
This section collects any data citations, data availability statements, or supplementary materials included in this article.


