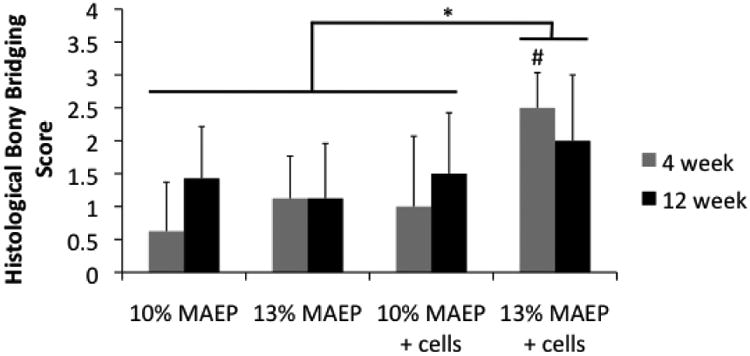
Figure 8.

Scores of histological analysis of bony bridging across the defect. # indicates that the point is significantly different than other groups within a time point (p<0.05). * indicates the main effects analyasis showed 13 mol% MAEP + cells group has significantly higher bony bridging scores when evaluated across all time points (p<0.05). Error bars show standard deviation (n=7-8).
