Abstract
Background & Aims
Receptor tyrosine kinase (RTK) inhibitors have advanced colon cancer treatment. We investigated the role of the RTK KIT in development of human colon cancer.
Methods
An array of 137 patient-derived colon tumors and their associated xenografts were analyzed by immunohistochemistry to measure levels of KIT and its ligand KITLG. KIT and/or KITLG was stably knocked down by expression of small hairpin RNAs from lentiviral vectors in DLD1, HT29, LS174T, and COLO320 colon cancer cell lines, and in UM-COLON#8 and POP77 xenografts; cells transduced with only vector were used as controls. Cells were analyzed by real-time quantitative reverse transcription PCR, single-cell gene expression analysis, flow cytometry, and immunohistochemical, immunoblot, and functional assays. Xenograft tumors were grown from control and KIT-knockdown DLD1 and UM-COLON#8 cells in immunocompromised mice and compared. Some mice were given the RTK inhibitor imatinib following injection of cancer cells; tumor growth was measured based on bioluminescence. We assessed tumorigenicity using limiting dilution analysis.
Results
KIT and KITLG were expressed heterogeneously by a subset of human colon tumors. Knockdown of KIT decreased proliferation of colon cancer cell lines and growth of xenograft tumors in mice, compared with control cells. KIT knockdown cells had increased expression of enterocyte markers, decreased expression of cycling genes, and, unexpectedly, increased expression of LGR5-associated genes. No activating mutations in KIT were detected in DLD1, POP77, or UM-COLON#8 cell lines. However, KITLG-knockdown DLD1 cells formed smaller xenograft tumors than control cells. Gene expression analysis of single CD44+ cells indicated that KIT may promote growth via KITLG autocrine and/or paracrine signaling. Imatinib inhibited growth of KIT+ colon cancer organoids in culture and growth of xenograft tumors in mice. Cancer cells with endogenous KIT expression were more tumorigenic in mice.
Conclusions
KIT and KITLG are expressed by a subset of human colon tumors. KIT signaling promotes growth of colon cancer cells and organoids in culture and xenograft tumors in mice via its ligand, KITLG, in an autocrine or paracrine manner. Patients with KIT-expressing colon tumors may benefit from KIT RTK inhibitors.
Keywords: CD117, stem cell factor, colorectal cancer, enteroids
INTRODUCTION
Over a million cases of colon cancer are diagnosed annually worldwide1. Survival for advanced disease remains poor despite the use of recently-developed receptor tyrosine kinase (RTK) inhibitors such as regorafenib2,3. Regorafenib’s high-affinity targets include the VEGF receptor, EGFR, and the oncogenic kinases KIT, RET, and BRAF. Identifying which of these targets drives colon cancer progression would help identify patients for targeted therapy4. Because RTK inhibitors are nonspecific, genetic approaches are required for determining which RTKs are important for colon cancer growth.
KIT (CD117) is an RTK expressed in specialized goblet cells that contribute to the stem cell niche in the murine colon crypt base5. In human colon, KIT expression has been reported in several colon cancer cell lines, although KIT expression in primary colon tumors has been controversial6–10. KIT signaling occurs when it binds its only known ligand, KITLG (Stem Cell Factor), causing receptor dimerization, autophosphorylation, and intracellular signaling. KIT can promote cell growth, survival, migration, differentiation, and secretion in different biological contexts11–13. Activating/oncogenic mutations in KIT are well-documented in gastrointestinal stromal tumor (GIST), melanoma, and other diseases11,13. However, the roles of KIT and KITLG remain incompletely understood in colon cancer. Furthermore, studies on patient-derived xenografts are lacking.
Here we show that a subset of human colon cancers expresses KIT in the tumorigenic CD44+ fraction14. Stable KIT knockdown inhibits colon cancer growth, increases expression of differentiation markers, and, unexpectedly, increases expression of stem cell-associated genes. KIT may drive tumor growth via autocrine and/or paracrine signaling by KITLG, since no activating KIT mutations were found. CD44+KIT+ cells are also highly tumorigenic. Our findings support the hypothesis that patients with KIT-expressing colon tumors may benefit from KIT inhibition.
METHODS
Additional details for all methods can be found in Supplementary Materials.
Mice
Mice were maintained at the Stanford University Research Animal Facility in accordance with Stanford University guidelines. 4- to 8-week-old NOD-scid IL2Rgnull (NSG) mice were used (Jackson Labs).
Tumor Microarray
A collection of 316 colon tumors were sectioned, processed, and stained with anti-human cKIT (cat# A4502, Dako) and KITLG (cat #2093, Cell Signaling Technology) antibodies. The collection consisted of 137 primary tumors from University of Toronto patients and associated xenografts. Staining was scored as Uninterpretable, None, Weak, or Strong.
Tissue Culture and Xenograft Formation
Cell lines and xenograft-derived organoids were grown in advanced Dulbecco’s modified Eagle medium/F12 (Invitrogen) with 10 mM Hepes, 1x Glutamax (Life Technologies), 10% heat-inactivated fetal bovine serum, 120 μg/ml penicillin, 100 μg/ml streptomycin, and 0.25 μg/ml amphotericin-B. Organoids were seeded in growth factor reduced Matrigel (BD Biosciences). Xenografts were derived from cells or tumor chunks implanted subcutaneously into flanks of NSG mice.
shRNA Lentiviral Transduction
shRNA oligonucleotides containing KIT− or KITLG-targeting sequences (Table S1) were designed using pSicoOligomaker 1.5 (T. Jacks Lab) and Basic Local Alignment Search Tool (NCBI) against the human genome to minimize off-target effects. Five oligonucleotides each were screened for KIT and KITLG knockdown, and the best two were selected. A modified pSico-Pgk-GFP vector (plasmid# 12093, Addgene) containing the shRNA sequences preceded by the EF1α promoter, along with lentiviral packaging vectors Δ8.9 and VSVG, were transfected into 293T fibroblasts using FuGENE (Promega)15.
Flow Cytometry
Methods for flow cytometry have been previously described5. Briefly, cells in single-cell suspension were stained in the dark on ice with fluorescently-conjugated antibodies: Kit-PE (cat# 340529, BD Biosciences), Kit-PE-cy7 (cat# 339195, BD Biosciences), CD44-PE-Cy7 (cat# 560533, BD Biosciences), CD44-APC (cat# 559942, BD Biosciences), EPCAM-Alexa488 (clone 9C4, BioLegend), H2KD-Pacific Blue (clone SF1-1.1, BioLegend), and MKI67-PerCP-Cy5.5 (cat# 561284, BD Biosciences). EdU staining was performed with Click-iT EdU Alexa Fluor 647 Flow Cytometry Assay Kit (Life Technologies) and BD Cytofix/Cytoperm Fixation/Permeabilization Kit (BD Bioscences).
Single-cell Gene Expression Analysis
Double-sorted FACS-isolated single cells with purity > 95% were sorted into individual wells of 96-well plates containing 5 μL lysis buffer (Cells Direct qRT-PCR mix; Invitrogen) and 2U (0.1 μL) SuperaseIn (Invitrogen) and processed as described5,16.
Bioluminescence Imaging
Colon cancer cells/xenografts engineered to constitutively express luciferase (LUC2) by lentiviral transduction were injected into flanks of NSG mice17. Mice received intraperitoneal injections of luciferin (Biosynth), and total flux (photons/second) was recorded.
Immunofluorescence Imaging
Paraffin-embedded tissue sections were stained with mouse anti-human Ki67 (Clone MIB-1, Dako) and rabbit anti-human CD117 (cat# A4502, Dako) primary antibodies, with donkey anti-mouse Cy5 (cat# 715-175-150, Jackson ImmunoResearch) and goat anti-rabbit A568 (cat# SAB4600084, Sigma) secondary antibodies. Stained sections were mounted with ProLong Gold+Dapi (Molecular Probes).
Imatinib Experiments
Imatinib mesylate (LC Laboratories) was dissolved in phosphate buffered saline (PBS) at the specified concentrations for each experiment. For in vivo studies, imatinib 50 mg/kg/day or PBS control was administered to mice via intraperitoneal injections.
Statistical Analysis
Values represent mean, standard deviation, or standard error of mean as indicated. Differences between groups were determined using the two-tailed Student t-test. For Fig. 5A, one-way ANOVA was performed with Tukey’s post-hoc test. For Fig. 6C, L-Calc (Stemcell Technologies) was used for limiting dilution analysis. All tests used a significance cutoff of p < 0.05. Analysis was performed with GraphPad Prism 5 (GraphPad Software Inc.).
Figure 5.
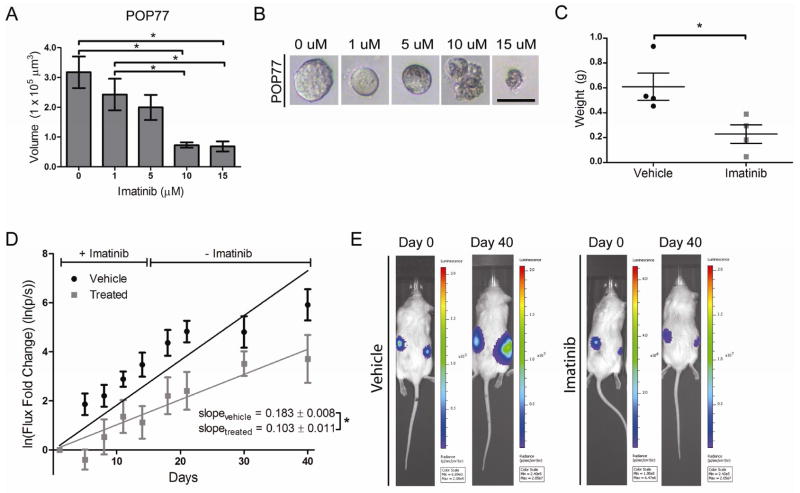
Imatinib inhibits the growth of colon cancers. A) POP77 was grown in Matrigel as organoids. Size of imatinib-treated organoids decreased in a dose-dependent manner (n = 10 organoids/group; mean ± SE shown). B) Photomicroscopy of representative POP77 organoids showing loss of smooth organoid borders and accumulation of membranous blebs with increasing imatinib dose (bar = 100 μm). C) 8×10⁵ DLD1 cells were injected into the flanks of NSG mice and treated with imatinib or saline vehicle for 10 days. Tumors were weighed at post-injection day 10 (n = 4 tumors/group; mean ± SE shown). D) Chunks of UMCOLON-#8-luc were implanted subcutaneously into mice and mice were treated with imatinib or saline vehicle for 14 days. Tumor bioluminescence flux was recorded and natural log transformation and linear regression was performed (n = 21 tumors for vehicle, n = 16 tumors for imatinib; mean ± SE shown). E) Representative bioluminescent images shown. *, P < 0.05 in Student t test.
Figure 6.
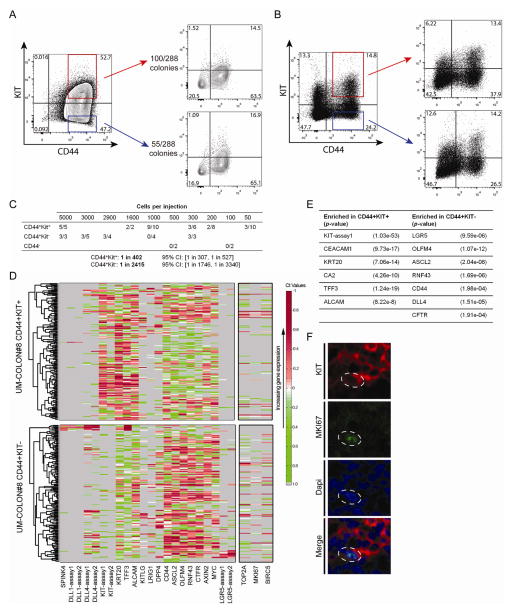
KIT-expression enriches for the tumorigenic fraction of human colon cancer. A) DLD1 CD44+KIT+ and CD44+KIT− cells were grown as single-cells, and the number of colonies formed was tallied. FACS plots showing that KIT+ or KIT− single-cell colonies recapitulate both KIT+ and KIT− subpopulations. B) Double-sorted UM-COLON#8 CD44+KIT+ and CD44+KIT− cells were injected into flanks of NSG mice, then harvested after 30 days. FACS plots show that both KIT+ and KIT− cells could recapitulate all subpopulations of the parental tumor. C) Limiting dilution experiment showing differences in tumorigenicity for FACS-sorted UM-COLON#8 CD44+KIT+ and CD44+KIT− cells. D) Single-cell qRT-PCR for the indicated genes was performed on double-sorted CD44+KIT+ and CD44+KIT− UM-COLON#8 subpopulations. Proliferation markers (MKI67, BIRC5, and TOP2A; indicated separately) were not included in the clustering. E) Differential gene expression with associated p-values for the data shown in D). P-values were derived using the Wilcoxon rank-sum test. F) Confocal imaging of UM-COLON#8 stained for KIT (red), MKI67 (green), and Dapi (blue) showing that some KIT+ cells express MKI67 (dotted outline). *, P < 0.05 in Student t test.
RESULTS
Heterogeneous staining for KIT in a subset of human colon cancers
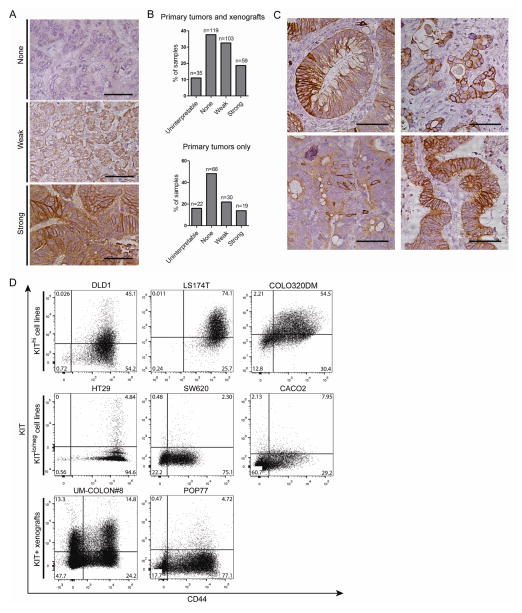
To assess KIT expression in colon cancer, we performed immunohistochemistry for KIT on a tumor microarray consisting of sections from 316 colon tumors: 137 primary tumors and 179 associated serially-passaged xenografts (Fig. 1A–C). 36% of primary tumors and 51% of total tumors stained at least weakly for KIT (Fig. 1B), in agreement with published proteomic data on colorectal cancer9. Some tumors showed scattered, strongly KIT-positive tumor cells, while others showed a diffuse staining pattern (Fig. 1C). KIT staining was membrane-associated, cytoplasmic, or both. Flow cytometry analysis of several colon cancer cell lines and patient-derived xenografts also revealed variable KIT expression (Fig. 1D). DLD1, LS174T, and COLO320DM cells are KIThi, while HT29, SW620, CACO2, and HCT116 (not shown) are KITlo/neg, agreeing with previous studies18,19. UM-COLON#8 and POP77 are stable, moderately differentiated xenografts that express KIT in the tumorigenic CD44+ subpopulation14. KIT+CD44- cells are also seen.
Figure 1.
KIT is variably expressed in human colon tumors, xenografts, and cell lines. A) An array of primary and xenograft tumor sections was scored for KIT immunostaining intensity (n = 316 total sections, n = 137 primary tumors only; bar = 50 μm). B) The number of primary tumors and xenografts per score was tallied. C) Selective images from the tumor array demonstrating heterogeneity of KIT immunoreactivity (bar = 50 μm). D) FACS plots for CD44 and KIT of colon cancer cell lines (DLD1, LS174T, COLO320DM, HT29, SW620, CACO2) and patient-derived xenografts (UM-COLON#8, POP77). Percentage of cells in each quadrant is shown.
KIT knockdown inhibits growth of DLD1 in vitro and in vivo
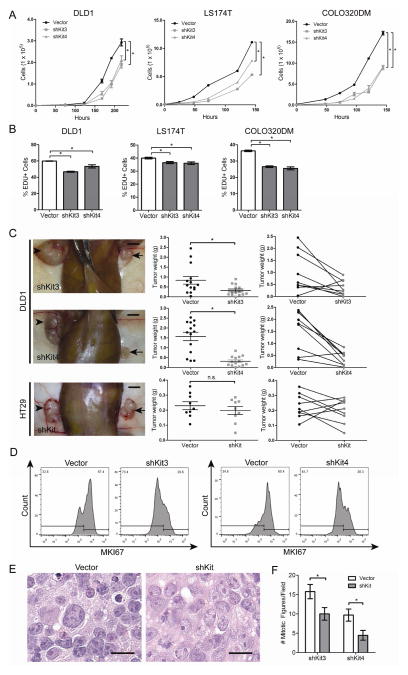
To assess whether KIT promotes growth in colon cancer, we transduced DLD1, LS174T, and COLO320DM cells with two lentiviral shRNAs, shKit3 and shKit4 (Table S1). qRT-PCR, FACS, and Western blot confirmed strong KIT knockdown (Fig. S1). When grown in vitro, shKit3 and shKit4 cells exhibited decreased growth compared to vector control cells (Fig. 2A). DLD1, LS174T, and COLO320DM shKit cells also showed decreased EdU incorporation, indicating that fewer tumor cells entered S-phase upon KIT knockdown (Fig. 2B). Phase contrast microscopy and FACS analysis showed that cell size, shape, and granularity were not significantly affected by KIT knockdown (data not shown).
Figure 2.
KIT knockdown decreases colon cancer growth in vivo and in vitro. A) Growth rates of DLD1, LS174T, and COLO320DM cells transduced with KIT shRNAs (shKit3, shKit4) or the empty vector control were assessed (mean ± SE shown). B) EdU uptake of DLD1, LS174T, and COLO320DM cells over 1 hour (mean ± SE shown). C) 1×10⁴ KIT knockdown DLD1 cells (panels in top two rows) or HT29 cells (bottom row panels) were injected into one flank of NSG mice, paired with control cells in the other flank. Arrows indicate knockdown tumors and arrowheads indicate control (left column panels; bar = 0.5 cm). KIT knockdown DLD1 tumors (n = 14 tumors/group) and HT29 tumors (n = 9 tumors) were weighed on post-injection day 30 (middle column panels, mean ± SE shown). The before-after plots (right column panels) show paired tumors from each mouse. D) Dissociated DLD1 tumor cells were fixed, stained for MKI67, and analyzed by flow cytometry. E) Hemotoxylin and eosin stains of DLD1 KIT knockdown tumors show decreased nuclear pleiomorphism and nucleolar size (n = 4 tumor pairs; bar = 25 μm). F) Average number of mitotic figures for representative DLD1 shKit3 and shKit4 tumors, compared to their paired control tumor (n = 26 high powered fields/tumor). *, P < 0.05 in Student t test. n.s., not significant.
Next, to assess the effect of KIT knockdown on growth in vivo, we injected DLD1 knockdown cells into one flank of immunocompromised mice and DLD1 control into the opposite flank. After 30 days of tumor growth, we observed an average tumor weight reduction of 62% with DLD1 shKit3 cells, and 79% with shKit4 cells (Fig. 2C). As a control, we knocked down KIT in the KITlo/neg cell line HT29 and observed no significant change in tumor weight (Fig. 2C). To measure the frequency of proliferative cells, we performed MKI67 staining on dissociated DLD1 shKit3 and shKit4 xenograft cells, and observed a 56% and 41% decrease in MKI67 staining, respectively (Fig. 2D). We confirmed that KIT remained stably knocked down in these tumors after their passage in vivo (Fig. S2). Notably, hemotoxylin and eosin staining of DLD1 tumors showed that knockdown tumors exhibited less nuclear pleiomorphism and smaller, less prominent nucleoli (Fig. 2E)—pathologic features that correlate with less aggressive tumors. As expected, the average number of mitotic figures was smaller in knockdown DLD1 tumors (Fig. 2F). These results show that KIT promotes growth in KIT+ colon cancers and that KITlo/neg colon cancer cells are not dependent on KIT for growth.
Transcriptional changes upon KIT knockdown
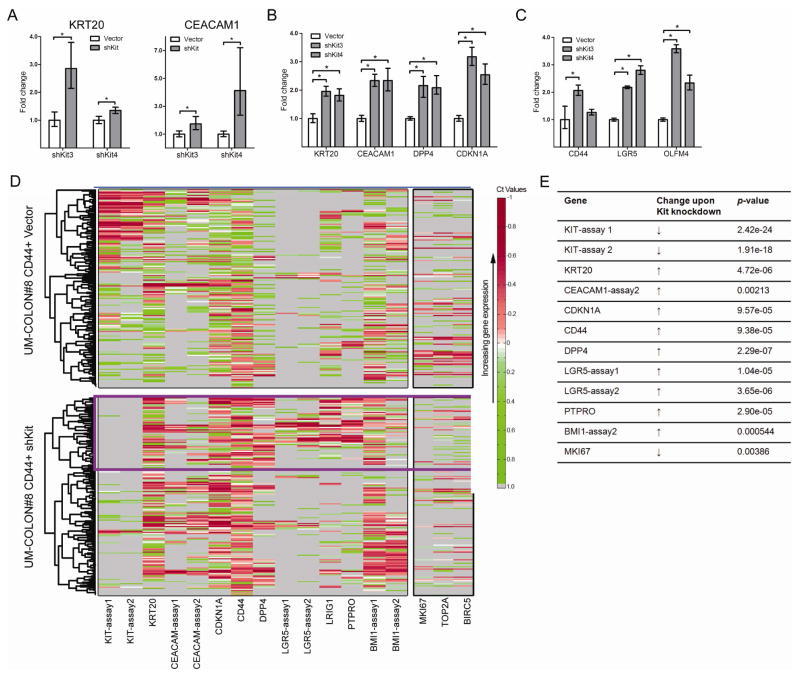
We next assessed transcriptional changes occurring after KIT knockdown. We performed qRT-PCR and found that the enterocyte markers KRT20 and CEACAM1 were increased in DLD1 shKit3 and shKit4 tumors (Fig. 3A), whereas no changes were seen with the goblet cell markers MUC2, SPINK4, and SPDEF (data not shown). Alcian blue staining of xenografts showed no goblet cells in knockdown or control tumors (data not shown). Thus, in addition to promoting colon cancer growth, KIT may inhibit expression of enterocyte differentiation markers.
Figure 3.
KIT knockdown causes changes in gene expression in colon cancer cells. A) mRNA levels of the enterocyte differentiation markers KRT20 and CEACAM1 in DLD1 KIT knockdown tumors compared to vector control (n = 4 tumors/group; mean ± 95% CI shown). B and C) POP77 was transduced with KIT shRNA (shKit3, shKit4) or the empty vector and grown in vitro as organoids for 14 days. mRNA levels of enterocyte differentiation markers (B) and LGR5-associated genes (C) were assessed. See text for definition of LGR5-associated genes. D) UM-COLON#8 cells were transduced with KIT shRNA or empty vector, and grown subcutaneously in the flanks of NSG mice for 80 days. Single-cell PCR was performed on the tumorigenic CD44+GFP+ subpopulation. Each row indicates a single cell (n = 128 cells/group); each column indicates a single gene. The lower the Ct, the higher the mRNA expression. Thus, red indicates high expression (normalized Ct < mean), green indicates low (normalized Ct > mean), white indicates average expression (normalized Ct = mean), and grey indicates no expression. Unsupervised hierarchical clustering revealed a cluster of KIT+ cells in the control tumor (blue box) that has lower expression of LGR5 and the LGR5-associated transcript CD44. Markers of proliferation (MKI67, TOP2A, BIRC5) are indicated on the right. In the knockdown tumor, a cluster of LGR5+ cells coexpresses several LGR5-associated transcripts (e.g. PTPRO, LRIG1, CD44; purple box). E) Changes in expression and associated p-values for genes of interest from data shown in D). P-values were derived using the Wilcoxon rank-sum test. *, P < 0.05 in Student t test.
Published reports from our group and others describing gene expression in normal murine and human colon—both in bulk and at the single-cell level—have identified genes that are enriched in LGR5+ cell populations. These “LGR5-associated genes” are putative stem/progenitor markers and include CD44, AXIN2, OLFM4, PTPRO, LRIG1, BMI1, ASCL2, and CFTR5,16,20–22. Notably, other studies have shown that genes enriched in LGR5+ intestinal stem cells may be highly expressed in aggressive colon cancers21,23. Unexpectedly, in DLD1 xenografts, we found a >50% increase in the expression of CD44 upon KIT knockdown (Fig. S3). Levels of LGR5 itself and an LGR5-associated gene, AXIN2, remained unchanged (data not shown). Since the significance of stem-cell markers in cell lines is unclear, we investigated expression changes in LGR5-associated transcripts and other genes in xenografts. We knocked down KIT in the xenograft POP77 (Fig. S4A) and cultured organoids. Similar to DLD1 knockdowns, we saw increased expression of enterocyte markers KRT20, CEACAM1, and DPP4, and of the cyclin-dependent kinase inhibitor CDKN1A (Fig. 3B), which marks non-proliferating cells. Interestingly, there was again an increase in the expression of LGR5 and an LGR5-associated gene, OLFM4, upon KIT knockdown (Fig. 3C). Our DLD1 and POP77 findings led us to perform single-cell qRT-PCR analysis on an additional xenograft, UM-COLON#8, to understand gene changes in greater detail. We characterized the tumorigenic CD44+ population from control and KIT knockdown UM-COLON#8 xenografts14. We confirmed KIT knockdown at both the RNA and protein level (Fig. 3D, S4B), and performed unsupervised hierarchical clustering for genes of interest (Table S2)16,24.
We found that, in the control tumor, CD44+KIT+ cells did not express high amounts of LGR5 and had generally lower levels of the LGR5-associated genes CD44, PTPRO, and LRIG1 (Fig. 3D, blue box)16. Conversely, in the knockdown tumor, we observed a cluster of KIT− cells expressing high levels of LGR5, CD44, PTPRO, LRIG1, and BMI1 (Fig. 3D, purple box). This suggests that in UM-COLON#8, KIT and LGR5 are expressed in distinct subpopulations. As expected, the knockdown tumors also showed decreased expression of proliferation genes (MKI67, TOP2A, BIRC5), an increase in CDKN1A (Fig. 3D, E), and an increase in enterocyte markers (KRT20, DPP4, and CEACAM1). Together, our findings in DLD1, POP77, and UM-COLON#8 suggest that KIT promotes tumor growth in CD44+ cells while inhibiting the expression of enterocyte differentiation markers and LGR5-associated stem/progenitor-cell transcripts.
KIT signaling may occur in an autocrine or paracrine fashion in colon cancer
Pathogenic Kit signaling is implicated in several diseases (including GIST, leukemia, and melanoma), where an activating mutation in exons 9, 11, 13, or 17—which encode the juxtamembrane and kinase domains of Kit—causes constitutive Kit-signaling11,25–27. To assess whether KIT similarly promotes colon cancer growth via an activating mutation, we sequenced the aforementioned exons in DLD1, POP77, and UM-COLON#8 (Table S3) and found no mutations. This suggests that the trophic signal provided by KIT in colon cancer likely requires the presence of its ligand, KITLG.
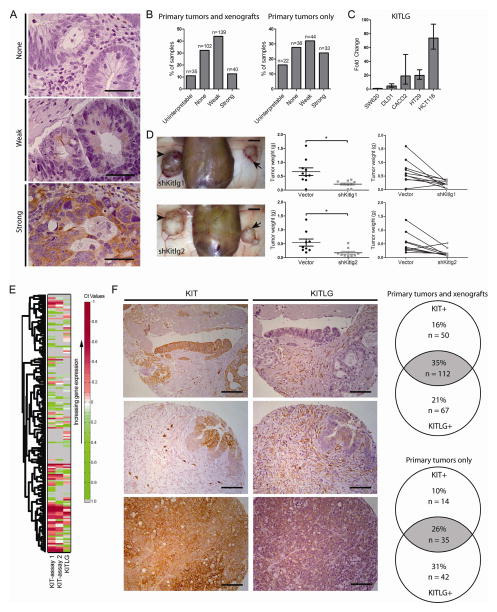
To assess expression of KITLG in colon cancer, we performed immunohistochemistry for KITLG with our tumor microarray (Fig. 4A). As with KIT, variable KITLG expression was observed, with 56% of primary tumors (and 57% of all tumor sections) exhibiting at least weak staining for KITLG (Fig. 4B). KITLG immunoreactivity was detected in the tumor cells, tumor stroma, or both. Using qRT-PCR, we also found that several different colon cancer cell lines express KITLG (Fig. 4C).
Figure 4.
KITLG may signal through KIT in an autocrine and/or paracrine loop. A) Our array of primary colon tumor and xenograft sections was immunostained for KITLG and scored for staining intensity (n = 316 total sections, 137 primary tumors only; bar = 50 μm). Arrows indicate knockdown tumors and arrowheads indicate control B) The number of primary tumors and xenografts for each score was tallied. C) KITLG mRNA levels in several colon cancer cell lines were determined (mean ± 95% CI shown). D) 1×10⁴ viable KIT knockdown DLD1 cells were injected into one flank of NSG mice, paired with control cells in the other flank. Arrows indicate KIT knockdown tumors and arrowheads indicate vector control tumors (left column panels; bar = 0.5 cm). KIT knockdown DLD1 tumors (n = 10 tumors/group) were weighed at post-injection day 30 (middle column panels, mean ± SE shown). The before-after plots (right column panels) show paired tumors from each mouse. E) Single-cell gene expression for tumorigenic CD44+ cells from UM-COLON#8 transduced with the empty vector show individual cells expressing KIT, KITLG, or both. Each row indicates a single cell (n = 128 cells/group), and each column indicates a single gene. F) Selected images from the tumor array demonstrating differences in KIT− and KITLG-staining tumor compartments (bar = 50 μm). The Venn diagram shows the proportion of tumor sections staining positive for KIT and/or KITLG out of all tumor sections (n = 316), or out of primary tumors only (n = 137). *, P < 0.05 in Student t test.
To determine whether KITLG-dependent signal transduction is responsible for KIT’s growth-promoting activity, we knocked down KITLG in DLD1 using two independent shRNAs (Table S1). shKitlg1 and shKitlg2 reduced mRNA levels by >80% (Fig. S5). In vivo, DLD1 KITLG knockdown cells generated smaller xenografts compared to empty vector control cells (Fig. 4D). We noted an average tumor weight reduction of 67% with DLD1 shKitlg1 cells, and 68% with DLD1 shKitlg2 cells (Fig. 4D), similar to the reductions observed with shKit. These findings suggest that KIT promotes growth through KITLG expression in the tumor. Interestingly, we did not see a reliable increase in the expression of enterocyte markers or LGR-associated genes upon KITLG knockdown as we had with KIT knockdown (data not shown). This could be because KIT and KITLG knockdowns lead to quantitative differences in Kit signaling, which may have different effects on growth versus transcription of the genes we assayed. Studies have shown that hypomorphic KIT alleles can have different phenotypes from KIT null alleles28,29.
To assess for a potential autocrine or paracrine effect, we reviewed our single-cell analysis of UM-COLON#8 and observed many individual cancer cells that highly co-expressed KIT and KITLG, as well as KIT+KITLG− and KIT-KITLG+ cells (Fig. 4E). Additionally, our tumor arrays, which were stained as serial sections, showed that KITLG immunostaining can be seen in KIT+ tumor cells, in adjacent KIT− tumor cells, or in the stroma. In total, 35% of all primary tumors and xenografts, and 26% when counting primary tumors only, costained for KIT and KITLG (Fig. 4F). This suggests that autocrine and paracrine KIT signaling may occur in tumors.
Imatinib inhibits growth of KIT+ colon cancers
We next asked whether imatinib, a clinically available RTK inhibitor with high-affinity for KIT, could inhibit the growth of KIT+ colon cancers. To test this in vitro, we dissociated POP77, a KIT+ xenograft that grows efficiently in vitro, to generate organoids. Treatment with imatinib at 10μM or higher decreased the size of POP77 organoids (Fig. 5A), and led to the appearance of membranous blebs suggestive of cell death (Fig. 5B). We found DLD1 to be inhibited by imatinib at similar concentrations, in agreement with previous studies (data not shown)12. To determine whether imatinib can also inhibit growth in vivo, we injected DLD1 cells into the flanks of NSG mice and treated the mice with 50 mg/kg/day imatinib for 10 days. After treatment, mice receiving imatinib had smaller tumors than mice receiving the vehicle control (Fig. 5C). We next treated luciferin-expressing UM-COLON#8 (UM-COLON#8-luc) tumors with imatinib for 14 days17. Using bioluminescent imaging, we found that imatinib-treated UM-COLON#8-luc tumors grew more slowly than untreated tumors even after discontinuation of imatinib (Fig. 5D).
KIT expression enriches for tumorigenic colon cancer cells
Finally, given KIT’s trophic role in colon cancer, we assessed whether KIT+ colon cancer cells may be more tumorigenic than their KIT− counterparts. We double-sorted DLD1 CD44+KIT+ and CD44+KIT− cells (>99% purity), and found that each gave rise to colonies containing KIT+ and KIT− subpopulations. FACS-sorted single KIT+ cells formed twice as many colonies as KIT− cells: 100 of 288 cells vs. 50 of 288 cells (Fig. 6A). This suggests that KIT enriches for clonogenicity.
We next compared the in vivo tumorigenic potential of CD44+Kit+ and CD44+Kit- cells from the patient-derived xenograft UM-COLON#8 by conducting limiting dilution experiments. Both CD44+KIT+ and CD44+KIT− cells could recapitulate the CD44 and KIT populations of the parental tumor (Fig. 6B). In agreement with our DLD1 clonogenicity data, CD44+KIT+ cells were more tumorigenic than CD44+KIT− cells, with a tumorigenic frequency of 1:402 vs. 1:2415, respectively (Fig. 6C).
Finally, we compared gene expression of CD44+KIT+ and CD44+KIT− cells at the single-cell level (Fig. 6D, Table S2). KITLG-expressing cells were found in both KIT+ and KIT− cells, again suggesting that KIT signaling may occur via autocrine/paracrine signaling. Additionally, the expression of several LGR5-associated transcripts was higher in the KIT− population, including LGR5, OLFM4, ASCL2, RNF43, CD44, and CFTR (Fig. 6D, E). Meanwhile, the CD44+KIT+ cells possessed higher levels of enterocyte markers, including KRT20, CEACAM1, and CA2. KIT therefore marks a distinct population of tumorigenic colon cancer cells that exhibit unexpectedly lower levels of LGR5-associated stem/progenitor-cell transcripts.
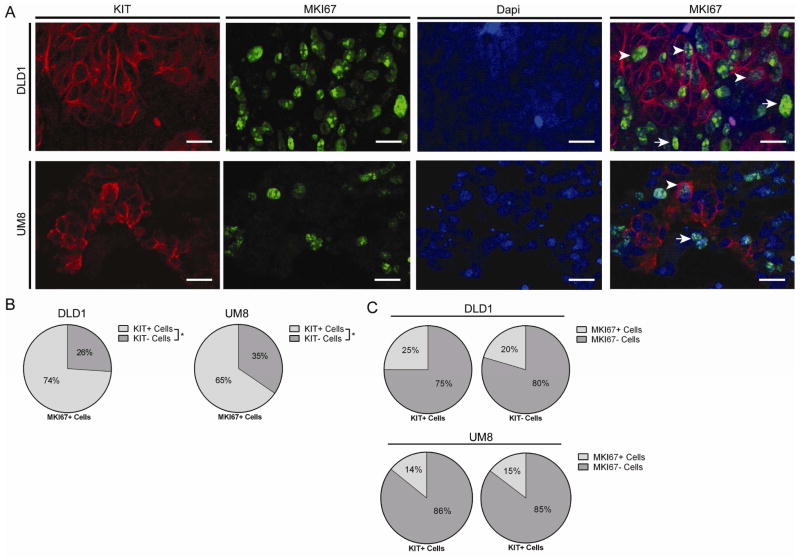
Interestingly, single-cell gene expression of MKI67, TOP2A, and BIRC5 showed that both CD44+KIT+ and CD44+KIT− populations contain cycling cells. This was confirmed by MKI67 immunostaining in proliferating KIT+ cells (Fig. 6F). To clarify the fraction of KIT+ and KIT− cells that are cycling, we conducted KIT and MKI67 co-immunostaining in sections of DLD1 and UM-COLON#8 xenografts (Fig. 7A). In both xenografts, we found that the MKI67+ (proliferative) cells were substantially more KIT+ than KIT-(Fig. 7B). However, equivalent proportions of KIT+ and KIT− cells are MKI67+, suggesting that KIT signaling is not required for proliferation (Fig. 7C).
Figure 7.
KIT+ and KIT− colon cancer cells contain cycling cells. A) DLD1 and UM-COLON#8 xenografts were immunostained for KIT (red), MKI67 (green), and Dapi (blue). DLD1 images demonstrating staining are shown. Arrows indicate KIT+/MKI67+ cells and arrowheads indicate KIT−/MKI67+ cells (bar = 25 μm). B) Proportion of MKI67+ cells that are KIT+ or KIT− (n = 12 high powered fields/tumor; mean shown). C) Proportion of KIT+ and KIT− cells that are MKI67+ (n = 12 high powered fields/group/tumor; mean shown). *, P < 0.05 in Student t test. n.s., not significant.
DISCUSSION
In this study, we used a colon cancer tumor microarray, cell lines, and patient-derived xenografts to show that a significant fraction of human colon tumors express the receptor tyrosine kinase KIT and its ligand KITLG, and that the KIT/KITLG signaling axis may promote growth, particularly in the tumorigenic CD44+ fraction. Such tumors could be targeted by KIT receptor tyrosine kinase inhibitors like imatinib30.
By immunostaining a tumor microarray, we confirmed that KIT and KITLG are expressed by a subset of colon cancers, frequently in the same cells. Notably, our finding that 50% of tumors displayed at least low KIT immunoreactivity is higher than some reported findings6,10, likely due to methodological differences (e.g., antigen retrieval, antibody used). However, our data are in line with a recently published proteogenomic analysis of a panel of human colorectal cancers, which showed that Kit is detected in 57 out of 95 samples9. Significantly, many tumors in our collection stained intensely for KIT in a subset of cells, reinforcing the idea that colon tumors exhibit heterogeneity of cell types that reflects normal developmental hierarchies16. Interestingly, we previously found using multivariate analysis of gene expression and outcomes in colon cancer that KIT expression does not predict clinical outcomes (data not shown). Furthermore, we remain uncertain why a subset of tumors expresses KIT, as KIT is not significantly amplified according to The Cancer Genome Atlas (data not shown). These are topics for further research.
Stable knockdown of KIT or KITLG significantly decreased the growth of colon cancer in vivo and in vitro, in cell lines and patient-derived human xenografts. Thus, KIT in colon cancer appears to have a functionally-important growth-promoting role through KITLG, either in an autocrine and/or paracrine manner as shown by our single cell gene expression analysis, and in agreement with previous in vitro studies in colon and other cancers18,31,32. This is surprising because KIT signaling currently has no known functional role in normal colonocytes33.
Although KIT+ cells are tumorigenic, because KIT− cells and KIT+ coexist in tumors, it remains possible that KIT+ cells function as “niche” cells for colon cancer stem cells, analogous to the role of KIT+ cells in the murine colon crypt base where they support LGR5+ stem cells. On the other hand, because KIT+ cells are highly tumorigenic and may receive a KITLG signal from adjacent cells (either within the tumor or from the stroma), our data are consistent with a model of cooperation between tumor subclones that has been previously reported in Wnt-driven murine mammary cancers, in which basal tumor cells were found to rely upon Wnt1 secreted by their luminal counterparts within the same tumor34.
We observed that KIT knockdown decreases proliferation and also increases expression of several enterocyte differentiation markers. In development, cessation of proliferation frequently leads to a coincident increase in differentiation marker expression. In small intestinal crypts, for instance, undifferentiated proliferating stem and progenitor cells give rise to mature cell types that cease dividing as they mature. A similar inverse relationship between MKI67 (a proliferation marker) and KRT20 (a differentiation marker) has been observed in colon cancer. Our findings thus reinforce the idea that tumors maintain features of normal development16.
Currently, the precise interrelationship between various markers of stem cells in the colon crypt base is unclear30. This is even less well understood in non-homeostatic conditions such as injury or cancer, where non self-renewing progenitor populations may somehow acquire stem-cell features35. Nevertheless, we observed that in cancer (as in normal murine colon) KIT-expressing cells are generally distinct from LGR5-expressing cells. Notably, CD44+KIT+ cells are highly tumorigenic even though they are relatively depleted for LGR5 and associated transcripts. This could be consistent with the finding that a non-LGR5 reserve stem cell population exists, and may be a secretory progenitor population36,37, which could give rise to tumors. In addition, our tumorigenicity and gene expression data suggest that LGR5-expression does not necessarily correlate with the aggressiveness of colon cancer, as others have suggested23. At this point, we do not know whether KIT signaling directly represses LGR5 expression, or vice versa.
In cancers where KIT drives tumor growth (e.g. GIST), KIT harbors an activating oncogenic mutation and signals constitutively. These tumors are dependent on this constitutive KIT signaling for their growth and therefore respond to Kit inhibitors. Other KIT+ tumors that may have activating KIT mutations (e.g., melanoma) but do not depend on KIT signaling for growth have not shown a dramatic clinical response to Kit inhibitors26. In colon cancer, where KIT is not significantly mutated, it would seem unlikely that KIT inhibition would have a major effect since the tumors are likely to employ redundant pathways to promote their growth. In support of this, we have seen that relatively high concentrations of imatinib are required to block growth of KIT+ colon cancer organoids in vitro, as has a previous study12. However, in light of our in vivo data, KIT signaling in colon cancer may play an underappreciated growth-stimulatory role, and could partially explain the beneficial effect of RTK inhibitors such as regorafenib. Thus, screening colon tumors for KIT expression may help identify patients who would benefit from Kit-inhibiting therapies.
In all, our findings support the use of Kit inhibitors for KIT+ colon cancers, and they highlight our need to better understand the role of receptor tyrosine kinases in colon cancer tumorigenesis.
Supplementary Material
Acknowledgments
Grant Support: NIH NIDDK K08-DK097181 (MR), NIH S10 Shared Instrumentation Grant 1S10RR02933801, NIH NINDS NS069375, HHMI Medical Research Fellowship (EC)
Footnotes
Disclosures: None.
Author Contributions:
ECC – Study design, data acquisition and analysis, manuscript revision, obtained funding
TK – Data analysis, statistical analysis, manuscript revision
TAK – Data acquisition, manuscript revision
SKG – Data acquisition
COB – Material support, manuscript revision
TAL – Material support, data acquisition and analysis
MvdR – Material support, data acquisition and data analysis, manuscript revision
SRQ – Material support
MFC – Study design, material support, obtained funding
MR – Study design, data acquisition and analysis, manuscript revision, material support, obtained funding
Publisher's Disclaimer: This is a PDF file of an unedited manuscript that has been accepted for publication. As a service to our customers we are providing this early version of the manuscript. The manuscript will undergo copyediting, typesetting, and review of the resulting proof before it is published in its final citable form. Please note that during the production process errors may be discovered which could affect the content, and all legal disclaimers that apply to the journal pertain.
References
- 1.Jemal A, Bray F, Center MM, Ferlay J, Ward E, Forman D. Global cancer statistics. CA Cancer J Clin. 2011;61:69–90. doi: 10.3322/caac.20107. [DOI] [PubMed] [Google Scholar]
- 2.Chu E. An update on the current and emerging targeted agents in metastatic colorectal cancer. Clin Colorectal Cancer. 2012;11:1–13. doi: 10.1016/j.clcc.2011.05.005. [DOI] [PubMed] [Google Scholar]
- 3.Grothey A, Van Cutsem E, Sobrero A, et al. Regorafenib monotherapy for previously treated metastatic colorectal cancer (CORRECT): an international, multicentre, randomised, placebo-controlled, phase 3 trial. Lancet. 2013;381:303–312. doi: 10.1016/S0140-6736(12)61900-X. [DOI] [PubMed] [Google Scholar]
- 4.Waddell T, Cunningham D. Evaluation of regorafenib in colorectal cancer and GIST. Lancet. 2013;381:273–275. doi: 10.1016/S0140-6736(12)62006-6. [DOI] [PubMed] [Google Scholar]
- 5.Rothenberg ME, Nusse Y, Kalisky T, et al. Identification of a cKit(+) colonic crypt base secretory cell that supports Lgr5(+) stem cells in mice. Gastroenterology. 2012;142:1195–1205.e6. doi: 10.1053/j.gastro.2012.02.006. [DOI] [PMC free article] [PubMed] [Google Scholar]
- 6.Reed J, Ouban A, Schickor FK, et al. Immunohistochemical staining for c-Kit (CD117) is a rare event in human colorectal carcinoma. Clin Colorectal Cancer. 2002;2:119–122. doi: 10.3816/CCC.2002.n.018. [DOI] [PubMed] [Google Scholar]
- 7.Bellone G, Smirne C, Carbone A, et al. KIT/stem cell factor expression in premalignant and malignant lesions of the colon mucosa in relationship to disease progression and outcomes. Int J Oncol. 2006;29:851–859. [PubMed] [Google Scholar]
- 8.Medinger M, Kleinschmidt M, Mross K, et al. c-kit (CD117) expression in human tumors and its prognostic value: an immunohistochemical analysis. Pathol Oncol Res. 2010;16:295–301. doi: 10.1007/s12253-010-9247-9. [DOI] [PubMed] [Google Scholar]
- 9.Zhang B, Wang J, Wang X, et al. Proteogenomic characterization of human colon and rectal cancer. Nature. 2014;513:382–387. doi: 10.1038/nature13438. [DOI] [PMC free article] [PubMed] [Google Scholar]
- 10.Yorke R, Chirala M, Younes M. C-Kit Proto-Oncogene Product is Rarely Detected in Colorectal Adenocarcinoma. J Clin Oncol. 2003;21:3885–6. doi: 10.1200/JCO.2003.99.213. discussion 3886–7. [DOI] [PubMed] [Google Scholar]
- 11.Miettinen M, Lasota J. KIT (CD117): a review on expression in normal and neoplastic tissues, and mutations and their clinicopathologic correlation. Appl Immunohistochem Mol Morphol. 2005;13:205–220. doi: 10.1097/01.pai.0000173054.83414.22. [DOI] [PubMed] [Google Scholar]
- 12.Attoub S, Rivat C, Rodrigues S, et al. The c-kit tyrosine kinase inhibitor STI571 for colorectal cancer therapy. Cancer Res. 2002;62:4879–4883. [PubMed] [Google Scholar]
- 13.Lennartsson J, Ronnstrand L. Stem cell factor receptor/c-Kit: from basic science to clinical implications. Physiol Rev. 2012;92:1619–1649. doi: 10.1152/physrev.00046.2011. [DOI] [PubMed] [Google Scholar]
- 14.Dalerba P, Dylla SJ, Park IK, et al. Phenotypic characterization of human colorectal cancer stem cells. Proc Natl Acad Sci U S A. 2007;104:10158–10163. doi: 10.1073/pnas.0703478104. [DOI] [PMC free article] [PubMed] [Google Scholar]
- 15.Ventura A, Meissner A, Dillon CP, et al. Cre-lox-regulated conditional RNA interference from transgenes. Proc Natl Acad Sci U S A. 2004;101:10380–10385. doi: 10.1073/pnas.0403954101. [DOI] [PMC free article] [PubMed] [Google Scholar]
- 16.Dalerba P, Kalisky T, Sahoo D, et al. Single-cell dissection of transcriptional heterogeneity in human colon tumors. Nat Biotechnol. 2011;29:1120–1127. doi: 10.1038/nbt.2038. [DOI] [PMC free article] [PubMed] [Google Scholar]
- 17.Willingham SB, Volkmer JP, Gentles AJ, et al. The CD47-signal regulatory protein alpha (SIRPa) interaction is a therapeutic target for human solid tumors. Proc Natl Acad Sci U S A. 2012;109:6662–6667. doi: 10.1073/pnas.1121623109. [DOI] [PMC free article] [PubMed] [Google Scholar]
- 18.Bellone G, Silvestri S, Artusio E, et al. Growth stimulation of colorectal carcinoma cells via the c-kit receptor is inhibited by TGF-beta 1. J Cell Physiol. 1997;172:1–11. doi: 10.1002/(SICI)1097-4652(199707)172:1<1::AID-JCP1>3.0.CO;2-S. [DOI] [PubMed] [Google Scholar]
- 19.Toyota M, Hinoda Y, Takaoka A, et al. Expression of c-kit and kit ligand in human colon carcinoma cells. Tumour Biol. 1993;14:295–302. doi: 10.1159/000217842. [DOI] [PubMed] [Google Scholar]
- 20.Munoz J, Stange DE, Schepers AG, et al. The Lgr5 intestinal stem cell signature: robust expression of proposed quiescent ‘+4’ cell markers. EMBO J. 2012;31:3079–3091. doi: 10.1038/emboj.2012.166. [DOI] [PMC free article] [PubMed] [Google Scholar]
- 21.Merlos-Suarez A, Barriga FM, Jung P, et al. The intestinal stem cell signature identifies colorectal cancer stem cells and predicts disease relapse. Cell Stem Cell. 2011;8:511–524. doi: 10.1016/j.stem.2011.02.020. [DOI] [PubMed] [Google Scholar]
- 22.van der Flier LG, van Gijn ME, Hatzis P, et al. Transcription factor achaete scute-like 2 controls intestinal stem cell fate. Cell. 2009;136:903–912. doi: 10.1016/j.cell.2009.01.031. [DOI] [PubMed] [Google Scholar]
- 23.Ziskin JL, Dunlap D, Yaylaoglu M, et al. In situ validation of an intestinal stem cell signature in colorectal cancer. Gut. 2013;62:1012–1023. doi: 10.1136/gutjnl-2011-301195. [DOI] [PubMed] [Google Scholar]
- 24.Kalisky T, Quake SR. Single-cell genomics. Nat Methods. 2011;8:311–314. doi: 10.1038/nmeth0411-311. [DOI] [PubMed] [Google Scholar]
- 25.Lasota J, Miettinen M. Clinical significance of oncogenic KIT and PDGFRA mutations in gastrointestinal stromal tumours. Histopathology. 2008;53:245–266. doi: 10.1111/j.1365-2559.2008.02977.x. [DOI] [PubMed] [Google Scholar]
- 26.Tsao H, Chin L, Garraway LA, Fisher DE. Melanoma: from mutations to medicine. Genes Dev. 2012;26:1131–1155. doi: 10.1101/gad.191999.112. [DOI] [PMC free article] [PubMed] [Google Scholar]
- 27.Price CJ, Green J, Kirsner RS. Mastocytosis in children is associated with mutations in c-KIT. J Invest Dermatol. 2010;130:639. doi: 10.1038/jid.2009.448. [DOI] [PubMed] [Google Scholar]
- 28.Rawls JF, Johnson SL. Temporal and molecular separation of the kit receptor tyrosine kinase’s roles in zebrafish melanocyte migration and survival. Dev Biol. 2003;262:152–161. doi: 10.1016/s0012-1606(03)00386-5. [DOI] [PubMed] [Google Scholar]
- 29.Reith AD, Rottapel R, Giddens E, et al. W mutant mice with mild or severe developmental defects contain distinct point mutations in the kinase domain of the c-kit receptor. Genes Dev. 1990;4:390–400. doi: 10.1101/gad.4.3.390. [DOI] [PubMed] [Google Scholar]
- 30.Gracz AD, Magness ST. Defining hierarchies of stemness in the intestine: evidence from biomarkers and regulatory pathways. Am J Physiol Gastrointest Liver Physiol. 2014;307:G260–73. doi: 10.1152/ajpgi.00066.2014. [DOI] [PMC free article] [PubMed] [Google Scholar]
- 31.Lahm H, Amstad P, Yilmaz A, et al. Interleukin 4 down-regulates expression of c-kit and autocrine stem cell factor in human colorectal carcinoma cells. Cell Growth Differ. 1995;6:1111–1118. [PubMed] [Google Scholar]
- 32.Krasagakis K, Fragiadaki I, Metaxari M, et al. KIT receptor activation by autocrine and paracrine stem cell factor stimulates growth of merkel cell carcinoma in vitro. J Cell Physiol. 2011;226:1099–1109. doi: 10.1002/jcp.22431. [DOI] [PubMed] [Google Scholar]
- 33.Medema JP, Vermeulen L. Microenvironmental regulation of stem cells in intestinal homeostasis and cancer. Nature. 2011;474:318–326. doi: 10.1038/nature10212. [DOI] [PubMed] [Google Scholar]
- 34.Cleary AS, Leonard TL, Gestl SA, Gunther EJ. Tumour cell heterogeneity maintained by cooperating subclones in Wnt-driven mammary cancers. Nature. 2014;508:113–117. doi: 10.1038/nature13187. [DOI] [PMC free article] [PubMed] [Google Scholar]
- 35.van Es JH, Sato T, van de Wetering M, et al. Dll1+ secretory progenitor cells revert to stem cells upon crypt damage. Nat Cell Biol. 2012;14:1099–1104. doi: 10.1038/ncb2581. [DOI] [PMC free article] [PubMed] [Google Scholar]
- 36.Tian H, Biehs B, Warming S, et al. A reserve stem cell population in small intestine renders Lgr5-positive cells dispensable. Nature. 2011;478:255–259. doi: 10.1038/nature10408. [DOI] [PMC free article] [PubMed] [Google Scholar]
- 37.Buczacki SJ, Zecchini HI, Nicholson AM, et al. Intestinal label-retaining cells are secretory precursors expressing Lgr5. Nature. 2013;495:65–69. doi: 10.1038/nature11965. [DOI] [PubMed] [Google Scholar]
Associated Data
This section collects any data citations, data availability statements, or supplementary materials included in this article.


