

Abstract
Cumulative evidence indicates that the onset and severity of Huntington's disease (HD) symptoms correlate with connectivity deficits involving specific neuronal populations within cortical and basal ganglia circuits. Brain imaging studies and pathological reports further associated these deficits with alterations in cerebral white matter structure and axonal pathology. However, whether axonopathy represents an early pathogenic event or an epiphenomenon in HD remains unknown, nor is clear the identity of specific neuronal populations affected. To directly evaluate early axonal abnormalities in the context of HD in vivo, we bred transgenic YFP(J16) with R6/2 mice, a widely used HD model. Diffusion tensor imaging and fluorescence microscopy studies revealed a marked degeneration of callosal axons long before the onset of motor symptoms. Accordingly, a significant fraction of YFP-positive cortical neurons in YFP(J16) mice cortex were identified as callosal projection neurons. Callosal axon pathology progressively worsened with age and was influenced by polyglutamine tract length in mutant huntingtin (mhtt). Degenerating axons were dissociated from microscopically visible mhtt aggregates and did not result from loss of cortical neurons. Interestingly, other axonal populations were mildly or not affected, suggesting differential vulnerability to mhtt toxicity. Validating these results, increased vulnerability of callosal axons was documented in the brains of HD patients. Observations here provide a structural basis for the alterations in cerebral white matter structure widely reported in HD patients. Collectively, our data demonstrate a dying-back pattern of degeneration for cortical projection neurons affected in HD, suggesting that axons represent an early and potentially critical target for mhtt toxicity.
Introduction
Huntington's disease (HD) is an autosomal dominant genetic disorder that results from mutations leading to abnormal expansion of a polyglutamine (polyQ) tract within the protein huntingtin (htt) (1). The polyQ tract length in mutant htt (mhtt) correlates with the onset of clinical symptoms and the extent of neuronal degeneration (1,2). Major clinical HD features include progressive development of behavioral disturbances, cognitive deterioration and motor abnormalities (3). Data from pathological studies and genetic experiments indicated that these symptoms result from dysfunction and degeneration of a subset of projection neurons within the cerebral cortex (CCX) and the striatum (ST) (1,3). Within the CCX, postmortem studies demonstrated that HD-vulnerable projection neurons localize to layers III–VI, yet little is known about the identity of those neuronal populations beyond their topographic location and hodology (4,5). Intriguingly, cortical and striatal interneurons are spared or mildly affected in HD, suggesting that cell type-specific characteristics, including the extent of axonal branching and metabolic load might contribute to the selective vulnerability of projection neurons (6). However, the full complement of factors mediating increased vulnerability of projection neurons to mhtt toxicity remains unknown (5,7).
For many years, the marked atrophy of the CCX and the ST observed in postmortem brains of advanced HD patients fueled the pursuit of mechanisms linking mhtt to activation of apoptosis and other forms of neuronal cell death (8). More recently, the generation of rodent HD models revealed earlier pathogenic events that better correlate with the onset of disease symptoms (7,9,10). Many studies utilized the well-characterized R6/2 mouse model, which expresses low levels of a transgene comprising exon 1 of human mhtt (11). Interestingly, a similar mhtt protein fragment is expressed in human HD brain tissue as a result of aberrant mhtt gene splicing (12). R6/2 mice and other available HD rodent models feature major HD hallmarks including the autosomal dominant pattern of disease inheritance, formation of microscopically visible mhtt aggregates and development of both motor and non-motor symptoms reminiscent of HD (9,10). Despite major variations in disease onset and severity, all mouse HD models analyzed to date invariably displayed behavioral abnormalities well prior to neuronal cell death, suggesting that symptoms might result from neuronal dysfunction or disconnection rather than loss of neurons (13). Supporting this concept, electrophysiological studies documented deficits in basal ganglia connectivity early in the course of pathology (14,15). Extending these observations, brain imaging-based approaches including diffusion tensor imaging (DTI) showed alterations in white matter integrity in presymptomatic HD patients, most notably within the corpus callosum (CC) (16–18). A cellular and structural basis for these alterations was not addressed by these studies, but pathological observations from unrelated reports collectively suggest that they might involve the atrophy of neurites (19–22), an early and distinctive pathogenic feature of neurons undergoing a dying-back pattern of degeneration (7,23). Despite this knowledge, a direct evaluation of axonal pathology in vivo remained to be performed for HD-relevant cortical neurons.
Transgenic mice with neuron-specific mosaic expression of fluorescent proteins have been widely used to evaluate axonal pathology in the context of several major neurological diseases. Yellow fluorescent protein (YFP) mice represent widely used mouse models, with various lines featuring unique, mosaic patterns of transgenic YFP expression (24). Because YFP is expressed in some, but not all neurons, alterations in the morphology and caliber of axons can be visualized and quantified (25). However, this selectivity in YFP expression requires careful selection of a specific YFP mice line, to assure that YFP is expressed in the neuronal population(s) of interest.
To evaluate axonal pathology directly in the context of HD, we generated YFP(J16)-R6/2 reporter mice. Results from DTI studies, fluorescence microscopic analysis and ultrastructural observations documented presymptomatic degeneration of callosal axons in these mice. Axonal degeneration directly correlated with age and mhtt polyQ tract length, did not result from loss of cortical neurons and was dissociated from microscopically visible mhtt aggregates. Further, results seen in these preclinical experiments were confirmed in human HD brain samples. Collectively, data derived from our studies here demonstrate a dying-back pattern of degeneration for cortical projection neurons affected in HD.
Results
Analysis of cortical YFP expression pattern in transgenic YFP mice
To evaluate axonal pathology in the context of HD, we first set out to generate YFP-R6/2 reporter mice featuring YFP-positive cortical neurons, as previously done for other animal models of neurodegenerative diseases (25). Using this type of approach, a recent study reported no obvious signs of axonal pathology in YFP(H)-R6/2 mice (26). However, YFP expression in the CCX of YFP(H) transgenic mice is mainly restricted to a small subpopulation of corticospinal neurons within layer V (24,27,28), leaving unclear whether axons that project from neurons in other cortical layers are affected. Further, the contribution of corticospinal neurons to HD pathology remains unreported. Because HD-affected cortical neurons are found in layers III–VI (4,29), we examined YFP expression in YFP(J16) mice, which display a much wider pattern of cortical YFP expression (Fig. 1) (24). The CC, a white matter structure largely composed of axons emanating from cortical projection neurons, featured much stronger YFP expression in YFP(J16) mice than in YFP(H) mice (compare Fig. 1A and B). Accordingly, YFP-positive neurons were broadly distributed from layers III–VI of the CCX in YFP(J16) mice (Fig. 1D), but narrowly confined to layer V in YFP(H) mice (Fig. 1C). Highlighting the heterogeneity of neuronal cell types within a single cortical layer, YFP-positive cell bodies in layer V were smaller in YFP(J16) mice than in YFP(H) mice, and featured less prominent apical dendrites. As expected from prior studies, most YFP-positive cortical neurons in YFP(H) mice co-localized with Ctip2, a transcription factor that, within the cortex, is selectively expressed in corticospinal pyramidal neurons (28,30) (Fig. 1E). In contrast, little YFP/Ctibp2 co-localization was observed in the cortex of YFP(J16) mice (Fig. 1G). The involvement of intratelencephalic callosal projection neurons in HD prompted us to evaluate YFP co-localization with the transcription factor marker SATB2 (30,31). As expected, minimal YFP/SATB2 co-localization was observed in YFP(H) mice cortex (Fig. 1F). However, many YFP-positive cortical neurons co-localized with SATB2 in the cortex of YFP(J16) mice (Fig. 1H). Based on these results, we concluded that, in terms of cellular topography and molecular profiling, HD-vulnerable cortical neurons are better represented in YFP(J16) mice than in YFP(H) mice.
Figure 1.

Analysis of YFP expression in the CCX of YFP(H) and YFP(J16) transgenic mice. Confocal microscopic images (10×) showing portions of the CCX, the CC and the ST illustrate major differences in the pattern and levels of YFP fluorescence between YFP(H) (A) and YFP(J16) mice brains (B). At higher magnification (25×), confocal images show that YFP expression in the CCX of YFP(H) mice is limited to a subset of corticospinal neurons located in layer V (C). In contrast, the pattern of YFP expression is much broader in the CCX of YFP(J16) mice, also comprising cortical neurons in layers III–VI (D). In YFP(H) mice, nearly all YFP-positive cortical neurons (pseudo-colored in green) co-localized with the corticospinal projection neuron marker Ctip2 (arrows) (E), but only few co-localized with the callosal projection neuron marker SATB2 (in red) (F). Conversely, little YFP-Ctip2 co-localization was observed in the CCX of YFP(J16) mice (G). Instead, most YFP-positive neurons in these mice co-localized with SATB2 (H), indicating that an important fraction of YFP-positive cortical neurons in the CCX of YFP(J16) mice corresponds to callosal projection neurons. Scale bars: 100 µM (A, B), 20 µM (C–H).
Generation and characterization of YFP(J16)-R6/2 reporter mice
Having established that the pattern of cortical YFP expression in YFP(J16) mice significantly overlaps with the topographic distribution of HD-vulnerable cortical neurons in humans, we generated YFP(J16)-R6/2 mice. To avoid confounding effects associated with contraction/expansion of the polyQ tract within mhtt across generations, we crossed YFP(J16)+/+ male mice with ‘R6/2(160Q) ovary’ female mice. These mice have a wild-type phenotype, but bear ovaries transplanted from R6/2 mice expressing a mhtt exon I transgene with a polyQ tract of 160(+/–5) glutamine repeats [R6/2(160Q) mice]. The genotype of littermates obtained from this breeding above was either YFP(J16)+/− (henceforth, ‘YFP(J16) mice’) or YFP(J16)+/−-R6/2(160Q) (henceforth, ‘YFP(J16)-R6/2(160Q) mice’).
Reports of axonal pathology associated with YFP expression in YFP(H) mice (32) prompted us to evaluate whether YFP expression, as featured in YFP(J16) mice, could modulate (i.e. worsen) the severity and/or onset of motor deficits characteristic of R6/2(160Q) mice. Toward this end, a well-characterized rotarod test was performed at ages P30, P60 and P75 (Supplementary Material, Fig. S2). At age P30, no differences in rotarod performance were observed among experimental groups. At age P60, R6/2(160Q) mice showed a significant reduction in rotarod performance compared with both naive and YFP(J16) mice (52.7 ± 5.8 versus 90.5 ± 8.8 and 93.3 ± 8 s, respectively; n = 6 mice per genotype; P < 0.05), and these differences become more pronounced at age P90 (35.5 ± 6.6 versus 102.7 ± 8.7 and 96.9 ± 13 s, respectively; P < 0.001). Similarly, YFP(J16)-R6/2(160Q) mice showed reduced rotarod performance when compared with both naive and YFP(J16) mice at age P60 (55.4 ± 7.8 versus 90.5 ± 8.8 and 93.3 ± 8 s, respectively; P < 0.05), and these differences were larger at P90 (40.3 ± 6.1 versus 102.7 ± 8.7 and 96.9 ± 13 seconds, respectively; P < 0.001). No statistically significant differences in rotarod performance were observed between naive and YFP(J16) mice or between R6/2(160Q) and YFP(J16)-R6/2(160Q) mice at all ages analyzed. These data indicated that YFP overexpression, as featured in YFP(J16) mice, did not significantly affect the onset or severity of R6/2(160Q) motor symptoms up to age P75. Based on these data, we also deemed YFP(J16)-R6/2(160Q) mice at age P30 as presymptomatic, P60 as symptomatic and P75 or older as advanced symptomatic throughout this study.
Presymptomatic degeneration of callosal axons in YFP(J16)-R6/2(160Q) mice
To detect early signs of axonal pathology independent of YFP expression, we first performed DTI studies ex vivo (33). Diffusion tensor color maps were obtained for YFP(J16) and YFP(J16)-R6/2(160Q) fixed mouse brains obtained at presymptomatic age P30 (Fig. 2A and B). Medium fractional anisotropy (mFA) values obtained by DTI represent a measure of water diffusion within cellular structures and are commonly used as indirect reporters of white matter integrity (34). Reduced mFA values were observed for the CC of YFP(J16)-R6/2(160Q) mice, compared with age-matched YFP(J16) mice (0.35 ± 0.086 versus 0.46 ± 0.09; n = 3 per genotype; P < 0.05) (Fig. 2C). This finding suggested that alterations in CC integrity and/or organization occur very early in the course of R6/2 pathology and was consistent with reports from DTI studies in presymptomatic HD patients (17,18,35).
Figure 2.

YFP(J16)-R6/2(160Q) mice feature presymptomatic alterations in CC integrity. Diffusion tensor color maps of YFP(J16) (A) and YFP(J16)-R6/2(160Q) mice (B) at presymptomatic age P30 revealed structural alterations in the CC (white arrows). (C) Quantitative data showed reduced mFA values for the CC of YFP(J16)-R6/2(160Q) mice, compared with YFP(J16) mice (*P < 0.05; n = 3 per experimental group). (D) A confocal microscopy image of the CC of YFP(J16) mice shows a homogeneous pattern of YFP fluorescence (yellow), a neat parallel organization of callosal axons and an aligned distribution of 4',6-diamidino-2-phenylindole-stained callosal glia nuclei (blue). (E) In contrast, some areas of the CC showed reduced levels of YFP fluorescence (delineated by dashed lines) in YFP(J16)-R6/2(160Q) mice, and callosal axons appear less organized overall. In addition, callosal glia nuclei displayed a more scattered distribution and abnormal morphology, compared with that of YFP(J16) mice. Scale bars in D–E: 10 µM.
To provide a structural basis for the alterations in white matter integrity above, we performed detailed confocal microscopic analysis of YFP-positive axonal fibers within the CC. In YFP(J16) mice, the intensity of callosal YFP fluorescence was homogeneous, revealing a neat pattern of axons running in parallel that was highlighted by the aligned pattern of distribution of callosal glial nuclei (Fig. 2D). On the other hand, YFP-positive callosal axons of YFP(J16)-R6/2(160Q) mice displayed a less organized pattern, as evidenced by a more scattered distribution of callosal glial nuclei, which also displayed morphological alterations compared with YFP(J16) mice (Fig. 2E). Further, some areas within the CC of YFP(J16)-R6/2(160Q) mice displayed reduced levels of YFP fluorescence suggestive of axonal pathology (dashed areas in Fig. 2E).
Degeneration of callosal axons in YFP(J16)-R6/2(160Q) mice is age and polyQ tract length dependent
Based on findings from our own DTI studies above, we performed quantitative fluorescence microscopy studies aimed at evaluating the effect of aging on callosal axon pathology (Fig. 3). In YFP(J16) mice, the CC showed even levels of YFP fluorescence and a similar pattern of axonal organization throughout all the ages analyzed (Fig. 3A). In contrast, YFP fluorescence levels were progressively reduced with increasing age in the CC of YFP(J16)-R6/2(160Q) mice (Fig. 3B), and by P60, most callosal axons appeared severely degenerated. In YFP(J16) mice, some axonal swellings were occasionally seen at P90, but similar ones were observed at age P30 in YFP(J16)-R6/2(160Q) mice (arrows in Fig. 3A and B). Quantitative fluorescence analysis confirmed these observations, showing age-dependent reductions in callosal YFP fluorescence levels for YFP(J16)-R6/2(160Q) mice, compared with YFP(J16) mice at all the ages analyzed (P30: 98 890 ± 4394 versus 11 7608 ± 3917 pixels, P < 0.05; P60: 67 421 ± 2947 versus 80 966 ± 2092 pixels, P < 0.01; P90: 57 007 ± 2897 versus 75 786 ± 2191 pixel, P < 0.001; n = 3 mice per genotype) (Fig. 3C). These data indicated that callosal axon degeneration represents an early, presymptomatic pathogenic event associated with mhtt toxicity in vivo, which progressively worsens with aging.
Figure 3.

Age-dependent degeneration of callosal axons in YFP(J16)-R6/2(160Q) mice. (A) In YFP(J16) mice, confocal microscopic images of the CC showed even levels of YFP fluorescence and a consistent pattern of callosal axon organization from ages P30 to P90. (B) In contrast, YFP fluorescence levels were reduced, and the fibrillar pattern of YFP fluorescence was gradually lost as YFP(J16)-R6/2(160Q) mice aged. By age P90, callosal axons appeared severely degenerated. Axonal swellings (white arrows), which were observed at P90 in YFP(J16) mice, become conspicuous at P30 in YFP(J16)-R6/2(160Q) mice. (D) Consistent with the pathophysiology of HD, axonal degeneration was less pronounced in YFP(J16)-R6/2(120Q) mice than in YFP(J16)-R6/2(160Q) mice. (C) Quantitative data show YFP fluorescence levels for YFP(J16) mice (control, solid gray bars, n = 3), YFP(J16)-R6/2(120Q) mice (120Q, vertical dashed bars, n = 3) and YFP(J16)-R6/2(160Q) (160Q, horizontal dashed bars, n = 3). *P < 0.05, **P < 0.01. Scale bar: 10 µM.
Within a certain range, the onset of symptoms inversely correlates with mhtt polyQ tract length in R6/2 mice and in HD (1,2). To evaluate the impact of mhtt polyQ tract length on callosal axon degeneration, we generated YFP(J16)-R6/2(120Q) mice, which express mhtt with a polyQ tract length of 120 ± 5 glutamines. As expected from the pathophysiology of HD, reductions in callosal YFP fluorescence levels were less pronounced in YFP(J16)-R6/2(120Q) mice than in YFP(J16)-R6/2(160Q) mice (Fig. 3D). When compared with YFP(16) mice, quantitative data showed that these reductions only became significant at P90 [YFP(16): 75 786 ± 2191 versus YFP(J16)-R6/2(120Q) 60 667 ± 13 653 pixels; n = 3 mice per genotype; P < 0.05] (Fig. 3C). Thus, the severity of callosal axon degeneration in R6/2 mice was increased with mhtt polyQ tract length.
Next, we performed studies aimed at determining whether the reductions in YFP fluorescence intensity shown in Figures 2 and 3 reflected alterations in axonal structure, and not mere alterations in YFP distribution. To this end, we performed immunostaining of the CC using SMI-31 antibody against axonal neurofilament heavy chain subunits (NFs), a major constituent of the axonal cytoskeleton (Fig. 4). As observed for YFP (Figs 2D and 3A), a fibrillar pattern of SMI-31 immunoreactivity was observed in the CC of YFP(J16) mice at P90 (Fig. 4A). However, this pattern was progressively lost in YFP(J16)-R6/2(160Q) mice with increasing age (Fig. 4B). In sagittal sections of the CC, the pattern of YFP fluorescence further suggested a reduction in the caliber of callosal axons of YFP(J16)-R6/2(160Q) mice, compared with YFP(J16) mice (Fig. 4C). Electron microscopic images confirmed this observation (Fig. 4D), with quantitative data showing a reduction in mean callosal axon caliber of YFP(J16)-R6/2(160Q), compared with YFP(J16) mice (10.47 ± 6.9 versus 20.3 ± 9.2 µm2; n = 3 mice and 1500 axons per genotype) (Fig. 4E). Together, these data validated YFP fluorescence as a marker of axonal integrity, further suggesting that YFP-positive callosal axons in YFP(J16) mice serve as reporters of a much larger callosal axon population.
Figure 4.

Reductions in YFP fluorescence levels in YFP(J16)-R6/2(160Q) mice reflect axonal pathology. (A) In coronal brain sections, SMI-31 antibody against neurofilament heavy chain subunits shows a fibrillar staining pattern for callosal axons of YFP(J16) mice up to age P90. (B) But in YFP(J16)-R6/2(160Q) mice, this fibrillar pattern is lost in an age-dependent manner, much as seen for YFP fluorescence (compare with Fig. 3A and B). (C) Confocal images show YFP fluorescence in sagittal sections of the CC at age P90. Compared with YFP(J16) mice, YFP(J16)-R6/2(160Q) mice displayed a marked reduction in YFP fluorescence levels, and an apparent reduction in the caliber of YFP-positive axons. (D) EM images of the CC confirmed this observation, thus validating YFP fluorescence levels as a reporter of axonal integrity. (E) The mean caliber of callosal axons was significantly reduced in YFP(J16)-R6/2(160Q) mice, compared with YFP(J16) mice (n = 3 mice, 1500 axons per experimental group); ***P < 0.001. All scale bars are 10 µM.
Callosal axon degeneration does not associate with loss of neuronal cell bodies
Next, we evaluated whether degeneration of callosal projection neuron axons in YFP(J16)-R6/2(160Q) mice was associated with concurrent degeneration and/or loss of YFP-positive neuronal cell bodies in the CCX (Fig. 5). Compared with YFP(J16) mice, a marked reduction in YFP fluorescence was observed in the cortical neuropil of YFP(J16)-R6/2(160Q) mice as early as age P30 (dashed area in Fig. 5A). Despite these changes, quantitation of YFP-positive neuronal cell bodies revealed similar numbers between YFP(J16) and YFP(J16)-R6/2(160Q) mice (P30: 32 ± 5 versus 31 ± 12; P60: 33 ± 7 versus 30 ± 8; P90: 32 ± 9 versus 32 ± 11; n = 3 per genotype and age) at P30 (Fig. 5B). Taken together, these results indicate that cortical projection neurons affected by mhtt follow a dying-back pattern of degeneration.
Figure 5.

Callosal axon degeneration does not result from loss of neuronal cell bodies. (A) Representative confocal microscopic images (40×) of YFP(J16) and YFP(J16)-R6/2(160Q) mice CCX (layers III–V) at ages P30, P60 and P90. A marked reduction in YFP fluorescence levels was observed for the cortical neuropil (for example, the areas delimited by dashed lines) at all the ages analyzed. (B) Quantitation of YFP-positive neuronal cell bodies revealed similar numbers for YFP(J16) (control, solid gray bars, n = 3) and YFP(J16)-R6/2(160Q) mice (160Q, horizontal dashed bars, n = 3) at all the ages analyzed. Scale bar: 10 µM.
Mutant htt aggregates are spatially and temporally segregated from degenerating axons
The formation of microscopically visible mhtt aggregates represents an HD hallmark reproduced in R6/2 mice and other HD rodent models (36). The contribution of mhtt aggregates to HD pathogenesis remains a matter of debate (37), but they have been proposed to promote axonal pathology by interfering with axonal transport (38,39), a process critical for the maintenance of axonal connectivity (23). Using the well-characterized EM48 antibody (40), we evaluated temporal and spatial correlations between degenerating callosal axons and mhtt aggregates in YFP(16)-R6/2(160Q) mice (Fig. 6). At age P30, few mhtt aggregates were observed in the CCX (Fig. 6A, left panel). Although signs of callosal axon degeneration were evident at this age (Figs 2E and 3B), mhtt aggregates were not seen in the CC (Fig. 6A, right panel). At P90, abundant mhtt aggregates were found in the CCX (Fig. 6B, left panel), but again, little EM48 immunoreactivity was observed in the CC (Fig. 6B, right panel), suggesting that in YFP(J16)-R6/2(160Q) mice, callosal axons undergoing degeneration are temporally and spatially segregated from microscopically visible, EM48-positive mhtt aggregates.
Figure 6.
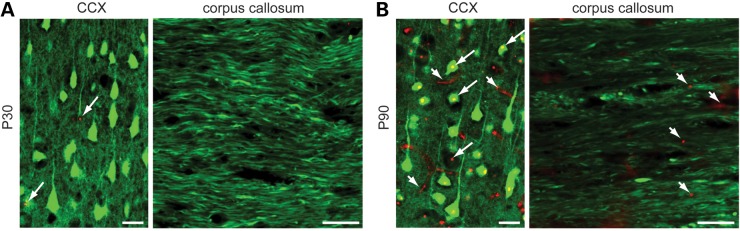
Mutant huntingtin aggregates are spatially and temporally segregated from degenerating callosal axons. Merged confocal images obtained from YFP(J16)-R6/2(160Q) mice show YFP fluorescence (pseudo-colored in green) and mhtt immunoreactivity (in red), as revealed by EM48 monoclonal antibody. (A) At presymptomatic age P30, a few mhtt aggregates (arrowheads) were observed in the CCX. Although signs of callosal axon pathology were evident at this age (see Fig. 3B), no mhtt aggregates were observed in the CC. (B) At age P90, abundant nuclear (long arrows) and neuritic (short arrows) mhtt aggregates were found in the CCX, but only occasional ones were found in the CC (short arrows). All scale bars: 10 µM.
Differential vulnerability of specific axonal tracts in R6/2 mice
The marked degeneration of callosal axons observed in YFP(J16)-R6/2(160Q) mice contrasted sharply with the lack of axonal pathology reported for YFP-positive corticospinal neurons of YFP(H)-R6/2 mice (26), prompting us to examine axonal degeneration in other white matter structures (Fig. 7). Consistent with a recent report (41), no obvious alterations were observed in optic nerve tract (ONT) axons of YFP-R6/2(160Q) and YFP mice at symptomatic age P60 (Fig. 7A). Similarly, these observations extended to YFP-positive axons within the lateral funiculi of the spinal cord (dorsolumbar level) (Fig. 7B) and sciatic nerves (Fig. 7C). Quantitation of YFP fluorescence levels mostly confirmed these observations (Fig. 7A'–C'). Only at age P90, a statistically significant reduction in YFP fluorescence levels was observed for spinal cord axons of YFP(J16)-R6/2(160Q) mice, compared with YFP(J16) mice (68 773 ± 3976 versus 43 676 ± 3976 pixels; P < 0.05; n = 3 per group) (Fig. 7B'). Together, these studies revealed differential vulnerability of specific axonal tracts in the R6/2(160Q) mouse model, with callosal axons being affected earlier and to a much larger extent than spinal cord axons.
Figure 7.

Differential vulnerability of axons in YFP(J16)-R6/2(160Q) mice. Confocal microscopic images (63×) show YFP-positive axons within the ONT (A), the lateral funicular region of the spinal cord (B) and sciatic nerves (C) of YFP(J16) and YFP(J16)-R6/2(160Q) mice at symptomatic age P60. Plots in A'–C' show YFP fluorescence levels for these white matter structures at ages P30, P60 and P90 (n = 3 per genotype). Unlike the CC (see Fig. 3), axons within the ONT and the sciatic nerve show similar YFP fluorescence levels for both experimental groups at all the ages analyzed. However, a small decrease was observed for spinal cord axons at late symptomatic age P90 (*P < 0.05). Scale bars: 10 µM.
Analysis of callosal axon pathology in human HD
To evaluate the relevance of findings from YFP(J16)-R6/2(160Q) mice to HD, we evaluated callosal axon pathology in the brains of HD patients using SMI-31 antibody against axonal NFs (Table 1 and Fig. 8). As observed for YFP(J16)-R6/2(160Q) mice (see Fig. 3A and B), coronal sections of the CC's genu revealed a marked change in the pattern of callosal SMI-31 immunoreactivity from fibrillar in control brains, to dot-like in HD brains (Fig. 8A, left panels). Also as seen for YFP fluorescence in YFP(J16)-R6/2(160Q) mice (see Fig. 4C), sagittal sections of the CC showed reduced SMI-31 immunoreactivity in HD brains, compared with control cases (Fig. 8A, right panels). In contrast, no obvious alterations were observed for axons within the ONT between control and HD brains (Fig. 8B), demonstrating increased vulnerability of specific axonal tracts in HD. Quantitative data in Figure 8C indicated that SMI-31 immunoreactivity ratios between the CC and the ONT (CC/OTN SMI-31 IR) were reduced in HD cases, compared with controls (0.5 versus 1.07; P < 0.04). Also consistent with observations from YFP(J16)-R6/2(120Q) mice (Fig. 3C and D), a Pearson's test showed a statistically significant correlation between polyQ tract length and CC/OTN SMI-31 IR (r = –0.85) (Fig. 8D). Together, these data indicated that the increased vulnerability of callosal axons observed in YFP(J16)-R6/2(160Q) mice represents an HD-relevant event, further suggesting a correlation between polyQ tract length in mHtt and the degree of callosal axon degeneration.
Table 1.
Summary of case demographics
| CAG (n) | Age (years) | PMI (h) | HD onset (age) | Grade | Clinical severity | ||
|---|---|---|---|---|---|---|---|
| Control cases | |||||||
| Case 45 | (M) | NA | 57 | 6.3 | |||
| Case 50 | (M) | NA | 72 | 7.0 | |||
| Case 35 | (M) | NA | 61 | 16.0 | |||
| HD cases | |||||||
| Case 69 | (M) | 42 | 64 | 12.0 | 30 (1976) | 3 | Chorea: moderate |
| Dysphagia: mild | |||||||
| Dystonia: moderate | |||||||
| MMSE: 18/30 | |||||||
| HRSFD: NA | |||||||
| Case 85 | (F) | 63 | 63 | 12.4 | 44 (1995) | 2 | Chorea: mild |
| Dysphagia: mild | |||||||
| Dystonia: moderate | |||||||
| MMSE: 23/30 | |||||||
| HRSFD: 13 | |||||||
| Case 87 | (F) | 51 | 43 | 5.0 | 34 (2002) | 3 | Chorea: moderate |
| Dysphagia: severe | |||||||
| Dystonia: mild | |||||||
| MMSE: 22/30 | |||||||
| HRSFD: 4 | |||||||
M, Male; F, Female; PMI, postmortem interval; Grade, neuropathological grade as described in Ref. (42); MMSE, mini-mental state examination; HRSFD, Hamilton Rating Scale for Depression; NA, Not available.
Figure 8.

Increased vulnerability of callosal axons in HD brains. (A) Representative images corresponding to coronal and sagittal sections of the CC's genu show reduced SMI-31 immunoreactivity in the CC of human HD cases, compared with controls (n = 3 per group, cases 45 and 85 are shown, see Table 1 for case demographics), suggesting a marked loss of callosal axons in HD. (B) In contrast, the pattern of SMI-31 immunoreactivity in the ONT remained largely unchanged. (C) Quantitative immunofluorescence data showed reduced ratios of callosal (CC) to ONT SMI-31 immunoreactivity (IR) in HD brains, compared with control cases (*P < 0.05). (D) A Pearson's test shows a statistically significant correlation between mhtt polyQ tract length and CC/OT SMI-31 immunoreactivity ratios for HD cases analyzed in this study (r = –0.85). Scale bar: 50 µM.
Discussion
In recent years, a consensus has emerged that pathogenic events underlying the cognitive and motor changes characteristic of HD long precede neuronal cell death (7,43,44). Accordingly, thorough analyses of R6/2 mice and other rodent HD models consistently revealed an early neuronal disconnection associated with mHtt expression, which manifests as a variety of behavioral (10,45) and electrophysiological deficits (14,15). The cellular basis of these deficits remained unknown, but data from several independent reports suggested that progressive atrophy of neurites might play a major role. For example, mhtt was shown to promote degeneration of neurites in cultured neuronal cell lines (46). Our studies here suggested a marked degeneration of cortical neuropil in R6/2 mice that was also observed in HD brains (19,21,22,47,48). Further, numerous reports from brain imaging studies in presymptomatic HD patients documented alterations in axon-rich white matter brain structures, most notably the CC, that directly correlated with the severity of cognitive deficits (16–18,43,49). Thus, multiple independent lines of evidence suggested that neurite degeneration represents an early and important pathologic event that long precedes neuronal cell death in HD. However, a temporal relationship between these pathogenic events was not directly documented for HD-relevant neurons in vivo.
YFP-expressing transgenic mouse lines have been used to address axonal pathology in the context of diverse neurological disorders (25). Recently, Marangoni et al. (2014) reported no obvious signs of axonal pathology for YFP-positive neurons in YFP(H)-R6/2 mice (26). However, the limited pattern of YFP expression in YFP(H) mice left the fate of axons from cortical neurons known to be affected in HD unclear (27,28,50). To circumvent this limitation, we crossed ‘R6/2(160Q) ovary’ mice with YFP(J16) mice, resulting in a wider pattern of cortical YFP expression (24). In HD, neuronal degeneration in the cortex includes pyramidal projection neurons within layers III–VI, many of which project axons that pass through the CC and end route to the contralateral cortex (4,5,29). Accordingly, YFP-positive neurons in the cortex of YFP(J16) were found to express the callosal projection neuron marker SATB2 (30). Rotarod tests further confirmed that YFP expression, as featured in YFP(J16) mice, did not affect the onset or severity of motor deficits characteristic of R6/2(160Q) mice. Together, these studies validated the use of YFP(J16)-R6/2(160Q) mice for the study of HD-related axonal pathology in vivo.
DTI studies of presymptomatic YFP(J16)-R6/2(160Q) mice first revealed alterations in axon-rich white matter microstructure independent of YFP expression. Compared with YFP(J16) mice, YFP(J16)-R6/2(160Q) mice showed reduced mFA values for the CC, a finding consistent with results from brain imaging studies in living, presymptomatic HD patients (17). Providing a cellular basis for these alterations, detailed confocal fluorescence microscopic analysis of the CC revealed alterations in the morphology and organization of YFP-positive axons. Indeed, callosal axons of YFP(J16)-R6/2(160Q) mice appeared disorganized and featured occasional axonal swellings as early as age P30. At symptomatic age P60, the fibrillar organization of callosal axons was markedly lost, and by P90, most axons appeared severely degenerated. Axonal swellings were observed in YFP(J16) mice at a much later age (P90), but the lack of motor phenotype in these mice left their pathological relevance unclear (51). Notably, callosal glia nuclei featured morphological alterations in the CC of YFP(J16)-R6/2(160Q) mice, compared with YFP(J16) mice. A recent study showed callosal axon pathology in transgenic mice featuring oligodendrocyte-specific mHtt expression (52), but additional studies are needed to determine the contribution of glial cells to axonal degeneration in HD.
Quantitative studies revealed age-dependent reductions in YFP fluorescence levels for callosal axons of YFP(J16)-R6/2(160Q) mice, compared with YFP(J16) mice, suggestive of axonal degeneration. These studies also indicated that callosal axon degeneration was less severe in YFP(J16)-R6/2(120Q) than in YFP(J16)-R6/2(160Q) mice, a finding consistent with results from studies in HD brains in this study. Although more HD cases need to be analyzed to establish definite conclusions, a significant correlation was observed between polyQ tract length in mHtt and the degree of callosal axon degeneration. Together, these data suggest that polyQ tract expansion confers upon mhtt a toxic effect particularly critical for the maintenance of axonal connectivity.
Validating the use of YFP as a reporter of axonal pathology, reduced YFP fluorescence levels were associated with alterations in the pattern of neurofilaments, major components of the axonal cytoskeleton (53). Accordingly, a dramatic reduction in mean callosal axon caliber was revealed by both confocal fluorescence and electron microscopy. Together, these studies indicated that degeneration of callosal axons represents a very early pathogenic event in R6/2(160Q) mice, providing a structural basis for findings obtained from prior brain imaging studies in this animal model (54).
Analysis of YFP-positive neurons in the CCX of YFP(J16)-R6/2(160Q) mice indicated that callosal axon degeneration did not result from loss of neuronal cell bodies in the cortex. Consistent with the reports of early alterations in cortical gray matter structure in HD (21), these studies instead documented a marked reduction of YFP fluorescence derived from the cortical neuropil. Accordingly, a recent report correlated a reduction in the thickness of the R6/2 mouse cortex that involved increased density, but not reduced numbers, of cell bodies (54). When considered together, these observations suggest that neuritic connections might represent a significant fraction of brain tissue lost in HD, and that cortical neurons vulnerable to mhtt toxicity degenerate following a dying-back pattern (7,23,55).
Consistent with the reports of differential mhtt toxicity (5,7,56), fluorescence microscopic analysis of additional white matter tracts in YFP(J16)-R6/2(160Q) mice revealed differential vulnerability of axonal fibers. Indeed, axons within the ONT and the sciatic nerve of YFP(J16)-R6/2(160Q) mice displayed no obvious signs of degeneration, even at late symptomatic age (41). However, spinal cord axons of YFP(J16)-R6/2(160Q) mice displayed some signs of pathology at late symptomatic age P90. Thus, axonal pathology likely represents a feature common to several neuronal cell types, but the short lifespan of YFP(J16)-R6/2(160Q) mice could make difficult the visualization of pathology for axons that are more mildly affected, including sciatic nerves (57). Regardless, data from this work suggest that cell type-specific characteristics of SATB2-positive cortical projection neurons render these cells highly vulnerable to mHtt-induced toxicity.
Validating findings from YFP(J16)-R6/2(160Q) mice for HD, immunohistochemical analysis of axonal NFs revealed a marked degeneration of callosal, but not optic nerve axons in the brains of HD patients. These data confirmed pathological alterations in callosal axons previously inferred from neurological and brain imaging studies (17), and further extended findings of differential axonal vulnerability from YFP(J16)-R6/2(120Q) mice to HD. Since the CC plays a critical role in the relay of cognitive, motor and sensory information between homologous cortical regions, dying-back degeneration of callosal projection neurons may account for some early behavioral symptoms observed in HD, including compromised associative cortical processing (17).
In summary, the analysis of YFP(J16)-R6/2 mice in this study revealed a dying-back pattern of degeneration for neurons affected in HD, suggesting that axons represent a critical neuronal compartment for mhtt-induced toxicity in vivo (7,23,55). Mechanisms underlying axonal degeneration were not directly addressed by these studies, but multiple lines of evidence demonstrated a toxic effect of mhtt on axonal transport, a process critical for the maintenance of axonal connectivity (23,58). Steric interference (39) and sequestration of motor proteins by mhtt aggregates (38,59) have been proposed as potential mechanisms mediating this toxic effect. EM-48-positive, microscopically visible mhtt aggregates were temporally and spatially segregated from degenerating callosal axons in YFP(J16)-R6/2 mice, but the possibility that other mHtt aggregates species (i.e. oligomeric species or mhtt fragments) contribute to axonal pathology could not be excluded. Significantly, our prior work demonstrated axon-autonomous inhibitory effects of mhtt on axonal transport, which were mediated by c-Jun amino terminal kinase 3 (JNK3) (7,58,60). Future studies in YFP(J16)-R6/2 mice and similar models will help address the contribution of JNK3 and other molecular targets to axonal degeneration in HD. Regardless, any effective therapeutic strategies for HD should aim to halt or prevent the progressive degeneration of neuritic connections documented in these studies.
Materials and Methods
Mice
All animal procedures were performed in accordance with National Institute of Health guidelines, institutional animal protocol procedures at the University of Illinois and following recommendations listed in Ref. (61). Mice were housed in standard conditions in a dark/light cycle of 12 h with ad libitum access to food and water. Starting at age P40, all mice were provided wet food to avoid malnourishment associated with reduced locomotor function in R6/2 mice (61). Wild-type female mice with ovaries transplanted from R6/2 mice expressing mhtt with a polyQ tract of 160 ± 5 [R6/2(160Q); JAX#002810] or 120 ± 5 [R6/2(120Q); JAX#006494] glutamines, as well as YFP(J16)+/+ (JAX#003709) and YFP(H)+/+ (JAX#003782) transgenic male mice were obtained from Jackson Laboratories. A description of mice used for procedures in this study is provided as Supplementary Data.
Rotarod tests
A rotarod apparatus (San Diego Instruments, CA) was used to evaluate locomotor deficits, as described previously (54). For each time point analyzed (P30, P60, P75), mice were tested over three consecutive days (P28, P29 and P30; P58, P59 and P60; and P73, P74 and P75). At each daily session, mice were first acclimated by placing them on a rod that was rotating at a constant speed of 4 rpm for 20 s. After acclimation, five rotarod trials were performed for each mouse, each separated by a 15–20 min period. Rotarod trial involved placing mice on the accelerating rod (4–40 rpm). Latency time to fall from the rod was recorded. Accordingly, mean values for each age in the Supplementary Material, Figure S2, were calculated from 15 independent rotarod trials. After each mouse was tested, the apparatus was thoroughly cleaned with 70% methanol. Experiments were consistently run between 2 and 3 pm to avoid confounding effects associated with disrupted circadian rhythms in R6/2 mice (61).
Tissue preparation
Animals were euthanized by CO2 inhalation, and transcardially perfused with 4% paraformaldehyde diluted in phosphate-buffered saline (PBS) (pH 7.4), as described before (62). The brains, spinal cords, optic and sciatic nerves were removed, further fixed overnight and then incubated in PBS with increasing sucrose concentrations (5, 10, 20 and 30% sucrose w/v in PBS) for additional 24 h. After embedding in OCT solution (Tissue Tek, cat #4583), 50 µm thick coronal (0.98 mm from Bregma) and sagittal sections were obtained using a Leica CM 1850 Cryostat. Sections were mounted on Superfrost glass slides (Fisher #12-550-15) and dried for 15 min. OCT was removed by washing three times with Tris buffer saline (TBS: Tris-glycine 50 mm, NaCl 150 mm; pH:7.4).
Diffusion tensor imaging studies
Fixed mouse brains (n = 3 per genotype) were washed thoroughly in Fluorinert (3M Company, MN) to reduce magnetic susceptibility during scanning. DTI data were gathered ex vivo using an Agilent 9.4 T horizontal bore magnetic resonance imaging (MRI) system (33). To reduce variations in measurements between experimental groups, the brains were randomized within their group, and scanned three at a time. Structural data were acquired using a standard spin echo sequence with repetition time (TR) = 2000 ms, echo time (ET) = 35 ms, number of excitations (NEX) = 4, a slice thickness of 500 μm and an in-plane resolution of 78 µm. DTI was accomplished with a diffusion-weighted spin echo sequence of TR = 2000 ms, TE ∼20 ms, NEX = 4, matrix size 256 × 256 and FOV = 30 mm × 30 mm × 1 mm. Twelve diffusion-weighted directions were acquired at b = 1000 s/mm2 with a B0 image for diffusion studies. From coronal reconstructions of fractal anisotropy (FA) maps, a total of four regions of interest (ROIs) (two left and two right) were manually segmented and centered in the prefrontal coordinates. Eigenvalues and mean fractional anisotropy (mFA) were obtained using DTIStudio software. Individual values were averaged and subjected to statistical analysis, as described before (33).
Immunohistochemistry
The following primary antibodies were used: anti-neurofilament heavy chain SMI-31 clone (Covance cat#SMI-31R, 1:000), anti-huntingtin EM48 clone (Millipore cat#MAB5374, 1:200), anti-Ctip2 (Abcam ab18465 1:100) and anti-SATB2 (Abcam ab51502, 1:200). Secondary antibodies were goat anti-mouse Alexa Fluor 647 (Invitrogen cat#A-21235) and goat anti-rat Alexa Fluor 647 (Invitrogen cat#A-211247). Tissue sections were permeabilized with TBST (0.25% TX-100 w/v in TBS) for 10 min, blocked with 5% goat serum for 1 h in TBS and incubated with primary antibodies overnight. After extensive washing with TBS, sections were incubated with secondary antibodies for 1 h, then washed again with TBS. Slides were dried and mounted in VectaShield mounting media (Vector Laboratories, Burlingame, CA) and sealed with nail varnish.
Confocal fluorescence image analysis
At ages P30, P60 and P90, three mice per experimental group (genotype) were sacrificed, perfused as above, and nerve tissue sections obtained (brain, spinal cord and sciatic nerves). For quantitation of YFP fluorescence levels in Figures 3C and 7A'–C', three tissue sections were analyzed for each mouse genotype, age point and tissue. YFP fluorescence images were acquired using an LSM 710 confocal microscope (Zeiss) with optical filters set at 546 nm. To reduce variability associated with image acquisition, tissue sections derived from all mouse genotypes and ages were placed on the same slide (Supplementary Material, Fig. 1A). Images corresponding to four ROIs were obtained for each tissue section (Supplementary Material, Fig. 1B). For each ROI image, mean pixel fluorescence intensity values were obtained by applying auto-threshold methods in Image J (Bethesda, MD) (Supplementary Material, Fig. 1C) and used for statistical analysis, as before (62).
For counting of neuronal cell bodies in Figure 5B, four ROIs comprising layers III–VI of the M1 motor cortex were obtained per coronal brain section (Supplementary Material, Fig. 1B). Images were transformed to 8-bit images using Image J. A 200 µm2 area pixel mask was applied to identify YFP-expressing neuronal cell bodies from other YFP-positive structures (i.e. adjacent neuropil), and neuronal cell bodies counted using the element counter plug-in tool of Image J (see the Supplementary Material, Fig. 1D).
For quantitation of SMI-31 immunoreactivity in Figure 8C, six subjects (three HD and three controls) were analyzed (see Table 1). Tissue sections were prepared from the CC's genu and ONT and immunostained with anti-SMI-31 antibody (1:1000), as before (63). Three images per subject per tissue were obtained using the same imaging settings. Fluorescence background subtraction was performed using tissue sections incubated with secondary antibody only.
Electron microscopy (EM)
For experiments in Figure 4D and E, three mice per experimental group were euthanized as above and intracardially perfused with PBS and Karnovsky fixative (64). The brains were removed from the skull, bisected with a razor blade and embedded in gelatin. One hundred micrometer thick sections were cut with a vibratome, post-fixed in 1% OsO4, dehydrated through a graded series of alcohols and propylene oxide, infiltrated in Durcupan (Fluka, Ronkonkoma, NY) and flat-embedded on glass slides with a plastic coverslip. Areas of interest were marked and cut off the slide with a razor blade. These areas were then super-glued onto a blank stub, and 80–90 nm ultrathin sections were sectioned with a diamond knife (Diatome). Seventy nanometer thick sagittal sections of the CC (prefrontal area) were collected on formvar-coated 1 × 2 mm slot grids. Grids were stained with uranyl acetate and lead citrate and examined in a JEOL 1220 TEM at 80 keV.
For quantitative data shown in Figure 4E, five representative pictures were obtained for each animal (n = 3 mice per experimental group). Using a JEOL 1220 electron microscope, a total of 15 images per experimental group were collected. EM images were transformed to 8 bits, and axoplasms delineated using pixel intensity detection threshold function (20–225). Images were then masked using a 200–1000 pixel filter size, and circularity parameters adjusted (0.7–1) to reveal individual axoplasmic profiles. The same image settings were applied to all images, and mean axonal caliber was calculated using the element counter function of Image J (n = 3 mice and 1500 axons total per group).
Statistical analysis
Quantitative data were tabulated using Excel and analyzed using GraphPad Prism 6 software (La Jolla, CA). Based on the results from pilot experiments, minimum numbers of animals per experimental group were established using power analysis and sample size calculations. Differences in rotarod performance among experimental groups were analyzed using two-way ANOVA (mixed effect model) and post hoc Tukey's tests (Supplementary Material, Fig. 2). For quantitative analysis of YFP fluorescence levels, one-way ANOVA and Tukey's post hoc tests were used to determine statistical differences among experimental groups (Figs 4C, 5B and 7A'–C'). Unpaired t-tests were used to compare differences in mFA values (Fig. 2C) and axonal diameters (Fig. 4E). A Pearson's correlation test was used to evaluate the association between the number of CAG repeats and callosal/ONT SMI-31 immunoreactivity levels (Fig. 8D). Error bars in all the figures represent standard error of the mean (SEM). Researchers performing data collection were blinded to mice genotype and age for all procedures.
Supplementary Material
Supplementary Material is available at HMG online.
Conflict of interest statement. None declared.
Funding
This work was supported by grants from CHDI Foundation (G.A.M., J.H.K.), the Brain Research Foundation (G.A.M.), Cute Rush Huntington's Disease Center of Excellence (J.H.K.), the National Science Foundation [MRI0923209 (R.L.M.)] and the National Institute of Health [NS066942A (G.A.M.) and NS23868, NS23320, NS41170 (S.T.B.)]. A.Q.Y. was supported by a TL1TR000049 training grant. Support for S.D.P. efforts was provided by an NIH grant (DC02058) to Dr Anna Lysakowski (UIC), who also provided technical advice and editing comments for this manuscript.
Supplementary Material
References
- 1.Roze E., Bonnet C., Betuing S., Caboche J. (2010) Huntington's disease. Adv. Exp. Med. Biol., 685, 45–63. [PubMed] [Google Scholar]
- 2.Cummings D.M., Alaghband Y., Hickey M.A., Joshi P.R., Hong S.C., Zhu C., Ando T.K., Andre V.M., Cepeda C., Watson J.B. et al. (2012) A critical window of CAG repeat-length correlates with phenotype severity in the R6/2 mouse model of Huntington's disease. J. Neurophysiol., 107, 677–691. [DOI] [PMC free article] [PubMed] [Google Scholar]
- 3.Walker F.O. (2007) Huntington's disease. Lancet, 369, 218–228. [DOI] [PubMed] [Google Scholar]
- 4.Sotrel A., Paskevich P.A., Kiely D.K., Bird E.D., Williams R.S., Myers R.H. (1991) Morphometric analysis of the prefrontal cortex in Huntington's disease. Neurology, 41, 1117–1123. [DOI] [PubMed] [Google Scholar]
- 5.Perez-Navarro E., Canals J.M., Gines S., Alberch J. (2006) Cellular and molecular mechanisms involved in the selective vulnerability of striatal projection neurons in Huntington's disease. Histol. Histopathol., 21, 1217–1232. [DOI] [PubMed] [Google Scholar]
- 6.Parent M., Parent A. (2006) Relationship between axonal collateralization and neuronal degeneration in basal ganglia. J. Neural. Transm. Suppl., 85–88. [DOI] [PubMed] [Google Scholar]
- 7.Han I., You Y., Kordower J.H., Brady S.T., Morfini G.A. (2010) Differential vulnerability of neurons in Huntington's disease: the role of cell type-specific features. J. Neurochem., 113, 1073–1091. [DOI] [PMC free article] [PubMed] [Google Scholar]
- 8.Pattison L.R., Kotter M.R., Fraga D., Bonelli R.M. (2006) Apoptotic cascades as possible targets for inhibiting cell death in Huntington's disease. J. Neurol., 253, 1137–1142. [DOI] [PubMed] [Google Scholar]
- 9.Ramaswamy S., McBride J.L., Kordower J.H. (2007) Animal models of Huntington's disease. ILAR J., 48, 356–373. [DOI] [PubMed] [Google Scholar]
- 10.Pouladi M.A., Morton A.J., Hayden M.R. (2013) Choosing an animal model for the study of Huntington's disease. Nat. Rev. Neurosci., 14, 708–721. [DOI] [PubMed] [Google Scholar]
- 11.Mangiarini L., Sathasivam K., Seller M., Cozens B., Harper A., Hetherington C., Lawton M., Trottier Y., Lehrach H., Davies S.W. et al. (1996) Exon 1 of the HD gene with an expanded CAG repeat is sufficient to cause a progressive neurological phenotype in transgenic mice. Cell, 87, 493–506. [DOI] [PubMed] [Google Scholar]
- 12.Sathasivam K., Neueder A., Gipson T.A., Landles C., Benjamin A.C., Bondulich M.K., Smith D.L., Faull R.L., Roos R.A., Howland D. et al. (2013) Aberrant splicing of HTT generates the pathogenic exon 1 protein in Huntington disease. Proc. Natl. Acad. Sci. USA, 110, 2366–2370. [DOI] [PMC free article] [PubMed] [Google Scholar]
- 13.Menalled L.B., Chesselet M.F. (2002) Mouse models of Huntington's disease. Trends Pharmacol. Sci., 23, 32–39. [DOI] [PubMed] [Google Scholar]
- 14.Cepeda C., Cummings D.M., Andre V.M., Holley S.M., Levine M.S. (2010) Genetic mouse models of Huntington's disease: focus on electrophysiological mechanisms. ASN Neuro, 2, e00033. [DOI] [PMC free article] [PubMed] [Google Scholar]
- 15.Cummings D.M., Cepeda C., Levine M.S. (2010) Alterations in striatal synaptic transmission are consistent across genetic mouse models of Huntington's disease. ASN Neuro, 2, e00036. [DOI] [PMC free article] [PubMed] [Google Scholar]
- 16.Phillips O., Sanchez-Castaneda C., Elifani F., Maglione V., Di Pardo A., Caltagirone C., Squitieri F., Sabatini U., Di Paola M. (2013) Tractography of the corpus callosum in Huntington's disease. PLoS One, 8, e73280. [DOI] [PMC free article] [PubMed] [Google Scholar]
- 17.Rosas H.D., Lee S.Y., Bender A.C., Zaleta A.K., Vangel M., Yu P., Fischl B., Pappu V., Onorato C., Cha J.H. et al. (2010) Altered white matter microstructure in the corpus callosum in Huntington's disease: implications for cortical ‘disconnection’. Neuroimage, 49, 2995–3004. [DOI] [PMC free article] [PubMed] [Google Scholar]
- 18.Poudel G.R., Stout J.C., Dominguez D.J., Salmon L., Churchyard A., Chua P., Georgiou-Karistianis N., Egan G.F. (2014) White matter connectivity reflects clinical and cognitive status in Huntington's disease. Neurobiol. Dis., 65, 180–187. [DOI] [PubMed] [Google Scholar]
- 19.Li H., Li S.H., Yu Z.X., Shelbourne P., Li X.J. (2001) Huntingtin aggregate-associated axonal degeneration is an early pathological event in Huntington's disease mice. J. Neurosci., 21, 8473–8481. [DOI] [PMC free article] [PubMed] [Google Scholar]
- 20.Li H., Li S.H., Johnston H., Shelbourne P.F., Li X.J. (2000) Amino-terminal fragments of mutant huntingtin show selective accumulation in striatal neurons and synaptic toxicity. Nat. Genet., 25, 385–389. [DOI] [PubMed] [Google Scholar]
- 21.Jackson M., Gentleman S., Lennox G., Ward L., Gray T., Randall K., Morrell K., Lowe J. (1995) The cortical neuritic pathology of Huntington's disease. Neuropathol. Appl. Neurobiol., 21, 18–26. [DOI] [PubMed] [Google Scholar]
- 22.DiProspero N.A., Chen E.Y., Charles V., Plomann M., Kordower J.H., Tagle D.A. (2004) Early changes in Huntington's disease patient brains involve alterations in cytoskeletal and synaptic elements. J. Neurocytol., 33, 517–533. [DOI] [PubMed] [Google Scholar]
- 23.Morfini G.A., Burns M., Binder L.I., Kanaan N.M., LaPointe N., Bosco D.A., Brown R.H. Jr, Brown H., Tiwari A., Hayward L. et al. (2009) Axonal transport defects in neurodegenerative diseases. J. Neurosci., 29, 12776–12786. [DOI] [PMC free article] [PubMed] [Google Scholar]
- 24.Feng G., Mellor R.H., Bernstein M., Keller-Peck C., Nguyen Q.T., Wallace M., Nerbonne J.M., Lichtman J.W., Sanes J.R. (2000) Imaging neuronal subsets in transgenic mice expressing multiple spectral variants of GFP. Neuron, 28, 41–51. [DOI] [PubMed] [Google Scholar]
- 25.Beirowski B., Berek L., Adalbert R., Wagner D., Grumme D.S., Addicks K., Ribchester R.R., Coleman M.P. (2004) Quantitative and qualitative analysis of Wallerian degeneration using restricted axonal labelling in YFP-H mice. J. Neurosci. Methods, 134, 23–35. [DOI] [PubMed] [Google Scholar]
- 26.Marangoni M., Adalbert R., Janeckova L., Patrick J., Kohli J., Coleman M.P., Conforti L. (2014) Age-related axonal swellings precede other neuropathological hallmarks in a knock-in mouse model of Huntington's disease. Neurobiol. Aging, 35, 2382–2393. [DOI] [PubMed] [Google Scholar]
- 27.Sugino K., Hempel C.M., Miller M.N., Hattox A.M., Shapiro P., Wu C., Huang Z.J., Nelson S.B. (2006) Molecular taxonomy of major neuronal classes in the adult mouse forebrain. Nat. Neurosci., 9, 99–107. [DOI] [PubMed] [Google Scholar]
- 28.Ozdinler P.H., Benn S., Yamamoto T.H., Guzel M., Brown R.H. Jr., Macklis J.D. (2011) Corticospinal motor neurons and related subcerebral projection neurons undergo early and specific neurodegeneration in hSOD1G(9)(3)A transgenic ALS mice. J. Neurosci., 31, 4166–4177. [DOI] [PMC free article] [PubMed] [Google Scholar]
- 29.Cudkowicz M., Kowall N.W. (1990) Degeneration of pyramidal projection neurons in Huntington's disease cortex. Ann. Neurol., 27, 200–204. [DOI] [PubMed] [Google Scholar]
- 30.Shepherd G.M. (2013) Corticostriatal connectivity and its role in disease. Nat. Rev. Neurosci., 14, 278–291. [DOI] [PMC free article] [PubMed] [Google Scholar]
- 31.Alcamo E.A., Chirivella L., Dautzenberg M., Dobreva G., Farinas I., Grosschedl R., McConnell S.K. (2008) Satb2 regulates callosal projection neuron identity in the developing cerebral cortex. Neuron, 57, 364–377. [DOI] [PubMed] [Google Scholar]
- 32.Bridge K.E., Berg N., Adalbert R., Babetto E., Dias T., Spillantini M.G., Ribchester R.R., Coleman M.P. (2009) Late onset distal axonal swelling in YFP-H transgenic mice. Neurobiol. Aging, 30, 309–321. [DOI] [PubMed] [Google Scholar]
- 33.Sun S.W., Neil J.J., Song S.K. (2003) Relative indices of water diffusion anisotropy are equivalent in live and formalin-fixed mouse brains. Magn. Reson. Med., 50, 743–748. [DOI] [PubMed] [Google Scholar]
- 34.Mori S., Zhang J. (2006) Principles of diffusion tensor imaging and its applications to basic neuroscience research. Neuron, 51, 527–539. [DOI] [PubMed] [Google Scholar]
- 35.Weaver K.E., Richards T.L., Liang O., Laurino M.Y., Samii A., Aylward E.H. (2009) Longitudinal diffusion tensor imaging in Huntington's Disease. Exp. Neurol., 216, 525–529. [DOI] [PMC free article] [PubMed] [Google Scholar]
- 36.Li H., Li S.H., Cheng A.L., Mangiarini L., Bates G.P., Li X.J. (1999) Ultrastructural localization and progressive formation of neuropil aggregates in Huntington's disease transgenic mice. Hum. Molec. Genet., 8, 1227–1236. [DOI] [PubMed] [Google Scholar]
- 37.Arrasate M., Finkbeiner S. (2012) Protein aggregates in Huntington's disease. Exp. Neurol., 238, 1–11. [DOI] [PMC free article] [PubMed] [Google Scholar]
- 38.Gunawardena S., Her L.S., Brusch R.G., Laymon R.A., Niesman I.R., Gordesky-Gold B., Sintasath L., Bonini N.M., Goldstein L.S. (2003) Disruption of axonal transport by loss of huntingtin or expression of pathogenic polyQ proteins in Drosophila. Neuron, 40, 25–40. [DOI] [PubMed] [Google Scholar]
- 39.Lee W.C., Yoshihara M., Littleton J.T. (2004) Cytoplasmic aggregates trap polyglutamine-containing proteins and block axonal transport in a Drosophila model of Huntington's disease. Proc. Natl. Acad. Sci. USA, 101, 3224–3229. [DOI] [PMC free article] [PubMed] [Google Scholar]
- 40.Wang C.E., Zhou H., McGuire J.R., Cerullo V., Lee B., Li S.H., Li X.J. (2008) Suppression of neuropil aggregates and neurological symptoms by an intracellular antibody implicates the cytoplasmic toxicity of mutant huntingtin. J. Cell Biol., 181, 803–816. [DOI] [PMC free article] [PubMed] [Google Scholar]
- 41.Ragauskas S., Leinonen H., Puranen J., Ronkko S., Nymark S., Gurevicius K., Lipponen A., Kontkanen O., Puolivali J., Tanila H. et al. (2014) Early retinal function deficit without prominent morphological changes in the R6/2 mouse model of Huntington's disease. PLoS One, 9, e113317. [DOI] [PMC free article] [PubMed] [Google Scholar]
- 42.Vonsattel J.P., Myers R.H., Stevens T.J., Ferrante R.J., Bird E.D., Richardson E.P. Jr (1985) Neuropathological classification of Huntington's disease. J. Neuropathol. Exp. Neurol., 44, 559–577. [DOI] [PubMed] [Google Scholar]
- 43.Orth M., Schippling S., Schneider S.A., Bhatia K.P., Talelli P., Tabrizi S.J., Rothwell J.C. (2010) Abnormal motor cortex plasticity in premanifest and very early manifest Huntington disease. J. Neurol. Neurosurg. Psychiatry, 81, 267–270. [DOI] [PMC free article] [PubMed] [Google Scholar]
- 44.Milnerwood A.J., Raymond L.A. (2010) Early synaptic pathophysiology in neurodegeneration: insights from Huntington's disease. Trends Neurosci., 33, 513–523. [DOI] [PubMed] [Google Scholar]
- 45.Menalled L., El-Khodor B.F., Patry M., Suarez-Farinas M., Orenstein S.J., Zahasky B., Leahy C., Wheeler V., Yang X.W., MacDonald M. et al. (2009) Systematic behavioral evaluation of Huntington's disease transgenic and knock-in mouse models. Neurobiol. Dis., 35, 319–336. [DOI] [PMC free article] [PubMed] [Google Scholar]
- 46.Ye C., Zhang Y., Wang W., Wang J., Li H. (2008) Inhibition of neurite outgrowth and promotion of cell death by cytoplasmic soluble mutant huntingtin stably transfected in mouse neuroblastoma cells. Neurosci. Lett., 442, 63–68. [DOI] [PubMed] [Google Scholar]
- 47.DiFiglia M., Sapp E., Chase K.O., Davies S.W., Bates G.P., Vonsattel J.P., Aronin N. (1997) Aggregation of huntingtin in neuronal intranuclear inclusions and dystrophic neurites in brain. Science, 277, 1990–1993. [DOI] [PubMed] [Google Scholar]
- 48.Sapp E., Penney J., Young A., Aronin N., Vonsattel J.P., DiFiglia M. (1999) Axonal transport of N-terminal huntingtin suggests early pathology of corticostriatal projections in Huntington disease. J. Neuropath. Exper. Neurol., 58, 165–173. [DOI] [PubMed] [Google Scholar]
- 49.Douaud G., Behrens T.E., Poupon C., Cointepas Y., Jbabdi S., Gaura V., Golestani N., Krystkowiak P., Verny C., Damier P. et al. (2009) In vivo evidence for the selective subcortical degeneration in Huntington's disease. Neuroimage, 46, 958–966. [DOI] [PubMed] [Google Scholar]
- 50.Porrero C., Rubio-Garrido P., Avendano C., Clasca F. (2010) Mapping of fluorescent protein-expressing neurons and axon pathways in adult and developing Thy1-eYFP-H transgenic mice. Brain Res., 1345, 59–72. [DOI] [PubMed] [Google Scholar]
- 51.Williams P.R., Marincu B.N., Sorbara C.D., Mahler C.F., Schumacher A.M., Griesbeck O., Kerschensteiner M., Misgeld T. (2014) A recoverable state of axon injury persists for hours after spinal cord contusion in vivo. Nat. Commun., 5, 5683. [DOI] [PubMed] [Google Scholar]
- 52.Huang B., Wei W., Wang G., Gaertig M.A., Feng Y., Wang W., Li X.J., Li S. (2015) Mutant huntingtin downregulates myelin regulatory factor-mediated myelin gene expression and affects mature oligodendrocytes. Neuron, 85, 1212–1226. [DOI] [PMC free article] [PubMed] [Google Scholar]
- 53.Pigino G., Song Y., Kirkpatrick L.L., Brady S.T. (2011) Basic neurochemistry (8th ed.). Chapter 6. http://www.sciencedirect.com/science/book/9780123749475.
- 54.Rattray I., Smith E., Gale R., Matsumoto K., Bates G.P., Modo M. (2013) Correlations of behavioral deficits with brain pathology assessed through longitudinal MRI and histopathology in the R6/2 mouse model of HD. PLoS One, 8, e60012. [DOI] [PMC free article] [PubMed] [Google Scholar]
- 55.Li J.Y., Conforti L. (2013) Axonopathy in Huntington's disease. Exp. Neurol., 246, 62–71. [DOI] [PubMed] [Google Scholar]
- 56.Shiraishi R., Tamura T., Sone M., Okazawa H. (2014) Systematic analysis of fly models with multiple drivers reveals different effects of ataxin-1 and huntingtin in neuron subtype-specific expression. PLoS One, 9, e116567. [DOI] [PMC free article] [PubMed] [Google Scholar]
- 57.Wade A., Jacobs P., Morton A.J. (2008) Atrophy and degeneration in sciatic nerve of presymptomatic mice carrying the Huntington's disease mutation. Brain Res., 1188, 61–68. [DOI] [PubMed] [Google Scholar]
- 58.Morfini G., Pigino G., Brady S.T. (2005) Polyglutamine expansion diseases: failing to deliver. Trends Molec. Med., 11, 64–70. [DOI] [PubMed] [Google Scholar]
- 59.Trushina E., Dyer R.B., Badger J.D. II, Ure D., Eide L., Tran D.D., Vrieze B.T., Legendre-Guillemin V., McPherson P.S., Mandavilli B.S. et al. (2004) Mutant huntingtin impairs axonal trafficking in mammalian neurons in vivo and in vitro. Mol. Cell. Biol., 24, 8195–8209. [DOI] [PMC free article] [PubMed] [Google Scholar]
- 60.Morfini G.A., You Y.M., Pollema S.L., Kaminska A., Liu K., Yoshioka K., Bjorkblom B., Coffey E.T., Bagnato C., Han D. et al. (2009) Pathogenic huntingtin inhibits fast axonal transport by activating JNK3 and phosphorylating kinesin. Nat. Neurosci., 12, 864–871. [DOI] [PMC free article] [PubMed] [Google Scholar]
- 61.Menalled L., Lutz C., Ramboz S., Brunner D., Lager B., Noble S., Park L., Howland D (2014) A Field Guide to Working with Mouse Models of Huntington's Disease. http://www.chdifoundation.org/wp-content/uploads/HD_Field_Guide_040414.pdf (date last accessed, 30 June 2015).
- 62.Morfini G.A., Bosco D.A., Brown H., Gatto R., Kaminska A., Song Y., Molla L., Baker L., Marangoni M.N., Berth S. et al. (2013) Inhibition of fast axonal transport by pathogenic SOD1 involves activation of p38 MAP kinase. PLoS One, 8, e65235. [DOI] [PMC free article] [PubMed] [Google Scholar]
- 63.Chu Y., Morfini G.A., Langhamer L.B., He Y., Brady S.T., Kordower J.H. (2012) Alterations in axonal transport motor proteins in sporadic and experimental Parkinson's disease. Brain, 135, 2058–2073. [DOI] [PMC free article] [PubMed] [Google Scholar]
- 64.Reese T.S., Karnovsky M.J. (1967) Fine structural localization of a blood-brain barrier to exogenous peroxidase. J. Cell Biol., 34, 207–217. [DOI] [PMC free article] [PubMed] [Google Scholar]
Associated Data
This section collects any data citations, data availability statements, or supplementary materials included in this article.