

Abstract
Human norovirus (NoV) is the leading cause of foodborne illness in the United States and Canada. Wastewater treatment plant (WWTP) effluents impacting bivalve mollusk-growing areas are potential sources of NoV contamination. We have developed a meta-analysis that evaluates WWTP influent concentrations and log10 reductions of NoV genotype I (NoV GI; in numbers of genome copies per liter [gc/liter]), NoV genotype II (NoV GII; in gc/liter), and male-specific coliphage (MSC; in number of PFU per liter), a proposed viral surrogate for NoV. The meta-analysis included relevant data (2,943 measurements) reported in the scientific literature through September 2013 and previously unpublished surveillance data from the United States and Canada. Model results indicated that the mean WWTP influent concentration of NoV GII (3.9 log10 gc/liter; 95% credible interval [CI], 3.5, 4.3 log10 gc/liter) is larger than the value for NoV GI (1.5 log10 gc/liter; 95% CI, 0.4, 2.4 log10 gc/liter), with large variations occurring from one WWTP to another. For WWTPs with mechanical systems and chlorine disinfection, mean log10 reductions were −2.4 log10 gc/liter (95% CI, −3.9, −1.1 log10 gc/liter) for NoV GI, −2.7 log10 gc/liter (95% CI, −3.6, −1.9 log10 gc/liter) for NoV GII, and −2.9 log10 PFU per liter (95% CI, −3.4, −2.4 log10 PFU per liter) for MSCs. Comparable values for WWTPs with lagoon systems and chlorine disinfection were −1.4 log10 gc/liter (95% CI, −3.3, 0.5 log10 gc/liter) for NoV GI, −1.7 log10 gc/liter (95% CI, −3.1, −0.3 log10 gc/liter) for NoV GII, and −3.6 log10 PFU per liter (95% CI, −4.8, −2.4 PFU per liter) for MSCs. Within WWTPs, correlations exist between mean NoV GI and NoV GII influent concentrations and between the mean log10 reduction in NoV GII and the mean log10 reduction in MSCs.
INTRODUCTION
Human norovirus (NoV) is the leading cause of food-associated gastroenteritis in the United States (1) and Canada (2). U.S. residents are estimated to experience five episodes of norovirus gastroenteritis in their lifetimes (3). NoV is primarily spread via the fecal-oral route. However, attribution of a particular case of NoV illness to a specific source is complex. The transmission may be direct (person to person) or indirect (via contact with contaminated fomites) or may occur through the ingestion of contaminated food or water (4). Noroviruses are genetically diverse, comprising six genogroups (5), three of which (genogroup I [GI], GII, and GIV) are capable of causing illness in humans (6).
Among foodborne NoV outbreaks, bivalve molluscs (e.g., clams, oysters, mussels), leafy vegetables, and fruits are the most frequently implicated (7). More than half of the norovirus outbreaks attributed to the consumption of bivalve molluscs in the United States during the years from 2001 to 2008 are believed to have originated from contamination during production or processing (7). Bivalve molluscan shellfish typically grow in estuaries, which may contain NoV-contaminated human fecal material from municipal wastewater outfalls, combined sewer overflow, or nonpoint sources of pollution, including human waste discharged from marine vessels (8, 9). Bivalve molluscan shellfish feed on algae from the surrounding water. During this feeding process, each bivalve mollusc may filter 20 to 90 liters of water per day and bioaccumulate a variety of microorganisms, including viruses and bacteria that are associated with pollution sources (8, 10–12). Significantly, molluscan shellfish have been found to retain viruses to a greater extent and for much longer periods than they do bacteria (8, 13, 14). Bivalve molluscs, therefore, may become contaminated with NoV when they are grown in harvesting areas contaminated with human wastes.
In the United States and in Canada, areas where harvested shellfish grow require a comprehensive sanitary survey (15, 16). A sanitary survey is an in-depth evaluation of all factors impacting the water quality in the growing area. It includes a shoreline survey to identify and characterize the impacts of all actual and potential pollution sources that may have a bearing on the sanitary quality of shellfish waters. Additionally, a growing area must meet established bacterial water quality classification standards verified through routine monitoring. However, the occurrence of human enteric viruses, including NoV, does not correlate well with traditional indicators of fecal pollution, such as total coliforms, fecal coliforms, or Escherichia coli (17, 18). Currently, only bacterial indicators are monitored to assess the sanitary quality of wastewater treatment plant (WWTP) effluent discharges under the U.S. Environmental Protection Agency National Pollutant Discharge Elimination System program for discharge permits. Shellfish control authorities are keenly aware of the increased public health risk posed by WWTP failures, bypasses, and combined sewer overflows. In addition, a growing body of research demonstrates that even most normal wastewater treatment and disinfection operations do not reduce human enteric viral pathogens as effectively as they reduce bacterial pathogens and bacterial indicator organisms (19–23).
The systems used by WWTPs can be divided into two groups, lagoon and mechanical systems, on the basis of the general structure of the facility. Two key differences between lagoon and mechanical systems are the longer retention time and the long exposure to sunlight in lagoon systems. Mechanical wastewater treatment typically involves three to four stages of treatment. The most commonly used are primary and secondary treatment followed by disinfection. The disinfection stage is typically the final stage of treatment, and its purpose is to substantially reduce the pathogenic microorganisms in the treated sewage before being discharged into the environment. The most common form of wastewater disinfection is chlorination. However, UV irradiation is gaining more popularity as the technology becomes more cost-effective.
Improvements in the means of detection and enumeration of NoV, notably, through the use of real-time reverse transcription (RT)-quantitative PCR (qPCR), have facilitated studies evaluating NoV removal efficiency in terms of the number of genome copies (gc) of a limited number of WWTPs in specific geographic areas (e.g., see references 11, 24, and 25 to 27). The removal of viral genome copies describes the combination of physical removal and destruction of the viral particle to the point that the target RNA fragment is no longer detectable (24). Nevertheless, the number of viral genome copies may not be related proportionally to the number of infectious virus particles. NoV is a nonculturable virus, so it is not possible to directly measure the level of infectious particles in a sample. Male-specific coliphages (MSCs) have been suggested to be potential surrogates for NoV (28, 29) because they are ubiquitous in wastewater, are similar in size and shape to NoV, are also RNA-based viruses, and have available culture-based measures to evaluate the reduction of infectious particles.
The objectives of the study were (i) to evaluate and characterize the expected concentrations of NoV (in number of genome copies per liter) and MSCs (in number of PFU per liter) in WWTP influent as a function of the time of year and to evaluate the WWTP-to-WWTP variability and (ii) to evaluate and compare the expected log10 reductions achieved for NoV (in gc/liter) and MSCs (in number of PFU per liter) in WWTPs and to characterize the reductions according to specific WWTP features and the time of year.
For these purposes, we implemented a meta-analysis of NoV (in gc/liter) and MSC (in number of PFU per liter) concentration measurements collected in WWTPs obtained from refereed publications in the scientific literature and from United States and Canadian government agency surveillance data. This work was initiated in support of the development of a quantitative food safety risk assessment of norovirus in bivalve molluscan shellfish by the U.S. Food and Drug Administration (FDA), Health Canada (HC), the Canadian Food Inspection Agency (CFIA), and Environment Canada (EC).
MATERIALS AND METHODS
Data.
Two general information sources were used to obtain the data that form the basis of this investigation, including (i) the peer-reviewed literature and (ii) surveillance data collected by the U.S. and Canadian governments.
(i) Data available from reviewed scientific literature.
A search of the literature for articles reporting NoV concentrations in WWTPs was performed. The keywords “norovirus” and “wastewater” were entered in PubMed (http://www.ncbi.nlm.nih.gov/pubmed) and in Google Scholar. Additional relevant references were identified through cross-referencing in the identified studies. Articles were initially screened for inclusion in the present study on the basis of the following criteria, as determined from the abstract and journal article information: (i) the article was published in English, (ii) the article was published in a peer-reviewed journal, (iii) the article was a primary research article, and (iv) the article provided quantitative measurements of NoV concentrations using real-time RT-qPCR methods or most probable number RT-qPCR methods. The inclusion period ended in September 2013. Further screening of the full article content restricted the set of articles included to those in which raw measurement data for NoV GI, NoV GII, and NoV GIV in influent or effluent samples of WWTPs were available (through the text, tables, and/or figures). NoV GIV was subsequently excluded from the analysis because too few data for this genogroup were identified.
In selected peer-reviewed scientific articles, data points consisted of measurements of NoV GI or NoV GII concentrations from collected influent, final effluent, and/or predisinfection WWTP samples. Data on the concentrations of MSCs in the WWTP influent, effluent, and/or predisinfection samples were also extracted, if provided. Influent concentration data provide information on the total norovirus or MSC load entering WWTPs. Data on the concentrations of NoV and MSCs in the predisinfected wastewater and final effluent provide the information required to evaluate the overall log reduction achieved. Given that one of the objectives of the study was to compare the log10 reduction in MSC and NoV concentrations, we limited the search for data on MSCs to articles selected for analysis of NoV concentrations.
Relevant data from each article were recorded, including the sampling method (grab/composite); the volumes of influent, predisinfection, and/or effluent samples collected and analyzed; and the concentration, extraction, detection, and quantification methods employed. Individual measurements were extracted from the text or tables of the articles. Graphs were digitized for data extraction, when required.
Some publications/studies and some individual data points in the publications/studies were excluded from our analysis due to inadequately described methodologies or aberrant data. Inclusion of study data required that all methods used were clearly described (or appropriately referenced), including the initial and final volumes derived in each step of all protocols, because this information was necessary to estimate the limit of detection (LOD) (described further below). The use of random hexamers was also cause for exclusion, as this practice can overestimate the number of genomic copies by up to 10-fold (30).
A large fraction (see Results) of the reported concentration values collected for this analysis were censored values, meaning that the concentration was known only to be lower than a value (the LOD) or above a limit of numeration (or too numerous to count [TNTC]). The former data are described as being left censored, and the latter are described as being right censored. In order to include left-censored data in the analysis (see below), it was necessary to have an estimate of the LOD for each nondetect measurement. Because LOD values were not reported in most of the included studies, we developed a set of rules and assumptions for the estimation of LOD values: (i) the RT-PCR/RT-qPCR had a sensitivity of 1 gc per analyzed aliquot; (ii) the sample concentration/RNA extraction/separate RT reaction (where applicable) was 100% efficient, meaning that no loss occurred at any step; (iii) when dealing with replicate RT-PCRs, the LOD was calculated by assuming that all reaction mixtures contained 1 genome copy; and (iv) when certain steps of a method were described solely by a reference to a previous article, the volumes used in the referenced study were assumed to be the volumes used in the study.
The LODs for influent and effluent samples were determined using the initial water sample volume, final concentration, amount of RNA eluted, and RT-PCR volume. In most cases, the water sample volumes for the influent and effluent were the same. There were a few instances where the water sample volume of the effluent was greater than that of the influent.
(ii) United States and Canadian WWTP surveillance data.
Surveillance studies included NoV GI, NoV GII, or MSC concentrations in WWTP influent, predisinfection, and/or final effluent samples. Similar to the inclusion criteria for data reported in peer-reviewed scientific articles, the surveillance data included in this study were restricted to measurements obtained by RT-qPCR methods for detection and enumeration of NoV. Sewage samples analyzed for collection of FDA surveillance data were collected as either grab samples or multihour composites between May 2003 and October 2011 from 45 different WWTPs located in 12 different states/provinces and two different countries (the United States and Canada). All WWTPs associated with the collection of U.S. surveillance data had mechanical systems. These WWTPs included 36 that used chlorine disinfection, 7 that used UV disinfection, 1 that used no disinfection, and 1 for which disinfection information was not available. Canadian surveillance data were collected between January 2009 and March 2012 from 18 different WWTPs. Among these WWTPs, 10 had mechanical systems and 8 had lagoon systems. Disinfection treatment also varied among the WWTPs included in the Canadian surveillance data, with 7 using chlorine disinfection, 9 using UV disinfection, and 2 using no disinfection. Surveillance samples collected from Canadian wastewater systems were grab samples obtained as either single influent and final effluent pairs or three to five replicates each of influent, posttreatment/predisinfection effluent, and final effluent.
Samples were maintained at between 0°C and 10°C during transport to the laboratory. Depending on the proximity of the WWTP to the laboratory, transport times varied from 4 to 24 h but were consistent for all sampling events at each WWTP.
Methods for extraction and detection of NoV and MSCs in sewage.
(i) United States surveillance data.
An ultracentrifugation (31, 32) protocol was used to concentrate aliquots of influent and effluent for enteric viruses. This intact virus concentration method was combined with an RNA extraction utilizing 6 M guanidium isothiocyanate as a lysis solution and a modified protocol for the RNeasy minikit (Qiagen, Valencia, CA). The real-time RT-PCR primer and probe sequences and assay parameters used were those previously described (33, 34).
(ii) Canadian surveillance data.
Enteric viruses were concentrated from feline calicivirus (FCV)-spiked water samples (raw sewage influent, predisinfection effluent, and postdisinfection effluent) as described by Simard et al. (35) with the inclusion of an additional clarification step by filtration through 0.45-μm-pore-size filtration units to remove sediments. RNA extraction and RT-qPCR of NoV were performed as described by Houde et al. (36), with the exception that the probe sequence for NoV GI was modified (the probe RING 1c sequence was AGA TYG CGI TCI CCT GTC CA [37]). The RT-qPCR detection of FCV was done as described by Mattison et al. (38). Positive NoV RT-qPCR results were confirmed by conventional RT-PCR as described by Kojima et al. (39) and sequencing of PCR products of the expected size.
Database.
WWTP operational characteristics and parameters were collected as they were available and reported in the article or as recorded in the United States or Canadian surveillance data sets. This included information on the general type of WWTP (a WWTP with a mechanical or a lagoon system) and the disinfection process (chlorine, UV, none, or unidentified), the only parameters for which sufficient data were available for inclusion in the analysis. Other parameters that were considered but for which insufficient information was provided for analysis were treatment level and type (e.g., membrane bioreactor, activated sludge, multicell aerated lagoon), catchment area, population served, average daily flow (in cubic meters per day), flow rate variation, hydraulic retention time, amount of suspended solids, biochemical oxygen demand, and specifications regarding disinfection (e.g., dose, wavelength, residual chlorine).
For this meta-analysis, a data point was characterized by the month of collection, the virus type (NoV GI, NoV GII, or MSCs), and the virus concentrations measured in raw, predisinfected, and postdisinfected (final effluent) wastewater. Not all data points included predisinfection measurements. Concentration units were in log10 gc/liter for NoV or the log10 number of PFU per liter for MSCs. Measurements below the LOD or above the TNTC limit were coded as less than the LOD or greater than the TNTC limit, respectively. LOD values were derived as described above. Values of TNTC were obtained only for MSCs in WWTP influent and effluent, on occasion, and were defined in each investigation that reported these observations.
Data analysis.
Specific statistical procedures are required to accurately describe and analyze data from multiple sources that include left-censored and/or right-censored data. Survival data-type analyses were first used for the data description. An empirical distribution of the data was provided using the expectation-maximization approach of Turnbull (40), which addresses the presence of left- and right-censored data. The analysis was developed using R software (v.3.0.2) (41) and the R package survival (42). A series of Bayesian inference models was then developed to evaluate the distribution of NoV GI, NoV GII, and MSC concentrations in influent, predisinfection, and effluent wastewater samples, as well as the corresponding log10 concentration reductions achieved within the WWTP.
A Bayesian framework was chosen because of its ability to analyze a complex model system (hierarchical model, random effects, censored data, missing covariates; see below). In a first step, prior distributions were selected for the parameters. These prior distributions can reflect our previous knowledge of the parameters or were chosen, as in the present study, to be as uninformative as possible. An inference step produced posterior distributions by conditioning the parameter distributions on the observed data, according to the Bayes theorem. The difference between the prior and the posterior can be interpreted as the update of previous knowledge provided by the data (43).
Hierarchical model of virus concentration and log10 reduction.
Mixed models were used to account for the covariance structure among concentration measurements taken on a single occasion at the same WWTP. A hierarchical structure with one mean parameter specified at the WWTP-NoV genogroup or MSC level issued from a multivariate normal distribution was adopted. In order to capture the variations from one WWTP to the other and the correlations within a WWTP (w) among (i) the mean influent concentration over time (in months) of NoV GI (μw,NoV GI), (ii) the mean influent concentration over time (in months) of NoV GII (μw,NoV GII), (iii) the mean influent concentration over time (in months) of MSCs (μw,MSCs), (iv) the mean baseline log10 reduction (from influent to predisinfection samples) over time (in months) for NoV GI (λw,NoV GI), (v) the mean baseline log10 reduction (from influent to predisinfection samples) over time (in months) for NoV GII (λw,NoV GII), and (vi) the mean baseline log10 reduction (from influent to predisinfection samples) over time (in months) for MSCs (λw,MSCs), we used the following multivariate normal distribution: (μw,NoV GI, μw,NoV GII, μw,MSC, λw,NoV GI, λw,NoV GII, λw,MSC) ∼ MNormal (Μ, 1/V), where MNormal is the multivariate normal distribution with a vector of mean M and variance-covariance matrix 1/V, and w (where w = 1, … . , 80) is an index for the WWTP. This parameterization signifies that the influent concentration and baseline log10 reduction for each virus/genogroup is considered to vary from one WWTP to another around parameters specified in M. The variance-covariance matrix 1/V provides estimates on the variation of the mean influent concentration and mean baseline log10 reduction for each virus/genogroup from one WWTP to the other and on the correlation between the mean influent concentration and the mean baseline log10 reduction for each virus/genogroup within WWTPs.
Modeling of influent concentration.
An influent concentration, ζ (log10 gc/liter), is characterized by the WWTP (indexed using w), the genogroup/virus (indexed using g, where the value can be for either NoV GI, NoV GII, or MSCs), and the month (index m, which is equal to 1, … , 12). A 6-month lag was used for data collected in the Southern Hemisphere (e.g., Brazil). For a concentration characterized as a given value for w, g, and m, the distribution of influent concentrations is described by a normal distribution with mean value μw,g,m and standard deviation σIg. Some reported values were censored values; i.e., they were below the LOD (the LOD of the analytical method used to enumerate the concentration in the WWTP influent, consisting of left-censored data [LCensin, where “in” represents influent]) or above the limit of numeration (the TNTC limit, consisting of right-censored data [RCensin]). These data were included in the estimation of the normal distribution parameters using censored data methods, characterizing them as censored values with possible true values ranging from −∞ log10 gc/liter (or the number of PFU per liter for MSCs) to LCensin for left-censored data or from RCensin to +∞ log10 gc/liter (or the number of PFU per liter for MSCs) for right-censored data.
Concentrations in influent water were modeled using ζi ∼ Normal(μw,g,m, σIg) when concentrations were measured, ζi ∼ Normal(μw,g,m, σIg) censored on (−∞, LCensin,i) when concentrations were not detected (the amount was less than the LOD), or ζi ∼ Normal(μw,g,m, σIg) censored on (RCensin,i, + ∞) when concentrations were TNTC (the amount was greater than the limit of numeration), with μw,g,m being equal to μw,g + βm,g, where μw,g represents the 12-month mean log10 concentration in the influent for WWTP w. A monthly effect, βm,g, was modeled as a fixed effect specific to the virus/genogroup, adding to or subtracting from μw,g the mean influent concentration value derived for a given WWTP and genogroup. Seasonal effects can be modeled in different ways. The objective in our approach was to develop a flexible, periodic model that took advantage of the detailed information contained in the data set (data collected in each of the 12 calendar months) and considered continuity between months. For each virus/genogroup, an independent 4-parameter model with a sum of lagged sinusoidal functions was selected. The model describing this effect is as follows:
| (1) |
where the αk,g terms (where k is equal to 1, 2, or 3) are three independent scale parameters for virus/genogroup g, and ϕg is one phase parameter for virus/genogroup g.
Modeling of predisinfection concentration.
The NoV and MSC predisinfection concentration varies among WWTPs and changes with genogroup, month, and WWTP type (a WWTP with a lagoon or a mechanical system [a mechanical system is indexed using mech]). For a given observation characterized by w, g, m, and mech, the distribution of predisinfection concentrations is described by a normal distribution with expected mean value νw,g,m,mech and standard deviation σEg. νw,g,m,mech equals the sum of the expected mean influent concentration in that month (μw,g,m), the baseline log10 reduction (λw,g) achieved by the WWTP for the virus/genogroup (random effect), and a virus-specific fixed effect of the WWTP type (γmech,v, where the index v represents NoV or MSCs). The standard deviation used in this model, σEg, is different from the influent one, σIg. A vast majority of NoV records did not have predisinfection concentration measurements (e.g., they provided only a measurement of the influent concentration and of the effluent concentration, but no sample for determination of the concentration was taken at the predisinfection step). When missing, the predisinfection concentration value was treated as a latent variable. When a sample was taken, some observed concentration values were left censored (below the LOD), and none were right censored.
The model for the predisinfection data is described as follows: ξi ∼ Normal(νw,g,m,mech σEg) when sampled and observed and ξi ∼ Normal(νw,g,m,mech σEg) censored on (−∞, LCensef,i [where ef represents effluent]) when sampled but not detected, with νw,g,m,mech being equal to μw,g,m + λw,g + γmech,v, where λw,g represents a 12-month mean log10 reduction for WWTP w.
Modeling of effluent concentration.
The NoV and MSC effluent concentration varies among WWTPs and changes with genogroup, month, WWTP type, and the type of wastewater disinfection employed in the WWTP. Wastewater disinfection was divided into three general types (indexed as tt), identified as (i) none, meaning that disinfection was not applied; (ii) chlorine, meaning that disinfection was achieved through chlorination; and (iii) UV, meaning that disinfection was achieved through irradiation with UV light. For a given observation characterized by w, g, m, mech, and tt, the distribution of the effluent concentration is described by a normal distribution with mean τw,g,m,mech,tt and standard deviation σEg. The mean τw,g,m,mech,tt equals the sum of the mean predisinfection concentration (νw,g,m,mech) plus a fixed effect of the disinfection treatment (ϕtt,v; which is specific to the treatment [chlorine or UV] and specific to virus v) and a fixed month effect specific to virus/genogroup g (δm,g). A reference fixed effect of 0 was used for no disinfection. The disinfection treatment was unidentified for five WWTPs, and therefore, the actual unidentified disinfection treatment for these five WWTPs was considered a latent variable in these cases. The fixed month effect δm,g is modeled similarly, but independently, as βm,g.
We assumed a standard deviation to the model for the concentration of virus in effluent water equal to the one for predisinfection water (i.e., σEg), as predisinfection and effluent water may be considered similar in terms of organic load. Some observed values, i.e., values known to be only below a given threshold (LCensef; or the LOD of the analytical method used to enumerate effluent samples) or above the numeration limit (RCensef; the TNTC limit), were censored.
The effluent concentration was thus modeled using ψi ∼ Normal(τw,g,m,mech,tt, σEg) when the concentration was measured, ψi ∼ Normal(τw,g,m,mech,tt, σEg) censored on (−∞, LCensef,i) when the concentration was not detected (when the concentration was less than the LOD), or ψi ∼ Normal(τw,g,m,mech,tt, σEg) censored on (RCensef,i, +∞) when the concentration was TNTC (when the concentration was more than the limit of enumeration), with τw,g,m,mech,tt being equal to νw,g,m,mech + δm,g + ϕtt,v.
Inferences.
The directed acyclic graph of the model is provided in Fig. 1. This graph illustrates the organization and hierarchy of the model (44). We chose to use uninformative prior distributions; as examples, values of 5 log10 gc/liter (or 5 log10 number of PFU per liter for MSCs) were used for the mean influent concentrations (μw,g), and values of −5 log10 gc/liter (or −5 log10 number of PFU per liter for MSCs) were used for the mean baseline log10 reductions (λw,g). Standard deviations of 10 were used for the corresponding scale parameters. Uniform distributions from 0 to 10 were used for σIg and σEg. All prior distributions are provided in Table 1.
FIG 1.

Directed acyclic graph describing the model. Data are denoted as rectangles, and unknown random variables are denoted by ellipses.
TABLE 1.
Prior distributions
| Parameter | Description | Prior distribution or formulaa |
|---|---|---|
| μw,g | Mean parameters for the concn of NoV GI, NoV GII, and MSCs in influent of WWTP w | (μw,NoV GI, μw,NoV GII, μw,MSCs, λw,NoV GI, λw,NoV GII, λw,MSCs) ∼ MNormal(Μ, 1/V) |
| λw,g | Mean parameters for the log reduction for NoV GI, NoV GII, and MSCs for WWTP w | |
| Μ | Mean of the multivariate parameters | MNormal[(5, 5, 5, −5, −5, −5), 1/P] |
| P | Precision matrix | 0.01 I6 |
| V | Precision matrix of the WWTP to WWTP | Wishart[(4 I6)−1, 6] |
| σIg | Deviation to the influent model | Uniform(0, 10) |
| σEg | Deviation to the pre-disinfection and effluent model | Uniform(0, 10) |
| γmech,v | Fixed-effect model for a mechanical system (mech = +1) vs a lagoon system (mech = −1) for virus v | Normal(0, 1002) |
| ϕtt,v | Fixed effect model for disinfection treatment for virus v (where tt is no treatment, chlorine, UV) | Normal(0, 1002), 0 for no treatment |
| ϕg | Parameter-of-the-month model (phase) | Uniform(−π, +π) |
| ak,g | Parameter-of-the-month model (scale parameters) | Normal(0, 102) |
| πi | Probability that WWTPs with unidentified disinfection treatment have no, chlorine, or UV disinfection treatment | Dirichlet(1,1,1) |
Normal distributions are parameterized as Normal(mean, variance). Multinormal distributions are parameterized as MNormal(mean vector, covariance matrix).
Bayesian inferences were developed using Markov chain Monte Carlo (MCMC) methods, as implemented in OpenBugs (v.3.2.2) software, launched from R using the R package BRugs (45). MCMC chains were studied using the R packages BRugs (45) and Coda (46). We evaluated conditional prior distributions of parameters (47), as imposed by the prior distributions and the structure of the model, by running the model without data. Using conditional prior distributions and data, we evaluated the empirical conditional posterior distribution of the model parameters. We deemed that two parameters were statistically significantly different if the intervals between the 2.5th and 97.5th percentiles of their empirical posterior distributions (95% credible intervals [95% CIs]) did not overlap.
We performed the analysis on three MCMCs started using different initial values and different random seed values. The first 10,000 values of each chain were discarded. One value was then recorded every 10 iterations, until 10,000 values were recorded for each of the three chains. The convergence of the models was checked using the Gelman-Rubin criterion, with a value of under 1.1 being used as a sign of convergence (48).
RESULTS
Data description.
Data from the selected scientific literature originated from Japan, France, Sweden, Brazil, Ireland, and the United States (11, 25–27, 49–56). Data from Flannery et al. (11) and Rajko-Nenow et al. (56) originated from the same WWTP during the same period of time; one article reported the influent data, and the other one reported the effluent data.
A large proportion of results were reported as “nondetected.” Indeed, 24% (336/1,410) of the influent measures were below the LOD, while 56% (764/1,353) of the effluent data were below the LOD. Twenty-four MSC measurements from the Canadian surveillance data set were TNTC.
Overall, 1,487 records (i.e., associated measurements in influent, predisinfection, and/or effluent samples from one WWTP at one sampling date for a given virus [2,943 total measurements]) were included in the analysis. Table 2 (NoV GI), Table 3 (NoV GII), and Table 4 (MSCs) provide descriptions of the studies used for our investigation and identify the information provided by each reference, i.e., the location of sampling (influent, predisinfection step, or final effluent) and the type of available data (concentrations less than the LOD, measured, or greater than the TNTC limit).
TABLE 2.
Description of NoV GI data set
| Author, yr (reference) or source | No. of WWTPs | No. of data points |
LODa |
||||||||||
|---|---|---|---|---|---|---|---|---|---|---|---|---|---|
| Influent |
Predisinfection sample |
Effluent |
Total | Influent | Predisinfection sample and effluent | ||||||||
| Measured | Nondetected | NAb | Measured | Nondetected | NA | Measured | Nondetected | NA | |||||
| da Silva et al., 2007 (25) | 4 | 34 | 46 | 1 | 81 | 18 | 58 | 5 | 81 | 2.7 | 2.7 | ||
| Flannery et al., 2012 (11) | 1 | 13 | 25 | 38 | 37 | 1 | 38 | 2.74 | 2.74 | ||||
| Francy et al., 2012 (50) | 4 | 10 | 9 | 3 | 16 | 19 | 19 | 19 | 2.64–4.15c | 0.18–1.83c | |||
| Fumian et al., 2013 (51) | 1 | 12 | 12 | 12 | 12 | 3.28 | 3.28 | ||||||
| Katayama et al., 2008 (26) | 1 | 12 | 12 | 12 | 12 | 3.15 | 2.7 | ||||||
| Nordgren et al., 2009 (52) | 1 | 12 | 4 | 8 | 12 | 3.98 | 3.98 | ||||||
| Sima et al., 2011 (53) | 1 | 14 | 2 | 16 | 5 | 11 | 16 | 2.7 | 1.3 | ||||
| Simmons et al., 2011 (27) | 1 | 8 | 8 | 8 | 8 | 3.78 | 2.48 | ||||||
| Tian et al., 2012 (54) | 1 | 11 | 11 | 11 | 11 | 2.70 | 2.70 | ||||||
| Joint United States-Canada Norovirus in Bivalve Molluscan Shellfish Risk Assessment Team, U.S. data | 19 | 28 | 53 | 81 | 2 | 57 | 22 | 81 | 3.0–3.1d | 3.0–2.0d | |||
| Grand total | 34 | 123 | 130 | 37 | 3 | 16 | 278 | 89 | 174 | 27 | 290 | ||
LOD estimated in this study.
NA, data were not available at this step of the process (influent, predisinfection sample, or effluent), but some data (for this virus, WWTP, and date) existed in other steps.
Values provided by the authors via supplemental material.
The first value is for analysis done before 2008, and the second is for analysis done after 2008.
TABLE 3.
Description of NoV GII data set
| Author, yr (reference) or source | No. of WWTPs | No. of data points |
LODa |
||||||||||
|---|---|---|---|---|---|---|---|---|---|---|---|---|---|
| Influent |
Predisinfection sample |
Effluent |
Total | Influent | Predisinfection sample and effluent | ||||||||
| Measured | Nondetected | NAb | Measured | Nondetected | NA | Measured | Nondetected | NA | |||||
| da Silva et al., 2007 (25) | 4 | 71 | 10 | 81 | 11 | 60 | 10 | 81 | 2.7 | 2.7 | |||
| Flannery et al., 2012 (11) | 1 | 13 | 25 | 38 | 37 | 1 | 38 | 2.74 | 2.74 | ||||
| Francy et al., 2012 (50) | 0 | 2.64–4.15c | 0.18–1.83c | ||||||||||
| Fumian et al., 2013 (51) | 1 | 7 | 5 | 12 | 2 | 10 | 12 | 3.28 | 3.28 | ||||
| Katayama et al., 2008 (26) | 1 | 12 | 12 | 12 | 12 | 3.15 | 2.7 | ||||||
| Nordgren et al., 2009 (52) | 1 | 11 | 1 | 12 | 7 | 5 | 12 | 3.98 | 3.98 | ||||
| Sima et al., 2011 (53) | 1 | 13 | 3 | 16 | 6 | 10 | 16 | 2.7 | 1.3 | ||||
| Simmons et al., 2011 (27) | 1 | 8 | 8 | 8 | 8 | 3.78 | 2.48 | ||||||
| Tian et al., 2012 (54) | 1 | 11 | 11 | 11 | 11 | 2.70 | 2.70 | ||||||
| Victoria et al., 2010 (55) | 1 | 11 | 1 | 12 | 7 | 5 | 12 | 3.20 | 2.24 | ||||
| Joint United States-Canada Norovirus in Bivalve Molluscan Shellfish Risk Assessment Team | |||||||||||||
| U.S. data | 20 | 89 | 6 | 95 | 32 | 40 | 23 | 95 | 3.0–3.1d | 3.0–2.0d | |||
| Canadian data | 10 | 125 | 180 | 1 | 20 | 284 | 69 | 223 | 13 | 305 | 2.24 | 2.24 | |
| Grand total | 42 | 360 | 206 | 36 | 1 | 20 | 581 | 194 | 362 | 46 | 602 | ||
LOD estimated in this study.
NA, data were not available at this step of the process (influent, predisinfection sample, or effluent), but some data (for this virus, WWTP, and date) existed in other steps.
Values provided by the authors via supplemental material.
The first value is for analysis done before 2008, and the second is for analysis done after 2008.
TABLE 4.
Description of MSC data set
| Author, yr (reference) or source | No. of WWTPs | No. of data points |
LODa |
|||||||||||
|---|---|---|---|---|---|---|---|---|---|---|---|---|---|---|
| Influent |
Predisinfection sample |
Effluent |
Total | Influent | Predisinfection sample and effluent | |||||||||
| Measured | TNTCb | NAc | Measured | Nondetected | NA | Measured | Nondetected | TNTC | NA | |||||
| Francy et al., 2012 (50) | 4 | 19 | 13 | 6 | 5 | 14 | 19 | 1.0 | ||||||
| Haramoto et al., 2006 (49) | 1 | 11 | 11 | 0 | 9 | 2 | 11 | 2.0 | ||||||
| Joint United States-Canada Norovirus in Bivalve Molluscan Shellfish Risk Assessment Team | ||||||||||||||
| U.S. data | 39 | 170 | 1 | 12 | 3 | 156 | 89 | 38 | 44 | 171 | 2.0 | |||
| Canadian data | 18 | 371 | 20 | 3 | 114 | 30 | 250 | 199 | 174 | 4 | 17 | 394 | 2.3 | |
| Grand total | 62 | 571 | 20 | 4 | 150 | 39 | 406 | 302 | 228 | 4 | 61 | 595 | ||
LOD estimated in this study.
TNTC, too numerous to count (right censored).
NA, data were not available at this step of the process (influent, predisinfection sample, or effluent), but some data (for this virus, WWTP, and date) existed in other steps.
Figure 2 provides the empirical cumulative distributions of the NoV GI, NoV GII, and MSC concentration data included in the Bayesian inference model. These graphs explicitly illustrate the marginal decrease in concentration from the influent to the final effluent for NoV GI, NoV GII, and MSCs. They also illustrate that the concentration of NoV in effluent water can reach high values (e.g., for NoV GI, 13/263 measurements with >105 gc/liter; for NoV GII, 15/566 measurements with >105 gc/liter; for MSCs, 104/534 measurements with >105 PFU per liter).
FIG 2.
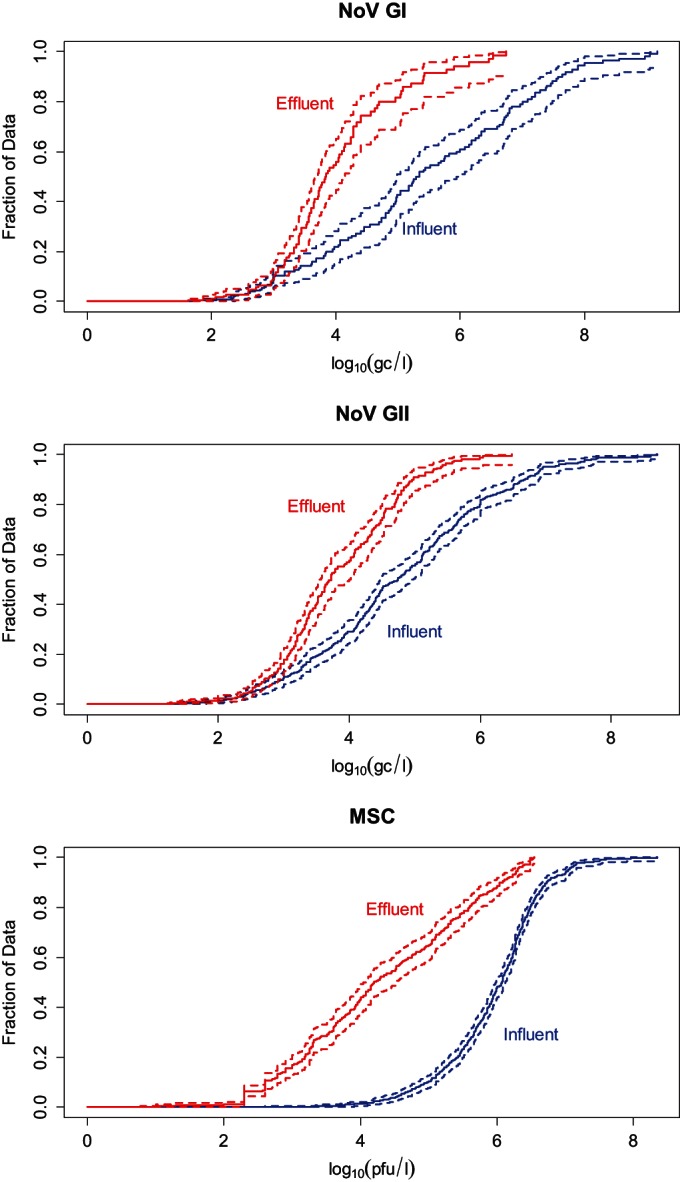
Survival-like function (solid line) and 95% confidence interval (dashed lines) for the influent (in blue) and the effluent (in red) data. Data for NoV GI, NoV GII, and MSCs are shown.
Model results.
(i) Concentration in influent.
Table 5 presents the medians and the 95% CIs of the conditional prior model parameters, that is, values from a naive model that considers only the prior distributions before the incorporation of the observed data. The credible intervals are extremely large, which reflects our intention to use a prior which was as uninformative as possible. The comparison of these conditional prior distributions with the conditional posterior distributions demonstrates the impact of the information provided by the data on these parameter estimates.
TABLE 5.
Statistics of the conditional prior and conditional posterior distributions for some parameters of the model
| Parameter type and parameter | Median (95% CI) conditional prior distribution | Conditional posterior distributiona |
|||
|---|---|---|---|---|---|
| Mean | Median | P2.5% | P97.5% | ||
| Expected mean parameter | |||||
| NoV GI influent concn (log10 gc/liter) | 3.8 (−5.4, 11) | 1.5 | 1.5 | 0.4 | 2.4 |
| NoV GII influent concn (log10 gc/liter) | 1.9 (−8.2, 9.1) | 3.9 | 3.9 | 3.5 | 4.3 |
| MSC influent concn (no. of log10 PFU/liter) | 1.6 (−6.9, 7.7) | 6.2 | 6.2 | 6.1 | 6.4 |
| NoV GI baseline log reduction (log10 gc/liter) | −4.3 (−13.9, 7.4) | −1.7 | −1.6 | −3.3 | −0.2 |
| NoV GII baseline log reduction (log10 gc/liter) | −0.9 (−15.8, 10.9) | −2.0 | −2.0 | −2.9 | −1.0 |
| MSC baseline log reduction (no. of log10 PFU/liter) | 0.3 (−7.7, 11.2) | −2.8 | −2.8 | −3.5 | −2.1 |
| WWTP-to-WWTP variation parameter (SD) | |||||
| NoV GI influent concn (log10 gc/liter) | 1.5 (0.7, 3.6) | 2.2 | 2.1 | 1.5 | 3.2 |
| NoV GII influent concn (log10 gc/liter) | 1.5 (0.7, 4.4) | 1.3 | 1.3 | 1.0 | 1.6 |
| MSC influent concn (no. of log10 PFU/liter) | 1.5 (0.7, 3.6) | 0.6 | 0.6 | 0.5 | 0.7 |
| NoV GI log reduction (log10 gc/liter) | 1.5 (0.7, 3.7) | 1.3 | 1.3 | 0.8 | 2.0 |
| NoV GII log reduction (log10 gc/liter) | 1.6 (0.7, 4.2) | 1.8 | 1.7 | 1.3 | 2.4 |
| MSC log reduction (no. of log10 PFU/liter) | 1.5 (0.7, 4.4) | 1.6 | 1.6 | 1.3 | 2.0 |
| Variation from model | |||||
| NoV GI influent concn (σI,NoV GI) (log10 gc/liter) | 0.9 (0, 4.2) | 1.5 | 1.5 | 1.3 | 1.8 |
| NoV GII influent concn (σI,NoV GII) (log10 gc/liter) | 1.2 (0, 3.7) | 1.4 | 1.4 | 1.3 | 1.6 |
| MSC influent concn (σI,MSC) (no. of log10 PFU/liter) | 1.3 (0.1, 3.7) | 0.9 | 0.9 | 0.9 | 1.0 |
| NoV GI effluent concn (σE,NoV GI) (log10 gc/liter) | 2.3 (0.2, 5.6) | 2.2 | 2.2 | 1.9 | 2.5 |
| NoV GII effluent concn (σE,NoV GII) (log10 gc/liter) | 1.9 (0.1, 5.1) | 1.3 | 1.3 | 1.2 | 1.5 |
| MSC effluent concn (σE,MSC) (no. of log10 PFU/liter) | 2.4 (0.3, 5.3) | 0.5 | 0.5 | 0.5 | 0.6 |
P2.5% and P97.5%, 2.5th and 97.5th percentiles, respectively.
The 95% CIs of the conditional posterior distributions are narrower than those of the conditional prior distributions (Table 5), indicating that the data provide information. The expected mean concentrations of NoV GI and NoV GII in influent over WWTPs are estimated to be 1.5 log10 gc/liter (95% CI, 0.4, 2.4 log10 gc/liter) and 3.9 log10 gc/liter (95% CI, 3.5, 4.3 log10 gc/liter), respectively. The mean concentration of NoV GI is significantly lower than that of NoV GII. Nevertheless, the variations from one WWTP to the other around the mean parameters were large, with WWTP-to-WWTP standard deviations of 2.2 log10 gc/liter for NoV GI and 1.3 log10 gc/liter for NoV GII.
As shown in Table 5, the mean concentration of MSCs in influent over WWTPs was significantly higher than that of NoV, with an estimated mean MSC concentration of 6.2 log10 PFU per liter (95% CI, 6.1, 6.4 log10 PFU per liter). The variations across WWTPs were lower for MSCs (0.6 log10 PFU per liter) than for NoV. The standard deviation from the model for the MSC concentration in influent (σI,MSC) shown in Table 5 is lower than the one for NoV (estimated concentrations, 0.9 log10 PFU per liter for MSCs versus 1.5 gc/liter for log10 NoV GI and 1.4 log10 gc/liter for NoV GI).
The model, as populated with the data available, was able to discriminate monthly variations in influent concentrations for NoV GI, NoV GII, and MSCs (Fig. 3). For NoV GI, a significantly higher mean concentration than the 12-month mean is predicted in March and April, and a significantly lower one is predicted in October and November. For NoV GII, a significantly higher mean concentration than the 12-month mean is predicted from January to April, and a significantly lower one is predicted from July to November. For MSCs, a significantly higher concentration than the 12-month mean is predicted from February to June, and a significantly lower one is predicted from August to December.
FIG 3.
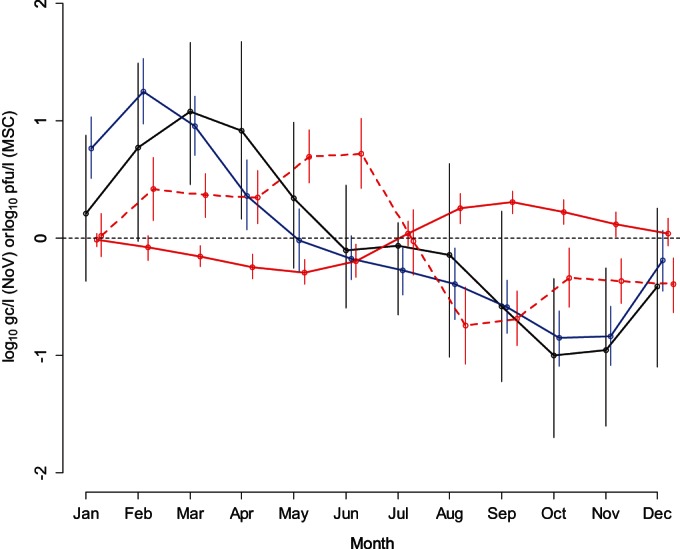
Monthly variation relative to the mean of the expected concentrations of NoV GI (black line; log10 gc/liter), NoV GII (blue line; log10 gc/liter), and MSCs (solid red line; log10 number of PFU per liter) in WWTP influent and monthly variation relative to the mean log10 reduction of MSCs (red dashed line; log10 number of PFU per liter) predicted by the model. Circles represent the medians of the posterior distributions, while segments represent the 95% CIs of the posterior distributions. As an example, the MSC mean log10 reduction was significantly lower (the month effect is positive) than the average from February to June and significantly higher than the average from August to December.
(ii) Log10 reduction.
Table 6 provides estimates and 95% CIs for mean log10 reductions [mean(λw,g) + γmech,v + ϕtt,v] for various combinations of genogroup/virus, type of WWTP, and disinfection process considered in this analysis. For WWTPs with mechanical systems without disinfection, a mean log10 reduction of the number of genome copies of −2.2 (95% CI, −3.7, −0.8) is expected for NoV GI, and a mean log10 reduction of the number of genome copies of −2.5 (95% CI, −3.4, −1.6) is expected for NoV GII (Table 6). The disinfection effect ϕtt,NoV is not statistically significant with the available data for either chlorine or UV disinfection for the reduction in NoV genome copy numbers.
TABLE 6.
Statistics of posterior distribution of mean log10 reduction according to type of WWTP, disinfection treatment, and genogroup/virus
| WWTP type | Disinfection | Genogroup or virus | Log10 reductiona |
|||
|---|---|---|---|---|---|---|
| Mean | Median | P2.5% | P97.5% | |||
| Mechanical system | None | NoV GI | −2.2 | −2.2 | −3.7 | −0.8 |
| NoV GII | −2.5 | −2.5 | −3.4 | −1.6 | ||
| MSCs | −2.4 | −2.4 | −2.9 | −1.9 | ||
| Chlorine | NoV GI | −2.4 | −2.4 | −3.9 | −1.1 | |
| NoV GII | −2.7 | −2.7 | −3.6 | −1.9 | ||
| MSCs | −2.9 | −2.8 | −3.4 | −2.4 | ||
| UV | NoV GI | −3.0 | −3.0 | −4.6 | −1.5 | |
| NoV GII | −3.3 | −3.3 | −4.4 | −2.3 | ||
| MSCs | −4.3 | −4.3 | −4.9 | −3.7 | ||
| Lagoon system | None | NoV GI | −1.2 | −1.2 | −3.1 | 0.8 |
| NoV GII | −1.5 | −1.5 | −2.9 | 0.0 | ||
| MSCs | −3.2 | −3.2 | −4.3 | −2.0 | ||
| Chlorine | NoV GI | −1.4 | −1.4 | −3.3 | 0.5 | |
| NoV GII | −1.7 | −1.7 | −3.1 | −0.3 | ||
| MSCs | −3.6 | −3.6 | −4.8 | −2.4 | ||
| UV | NoV GI | −2.0 | −2.0 | −4.1 | 0.0 | |
| NoV GII | −2.3 | −2.3 | −3.8 | −0.7 | ||
| MSCs | −5.0 | −5.0 | −6.2 | −3.9 | ||
Data are in gc/liter for NoV and number of PFU/liter for MSCs. P2.5% and P97.5%,2.5th and 97.5th percentiles, respectively.
Similarly, the value for the factor γmech,v was not statistically different from 0, indicating that the available data cannot discriminate mechanical versus lagoon treatment regarding the log10 reduction of NoV genome copy numbers.
In our analysis, the efficiencies by which WWTPs with mechanical and lagoon systems reduce the infective MSC concentration (in number of PFU per liter) were not significantly different. In contrast, disinfection appeared to have a considerable effect on the reduction in the number of log10 PFU of MSCs per liter. The effects of chlorine and UV was both statistically significant compared to those of no disinfection, with an additional −0.4-log10 change for chlorine (95% CI, −0.7, −0.1 log10) and an additional −1.9-log10 change for UV (95% CI, −2.2, −1.6 log10). The seasonal dependence of the log10 reduction, as characterized by the month effect δm,g, was never significantly different from 0 for the log10 reduction for NoV GI or NoV GII (in gc/liter) but was significant for the log10 reduction for MSCs (in number of PFU per liter) (Fig. 3). The MSC mean log10 reduction was significantly lower (the month effect was positive) from February to June and higher from August to December.
(iii) Correlation between influent concentrations of NoV GI, NoV GII, and MSCs and log10 reductions within the same WWTP.
The use of a multivariate normal distribution enables evaluation of the correlation coefficient between parameters among WWTPs (Table 7). Within WWTPs, significant correlations were identified between the mean NoV GII influent concentration (in gc/liter) and (i) the mean NoV GI influent concentration (in gc/liter) (the higher that the NoV GII influent concentration was, the higher that the NoV GI influent concentration was), (ii) the mean MSC influent concentration (in number of PFU per liter) (the higher that the NoV GII influent concentration was, the higher that the MSC influent concentration was), (iii) the mean log10 NoV GII reduction (the higher that the NoV GII influent concentration was, the higher that its log10 reduction was), and (iv) the mean log10 MSC reduction (the higher that the NoV GII influent concentration was, the higher that the log10 reduction for MSCs was).
TABLE 7.
Correlation coefficient between mean influent and log10 reductions within the same WWTP for NoV GI, NoV GII, and MSCs
| Parameter | Correlation coefficient (95% CI) |
||||
|---|---|---|---|---|---|
| 12-mo mean influent concn |
Log reduction |
||||
| NoV GI | NoV GII | MSCs | NoV GI | NoV GII | |
| Influent concn | |||||
| NoV GII | 0.7 (0.3, 0.9) | ||||
| MSCs | 0.3 (−0.2, 0.6) | 0.4 (0.1, 0.7) | |||
| Log reduction | |||||
| NoV GI | −0.1 (−0.7, 0.7) | −0.2 (−0.8, 0.6) | −0.1 (−0.5, 0.5) | ||
| NoV GII | −0.3 (−0.6, 0.1) | −0.5 (−0.8, −0.2) | −0.3 (−0.6, 0.1) | 0.5 (−0.2, 0.8) | |
| MSCs | −0.3 (−0.6, 0.2) | −0.5 (−0.8, −0.1) | −0.2 (−0.5, 0.1) | 0.5 (−0.2, 0.8) | 0.8 (0.6, 0.9) |
A highly significant correlation (0.8; 95% CI, 0.6, 0.9) between the mean log10 reduction in NoV GII and the mean log10 reduction in MSCs was also found (e.g., the higher that the mean log10 reduction in NoV GII was, the higher that the mean log10 reduction in MSCs was). Correlations between individual measurements of a concentration/log10 reduction of MSCs or NoV genogroups and those for another measurement within a single WWTP are expected to be weaker because of the large variability in these values.
DISCUSSION
Wastewater treatment is intended to reduce the risk of exposure of the public to bacterial and viral pathogens. Nevertheless, under certain conditions, processed and treated WWTP effluent may still contain pathogens and thus can contaminate the environment and possibly impact the safety of shellfish harvested in these areas (9). A key element in the management of the public health risk may lie in the reduction of NoV concentrations in sewage during wastewater treatment (9). Precise estimates of the removal of NoV during wastewater treatment and its variation are needed to inform the modification of current risk management practices and policies and/or the development of new risk management practices and policies.
Data are heterogeneous, but meta-analysis provides more comprehensive information than individual studies.
Multiple investigations have been undertaken to develop reliable quantification methods (semiquantitative RT-PCR and then RT-qPCR, notably) to determine enteric virus concentrations in wastewater and to evaluate the log10 reduction of enteric viruses in WWTPs (49, 52, 57–59). In general, these studies indicate a high prevalence of NoV in influent, with a higher prevalence for NoV GII than for NoV GI; a marked seasonality characterized by a winter peak concentration in WWTP influent; a reduced WWTP efficiency for removal of NoV compared with that for removal of bacterial contaminants; and a resulting presence of NoV in effluent (9, 25, 58, 60). The studies report data collected in one or a few WWTPs and, as such, do not provide a description of how these parameters vary among WWTPs with similar or different designs or an estimate of the average values of these parameters across WWTPs. The present meta-analysis provides a description of the viral concentrations, log10 reductions, and variability in these values more general than that which has been previously presented.
The data used in this meta-analysis came from heterogeneous sources that used various sample processing (e.g., concentration and extraction) and detection methods. Such heterogeneity among the included studies can lead to variations in the precision of measurements, adding to the inherent variability of virus removal and inactivation efficacy among different WWTPs reflected in the data. The sample collection methods used also varied among the studies included in this analysis. In some studies, temporal composite samples were collected (e.g., samples were collected over 24 h), while in other studies, grab samples were collected (i.e., samples were collected at a single point in time). The sample collection method selected can impact the accuracy and precision of WWTP viral reduction efficiency estimates when the concentration of virus varies significantly with time.
Facing this heterogeneity, our approach was to initiate the data collection process with a comprehensive search of the data, followed by a secondary examination with a selection of the methods and data included on the basis of the expert judgment of a panel of subject matter experts. In this process, the LODs from the studies were evaluated or reevaluated. Some data points were excluded due to inefficient protocols or methods or missing information.
The model implicitly assumes that the WWTPs evaluated in the literature and in the United States and Canadian surveillance samples included in the analysis are representative of WWTPs worldwide. Similarly, it is assumed that the data included in this model incorporate data obtained from various situations that are typically experienced by WWTPs, including high flows that may impact treatment efficacy or the log10 reduction. For example, storm water and infiltration/inflow caused by a storm event may lower the concentration of enteric viruses in the influent through dilution, while reductions in other critical factors, such as the hydraulic retention/treatment time, may diminish the effectiveness of treatment. We assumed that the data included in the inference model were not derived from exceptional events, such as failures in disinfection or treatment bypasses of untreated wastewater, because the surveillance data from the United States and Canada were derived from nominally compliant WWTPs and none of the published articles identified unusual or exceptional WWTP operating conditions. Specific data are needed to allow a better characterization of the impact of these types of events on viral concentrations and log10 reductions (9).
The statistical method appropriately addresses censored data.
In the peer-reviewed scientific literature, evaluations of log10 reductions are usually performed by assigning a value (e.g., 0 or LOD [27, 61] or one-half the LOD or an arbitrary value [52]) to measurements below the LOD, by ignoring those values (25), or by providing only a lower limit of the actual log10 reduction (e.g., a log10 reduction of ≤−3.8 [53]). Ignoring censored data or replacing these observations with a given value biases the inference process (62, 63). It can also lead to an artificial correlation between the influent concentration and log10 reduction. More accurate estimates were achieved with the statistical method used in this study, which considered censored data, by including the information provided by observations below the LOD or observations greater than a limit of enumeration. Nevertheless, due to the large number of censored data points in the analyzed data set (more than 50% of effluent data), our analysis may lack power. Therefore, when an effect is not found to be statistically significant, it does not necessarily mean that there is no effect. The effect may be not large enough to discern with this data set, due to the lack of power. The impact of censored data is notable when comparing the high precision of the parameters obtained for MSCs, for which few censored data were observed, with the level of precision of the parameters obtained for NoV. Future technical improvements in analytical methodology, notably, in the extraction method, could lower the LOD in future studies and eliminate these issues.
Influent concentrations of NoV GII are higher than those of NoV GI, with a large seasonal dependence being observed.
The detection of NoV in raw sewage reflects viral illness in the community (64). Our meta-analysis included data from a large number of WWTPs and spanned all 12 months of the calendar year, thereby better characterizing the WWTP-to-WWTP and month-to-month variations reported in the literature. We estimated that the mean influent log10 concentration of NoV GII over WWTPs (average, 3.9 log10 gc/liter) was higher than the mean influent log10 concentration for NoV GI (average, 1.5 log10 gc/liter). This result is consistent with other reports in the literature (49, 65, 66) and with epidemiological data (4). A large variation in influent concentration was nevertheless observed from WWTP to WWTP (standard deviations, 2.2 and 1.3 for NoV GI and NoV GII, respectively).
The general seasonal variation in NoV influent concentrations reported in the literature was observed and quantified in the present analysis. Our inference model results estimated that NoV GI and NoV GII influent concentrations were higher from January to May than from June to November, which is consistent with other specific reports in the literature (25, 26, 53). As an example, Katayama et al. (26) reported NoV influent concentrations to be more abundant in winter than in summer, which is consistent with the present model results (±1 log10; Fig. 3), although the peaks in concentration predicted for NoV GI and NoV GII in the present model, on the basis of a meta-analysis of the available literature, are shifted by about 2 months from that specifically reported by Katayama et al. (26). Interestingly, Victoria et al. (55) reported a peak virus load in July in Rio de Janeiro, Brazil, which is a cold month in Brazil. We considered the hemispheric seasonal shift by applying a 6-month lag to the month for data collected in the Southern Hemisphere. Epidemiological data have also identified a seasonal dependence for NoV illness in the population (67).
We confirm that NoV GI and NoV GII may be present in influent and effluent all year long. A strong correlation between the mean NoV GI and NoV GII influent concentrations within a WWTP was obtained in this analysis (0.7; 95% CI, 0.3, 0.9), as was also observed in a specific WWTP by Nordgren et al. (52). The high WWTP-to-WWTP variation in NoV GI and GII mean influent concentrations and the correlation between NoV GI and NoV GII mean influent concentrations are important results, as they suggest that some WWTPs receive sewage that is highly contaminated with both NoV GI and NoV GII. Further studies focusing on describing these specific WWTPs on the basis of particular characteristics (such as flow or catchment) will provide critical information for assessing and improving the management of the public health risk linked to estuary NoV concentrations originating from WWTPs.
Low reduction in NoV genome copy numbers in WWTPs.
Virus elimination during WWTP processing is dependent on a wide array of factors, including temperature, solar radiation, adsorption to particulate matter, enzymatic destruction, and predation by bacteria and protozoa (9). Unfortunately, any analysis of these effects, including the present meta-analysis, is limited by the available data. Information on a relatively few WWTP settings has been reported in the literature. A more detailed delineation among the general characteristics of the WWTPs beyond whether they had a mechanical or a lagoon system could not be used, because of large variations in WWTP engineering designs and the absence of this information in the literature providing measurements of viral concentrations in WWTP influent and effluent. The estimated log10 reductions for WWTPs with mechanical and lagoon systems represent marginal log10 reductions (i.e., reductions averaged over all other characteristics) for WWTPs of those two types, assuming that the WWTPs present in the database are representative of all WWTPs.
Our analysis indicates that, on average, reductions of −2.2 log10 for NoV GI genome copies and −2.5 log10 for NoV GII genome copies in WWTPs with mechanical systems are expected before disinfection but that the variations from WWTP to WWTP are great. Substituting values under the LOD by one-half the LOD, Nordgren et al. (52) obtained average log10 reductions of −1.4 for NoV GI and −1.2 for NoV GII in the municipal wastewater treatment of Gothenburg, Sweden. Laverick et al. (68) found a −2 log10 reduction. The results that we obtained here are in line with the current observations that WWTPs are relatively inefficient in reducing the concentration of NoV genome copies and confirm a large variability from WWTP to WWTP.
The type of WWTP (i.e., a WWTP with a lagoon versus a mechanical system) and the disinfection treatment modulate the log10 reduction effects. Nevertheless, there is uncertainty in the estimated differences among log10 reductions, and none of these differences are statistically significant for NoV genome copy numbers. A similar performance with regard to NoV genome copy removal in waste stabilization pond, activated sludge, and submerged membrane bioreactor treatments was found by da Silva et al. (25) in a specific study. In lagoon systems with long retention times, the viral log10 reduction calculated may be questionable if grab samples of influent and effluent are collected without consideration of retention times. Samples of effluent collected for detection of virus are potentially being compared with samples of influent that arrived at the WWTP during a very different part of the seasonal cycle and/or during periods of high or low shedding. Moreover, lagoons are often located in small population centers, where influent viral loads may vary widely.
The disinfection effect for NoV (in gc/liter) removal in this meta-analysis was not statistically significant. More data on predisinfection concentrations within WWTPs would refine the estimate of the disinfection effect. Note that MSC results, which indicate a significant disinfection effect (see below), suggest that a loss of viral infectivity (which cannot be measured for NoV) plays a larger role than physical removal of virus particles from disinfection.
The correlation between the mean influent concentration of NoV and the log10 reduction achieved within a WWTP was low and significant only for NoV GII. As a consequence of these two observations, the monthly variation in the influent concentrations of NoV GI and NoV GII is also expected to be observed for the effluent, with peaks of concentration being expected in winter. These higher effluent concentrations of NoV GI and NoV GII in winter predicted by the model provide critical information for the assessment of the public health risk associated with activities impacted by estuary contamination during this time, e.g., consumption of raw oysters harvested during the winter months.
MSC as a possible treatment process index.
The estimates of the mean log10 reductions in NoV GI and NoV GII genome copy numbers achieved by different WWTPs provide lower limits on the mean log10 reductions of infectious particles. In contrast, estimates of the mean log10 reductions for MSCs in the present model reflect reductions in infectious particles because these are based on culture-based measurements (numbers of PFU per liter). In the absence of a culture-based method for enumerating NoV particles, measurements for MSCs continue to be explored as possible surrogate measures for infective NoV (28, 29).
The seasonal variability in the MSC mean influent concentration is lower in magnitude than that observed for NoV. MSC peak concentrations are observed in August and September (Fig. 3).
A significant correlation between the mean influent concentrations of NoV GII and MSCs within the same WWTP was observed, meaning that if the average concentration of MSCs in influent is high for a given WWTP, the average concentration of NoV GII in influent is expected to be high.
A strong correlation (0.8; 95% CI, 0.6, 0.9) between the mean log10 reductions of NoV GII and MSCs was observed. Among WWTPs of a given type, a higher mean log10 reduction of MSCs for a WWTP was then associated with a higher mean log10 reduction for NoV GII. This result suggests that MSCs could be useful in evaluating the efficiency of a WWTP. Indeed, given that MSCs are present at high concentrations in influent throughout the year, censored data are infrequent. As a consequence, estimates of the log10 reduction achieved within a given WWTP are expected to be more precise than those derived from NoV measurements, as illustrated in the present model results.
The model results indicate that WWTPs with either chlorine or UV disinfection achieve significantly larger reductions for MSCs (in number of PFU per liter) but not NoV (in gc/liter) than WWTPs without disinfection. This may be due to the inactivation of particles, which is captured by the infectivity assay for MSCs but not the molecular/particle-based detection assays for NoV. Dancho et al. (69) showed that estimates of the NoV GI log10 reduction obtained following UV irradiation can differ when only molecular-based methods are used and when a binding assay is used in combination with molecular methods to isolate potentially infectious particles. Specifically, their data showed that the reduction in the amount of NoV GI particles that can bind is larger than the reduction in the total amount of NoV GI particles following treatment. If the differences in the log10 reductions between MSCs and NoV characterized in the present analysis are reflective of the differences in the losses of infective particles and total particles, then the mean log10 reduction estimates for MSCs provide a surrogate measure of the mean log10 reduction for infective NoV particles.
The large difference between the estimated mean log10 reductions for MSCs (in number of PFU per liter) in lagoons in the absence of disinfection and that for NoV GI and NoV GII (in gc/liter) may also be a reflection of inactivation facilitated by extended retention times and exposure to sunlight during retention.
Model implementation in a quantitative risk assessment.
The model and its structure were developed to support its use by the Joint United States-Canada Norovirus in Bivalve Molluscan Shellfish Risk Assessment Team and can be adapted for use in other related risk assessments, e.g., risk assessments associated with recreational waters impacted by WWTPs. On the basis of the available information, this meta-analysis focuses on estimating the magnitude and seasonal variation in NoV and MSC concentrations in WWTP influent and the overall log10 reduction of NoV and MSC concentrations achieved by WWTPs. The inference model determines the significance and provides estimates of the impact of WWTP type, disinfection, and seasonality (month). Indeed, the level of enteric virus may vary widely depending on several factors, such as the number of ill people in the population served, the size of the catchment area served by the WWTP, the type of treatment, meteorological conditions, and seasonal changes. The use of a random effect to characterize WWTPs allows the model to be used to simulate the influent and effluent concentrations of NoV in specific types of WWTPs or a WWTP at random.
ACKNOWLEDGMENTS
We acknowledge and thank the scientists and operational staff from the U.S. Food and Drug Administration, Canadian Food Inspection Agency, Environment Canada, and Health Canada who participated in the collection and analysis of WWTP surveillance samples and reporting of results for WWTP surveillance samples and results contained within the meta-analysis, including Sabah Bidawid and Kirsten Mattison, as well as Nathalie Corneau, Oksana Mykytczuk, and Jennifer Harlow from the Health Canada Food Virology Reference Centre. We recognize the state, provincial, and municipal staff members for their crucial assistance. We also thank Jean-Baptiste Denis, INRA, France, for his help in the development of the model.
REFERENCES
- 1.Scallan E, Hoekstra RM, Angulo FJ, Tauxe RV, Widdowson MA, Roy SL, Jones JL, Griffin PM. 2011. Foodborne illness acquired in the United States—major pathogens. Emerg Infect Dis 17:7–12. doi: 10.3201/eid1701.P11101. [DOI] [PMC free article] [PubMed] [Google Scholar]
- 2.Thomas MK, Murray R, Flockhart L, Pintar K, Pollari F, Fazil A, Nesbitt A, Marshall B. 2013. Estimates of the burden of foodborne illness in Canada for 30 specified pathogens and unspecified agents, circa 2006. Foodborne Pathog Dis 10:639–648. doi: 10.1089/fpd.2012.1389. [DOI] [PMC free article] [PubMed] [Google Scholar]
- 3.Hall AJ, Lopman BA, Payne DC, Patel MM, Gastanaduy PA, Vinje J, Parashar UD. 2013. Norovirus disease in the United States. Emerg Infect Dis 19:1198–1205. doi: 10.3201/eid1908.130465. [DOI] [PMC free article] [PubMed] [Google Scholar]
- 4.Patel MM, Hall AJ, Vinje J, Parashar UD. 2009. Noroviruses: a comprehensive review. J Clin Virol 44:1–8. doi: 10.1016/j.jcv.2008.10.009. [DOI] [PubMed] [Google Scholar]
- 5.Mesquita JR, Costantini VP, Cannon JL, Lin SC, Nascimento MS, Vinje J. 2013. Presence of antibodies against genogroup VI norovirus in humans. Virol J 10:176. doi: 10.1186/1743-422X-10-176. [DOI] [PMC free article] [PubMed] [Google Scholar]
- 6.Atmar RL. 2010. Noroviruses—state of the art. Food Environ Virol 2:117–126. doi: 10.1007/s12560-010-9038-1. [DOI] [PMC free article] [PubMed] [Google Scholar]
- 7.Hall AJ, Eisenbart VG, Etingue AL, Gould LH, Lopman BA, Parashar UD. 2012. Epidemiology of foodborne norovirus outbreaks, United States, 2001–2008. Emerg Infect Dis 18:1566–1573. doi: 10.3201/eid1810.120833. [DOI] [PMC free article] [PubMed] [Google Scholar]
- 8.Shieh YC, Baric RS, Woods JW, Calci KR. 2003. Molecular surveillance of enterovirus and Norwalk-like virus in oysters relocated to a municipal-sewage-impacted gulf estuary. Appl Environ Microbiol 69:7130–7136. doi: 10.1128/AEM.69.12.7130-7136.2003. [DOI] [PMC free article] [PubMed] [Google Scholar]
- 9.Maalouf H, Pommepuy M, Le Guyader FS. 2010. Environmental conditions leading to shellfish contamination and related outbreaks. Food Environ Virol 2:136–145. doi: 10.1007/s12560-010-9043-4. [DOI] [Google Scholar]
- 10.Burkhardt W III, Calci KR. 2000. Selective accumulation may account for shellfish-associated viral illness. Appl Environ Microbiol 66:1375–1378. doi: 10.1128/AEM.66.4.1375-1378.2000. [DOI] [PMC free article] [PubMed] [Google Scholar]
- 11.Flannery J, Keaveney S, Rajko-Nenow P, O'Flaherty V, Dore W. 2012. Concentration of norovirus during wastewater treatment and its impact on oyster contamination. Appl Environ Microbiol 78:3400–3406. doi: 10.1128/AEM.07569-11. [DOI] [PMC free article] [PubMed] [Google Scholar]
- 12.Biancani PJ, Carmichael RH, Daskin JH, Burkhardt W, Calci KR. 2012. Seasonal and spatial effects of wastewater effluent on growth, survival, and accumulation of microbial contaminants by oysters in Mobile Bay, Alabama. Estuar Coast 35:121–131. doi: 10.1007/s12237-011-9421-7. [DOI] [Google Scholar]
- 13.Sobsey MD, Shields PA, Hauchman FS, Davis AL, Rullman VA, Bosch A. 1987. Survival and persistence of hepatitis A virus in environmental samples. J Med Virol 21:A23. [Google Scholar]
- 14.Dore WJ, Lees DN. 1995. Behavior of Escherichia coli and male-specific bacteriophage in environmentally contaminated bivalve mollusks before and after depuration. Appl Environ Microbiol 61:2830–2834. [DOI] [PMC free article] [PubMed] [Google Scholar]
- 15.National Shellfish Sanitation Program. 2011. Guide for the control of molluscan shellfish. National Shellfish Sanitation Program, U.S. Food and Drug Administration, Silver Spring, MD: http://www.fda.gov/downloads/Food/GuidanceRegulation/FederalStateFoodPrograms/UCM350344.pdf. [Google Scholar]
- 16.Canadian Shellfish Sanitation Program. 2012. Manual of operations. Canadian Shellfish Sanitation Program, Ottawa, Ontario, Canada: http://www.inspection.gc.ca/food/fish-and-seafood/manuals/canadian-shellfish-sanitation-program/eng/1351609988326/1351610579883. [Google Scholar]
- 17.Ottoson J, Hansen A, Westrell T, Johansen K, Norder H, Stenstrom TA. 2006. Removal of noro- and enteroviruses, Giardia cysts, Cryptosporidium oocysts, and fecal indicators at four secondary wastewater treatment plants in Sweden. Water Environ Res 78:828–834. doi: 10.2175/106143006X101719. [DOI] [PubMed] [Google Scholar]
- 18.Baggi F, Demarta A, Peduzzi R. 2001. Persistence of viral pathogens and bacteriophages during sewage treatment: lack of correlation with indicator bacteria. Res Microbiol 152:743–751. doi: 10.1016/S0923-2508(01)01255-4. [DOI] [PubMed] [Google Scholar]
- 19.Burkhardt W III, Woods JW, Calci KR. 2005. Evaluation of wastewater treatment plant efficiency to reduce bacterial and viral loading using real-time RT- PCR. Abstr 105th Gen Meet Am Soc Microbiol. American Society for Microbiology, Washington, DC. [Google Scholar]
- 20.Harwood VJ, Levine AD, Scott TM, Chivukula V, Lukasik J, Farrah SR, Rose JB. 2005. Validity of the indicator organism paradigm for pathogen reduction in reclaimed water and public health protection. Appl Environ Microbiol 71:3163–3170. doi: 10.1128/AEM.71.6.3163-3170.2005. [DOI] [PMC free article] [PubMed] [Google Scholar]
- 21.Miescier JJ, Cabelli VJ. 1982. Enterococci and other microbial indicators in municipal wastewater effluents. J Water Pollut Control Fed 54:1599–1606. [Google Scholar]
- 22.Griffin DW, Lipp EK, McLaughlin MR, Rose JB. 2001. Marine recreation and public health microbiology: quest for the ideal indicator. Bioscience 51:817–825. doi: 10.1641/0006-3568(2001)051[0817:MRAPHM]2.0.CO;2. [DOI] [Google Scholar]
- 23.LaBelle RL, Gerba CP, Goyal SM, Melnick JL, Cech I, Bogdan GF. 1980. Relationships between environmental factors, bacterial indicators, and the occurrence of enteric viruses in estuarine sediments. Appl Environ Microbiol 39:588–596. [DOI] [PMC free article] [PubMed] [Google Scholar]
- 24.da Silva AK, Le Guyader FS, Le Saux JC, Pommepuy M, Montgomery MA, Elimelech M. 2008. Norovirus removal and particle association in a waste stabilization pond. Environ Sci Technol 42:9151–9157. doi: 10.1021/es802787v. [DOI] [PubMed] [Google Scholar]
- 25.da Silva AK, Le Saux JC, Parnaudeau S, Pommepuy M, Elimelech M, Le Guyader FS. 2007. Evaluation of removal of noroviruses during wastewater treatment, using real-time reverse transcription-PCR: different behaviors of genogroups I and II. Appl Environ Microbiol 73:7891–7897. doi: 10.1128/AEM.01428-07. [DOI] [PMC free article] [PubMed] [Google Scholar]
- 26.Katayama H, Haramoto E, Oguma K, Yamashita H, Tajima A, Nakajima H, Ohgaki S. 2008. One-year monthly quantitative survey of noroviruses, enteroviruses, and adenoviruses in wastewater collected from six plants in Japan. Water Res 42:1441–1448. doi: 10.1016/j.watres.2007.10.029. [DOI] [PubMed] [Google Scholar]
- 27.Simmons FJ, Kuo DHW, Xagoraraki I. 2011. Removal of human enteric viruses by a full-scale membrane bioreactor during municipal wastewater processing. Water Res 45:2739–2750. doi: 10.1016/j.watres.2011.02.001. [DOI] [PubMed] [Google Scholar]
- 28.Lasobras J, Dellunde J, Jofre J, Lucena F. 1999. Occurrence and levels of phages proposed as surrogate indicators of enteric viruses in different types of sludges. J Appl Microbiol 86:723–729. doi: 10.1046/j.1365-2672.1999.00722.x. [DOI] [PubMed] [Google Scholar]
- 29.Simpson D, Jacangelo J, Loughran P, McIlroy C. 2003. Investigation of potential surrogate organisms and public health risk in UV irradiated secondary effluent. Water Sci Technol 47:37–43. [PubMed] [Google Scholar]
- 30.Bustin SA, Nolan T. 2004. Pitfalls of quantitative real-time reverse-transcription polymerase chain reaction. J Biomol Tech 15:155–166. [PMC free article] [PubMed] [Google Scholar]
- 31.Woods JS. 2010. Determining the relationship of human enteric viruses in clinical, wastewater, and environmental samples utilizing molecular and cell culture techniques. Ph.D. dissertation The University of Southern Mississippi, Hattiesburg, MS. [Google Scholar]
- 32.Formiga-Cruz M, Hundesa A, Clemente-Casares P, Albiñana-Gimenez N, Allard A, Girones R. 2005. Nested multiplex PCR assay for detection of human enteric viruses in shellfish and sewage. J Virol Methods 125:111–118. doi: 10.1016/j.jviromet.2005.01.009. [DOI] [PubMed] [Google Scholar]
- 33.Kageyama T, Kojima S, Shinohara M, Uchida K, Fukushi S, Hoshino FB, Takeda N, Katayama K. 2003. Broadly reactive and highly sensitive assay for Norwalk-like viruses based on real-time quantitative reverse transcription-PCR. J Clin Microbiol 41:1548–1557. doi: 10.1128/JCM.41.4.1548-1557.2003. [DOI] [PMC free article] [PubMed] [Google Scholar]
- 34.DePaola A, Jones JL, Woods J, Burkhardt W III, Calci KR, Krantz JA, Bowers JC, Kasturi K, Byars RH, Jacobs E, Williams-Hill D, Nabe K. 2010. Bacterial and viral pathogens in live oysters: 2007 United States market survey. Appl Environ Microbiol 76:2754–2768. doi: 10.1128/AEM.02590-09. [DOI] [PMC free article] [PubMed] [Google Scholar]
- 35.Simard C, Houde A, Trottier Y-L. 2007. Concentration of hepatitis A virus and rotavirus in spring or mineral bottled water samples and their detection by the reverse-transcriptase polymerase chain reaction (OPFLP-04). In The compendium of analytical methods, vol 5 Health Canada, Ottawa, Ontario, Canada. [Google Scholar]
- 36.Houde A, Leblanc D, Poitras E, Ward P, Brassard J, Trottier Y-L, Mueller P, Simard C. 2010. Detection of norovirus genogroups I and II using the conventional and real-time reverse-transcriptase polymerase chain reaction (OPFLP-10). In The compendium of analytical methods, vol 5 Health Canada, Ottawa, Ontario, Canada. [Google Scholar]
- 37.Vega E, Barclay L, Gregoricus N, Williams K, Lee D, Vinje J. 2011. Novel surveillance network for norovirus gastroenteritis outbreaks, United States. Emerg Infect Dis 17:1389–1395. [DOI] [PMC free article] [PubMed] [Google Scholar]
- 38.Mattison K, Plante M, Bidawid S, Bin Kingombe C, Houde A, Ward P. 2010. Detection of feline caliciviruses using the conventional and real-time reverse-transcriptase polymerase chain reaction (OPFLP-06). In The compendium of analytical methods, vol 5 Health Canada, Ottawa, Ontario, Canada. [Google Scholar]
- 39.Kojima S, Kageyama T, Fukushi S, Hoshino FB, Shinohara M, Uchida K, Natori K, Takeda N, Katayama K. 2002. Genogroup-specific PCR primers for detection of Norwalk-like viruses. J Virol Methods 100:107–114. doi: 10.1016/S0166-0934(01)00404-9. [DOI] [PubMed] [Google Scholar]
- 40.Turnbull B. 1974. Nonparametric estimation of a survivorship function with doubly censored data. J Am Stat Assoc 69:169–173. doi: 10.1080/01621459.1974.10480146. [DOI] [Google Scholar]
- 41.R Development Core Team. 2008. R: a language and environment for statistical computing. R Foundation for Statistical Computing, Vienna, Austria. [Google Scholar]
- 42.Therneau TM, Grambsch PM. 2000. Modeling survival data: extending the Cox model. Springer, New York, NY. [Google Scholar]
- 43.Gilks WR, Richardson S, Spiegelhalter D. 1996. Markov chain Monte Carlo in practice. Chapman & Hall/CRC, London, United Kingdom. [Google Scholar]
- 44.Whitaker J. 1990. Graphical models in applied multivariate analysis. John Wiley & Sons, Ltd, Chichester, United Kingdom. [Google Scholar]
- 45.Thomas A, O'Hara B, Ligges U, Sturtz S. 2006. Making BUGS open. R News 6:12–17. [Google Scholar]
- 46.Plummer M, Best N, Cowles K, Vines K. 2006. CODA: convergence diagnosis and output analysis for MCMC. R News 6:7–11. [Google Scholar]
- 47.Albert I, Grenier E, Denis JB, Rousseau J. 2008. Quantitative risk assessment from farm to fork and beyond: a global Bayesian approach concerning food-borne diseases. Risk Anal 28:557–571. doi: 10.1111/j.1539-6924.2008.01000.x. [DOI] [PubMed] [Google Scholar]
- 48.Gelman A, Rubin D. 1992. Inference from iterative simulation using multiple sequences. Stat Sci 7:457–511. doi: 10.1214/ss/1177011136. [DOI] [Google Scholar]
- 49.Haramoto E, Katayama H, Oguma K, Yamashita H, Tajima A, Nakajima H, Ohgaki S. 2006. Seasonal profiles of human noroviruses and indicator bacteria in a wastewater treatment plant in Tokyo, Japan. Water Sci Technol 54:301–308. doi: 10.2166/wst.2006.888. [DOI] [PubMed] [Google Scholar]
- 50.Francy DS, Stelzer EA, Bushon RN, Brady AM, Williston AG, Riddell KR, Borchardt MA, Spencer SK, Gellner TM. 2012. Comparative effectiveness of membrane bioreactors, conventional secondary treatment, and chlorine and UV disinfection to remove microorganisms from municipal wastewaters. Water Res 46:4164–4178. doi: 10.1016/j.watres.2012.04.044. [DOI] [PubMed] [Google Scholar]
- 51.Fumian TM, Vieira CB, Leite JP, Miagostovich MP. 2013. Assessment of burden of virus agents in an urban sewage treatment plant in Rio de Janeiro, Brazil. J Water Health 11:110–119. doi: 10.2166/wh.2012.123. [DOI] [PubMed] [Google Scholar]
- 52.Nordgren J, Matussek A, Mattsson A, Svensson L, Lindgren P-E. 2009. Prevalence of norovirus and factors influencing virus concentrations during one year in a full-scale wastewater treatment plant. Water Res 43:1117–1125. doi: 10.1016/j.watres.2008.11.053. [DOI] [PubMed] [Google Scholar]
- 53.Sima LC, Schaeffer J, Le Saux JC, Parnaudeau S, Elimelech M, Le Guyader FS. 2011. Calicivirus removal in a membrane bioreactor wastewater treatment plant. Appl Environ Microbiol 77:5170–5177. doi: 10.1128/AEM.00583-11. [DOI] [PMC free article] [PubMed] [Google Scholar]
- 54.Tian P, Yang D, Pan L, Mandrell R. 2012. Application of a receptor-binding capture quantitative reverse transcription-PCR assay to concentrate human norovirus from sewage and to study the distribution and stability of the virus. Appl Environ Microbiol 78:429–436. doi: 10.1128/AEM.06875-11. [DOI] [PMC free article] [PubMed] [Google Scholar]
- 55.Victoria M, Guimaraes FR, Fumian TM, Ferreira FF, Vieira CB, Shubo T, Leite JP, Miagostovich MP. 2010. One year monitoring of norovirus in a sewage treatment plant in Rio de Janeiro, Brazil. J Water Health 8:158–165. doi: 10.2166/wh.2009.012. [DOI] [PubMed] [Google Scholar]
- 56.Rajko-Nenow P, Waters A, Keaveney S, Flannery J, Tuite G, Coughlan S, O'Flaherty V, Dore W. 2013. Norovirus genotypes present in oysters and in effluent from a wastewater treatment plant during the seasonal peak of infections in Ireland in 2010. Appl Environ Microbiol 79:2578–2587. doi: 10.1128/AEM.03557-12. [DOI] [PMC free article] [PubMed] [Google Scholar]
- 57.Kitajima M, Haramoto E, Phanuwan C, Katayama H, Ohgaki S. 2009. Detection of genogroup IV norovirus in wastewater and river water in Japan. Lett Appl Microbiol 49:655–658. doi: 10.1111/j.1472-765X.2009.02718.x. [DOI] [PubMed] [Google Scholar]
- 58.van den Berg H, Lodder W, van der Poel W, Vennema H, de Roda Husman AM. 2005. Genetic diversity of noroviruses in raw and treated sewage water. Res Microbiol 156:532–540. doi: 10.1016/j.resmic.2005.01.008. [DOI] [PubMed] [Google Scholar]
- 59.La Rosa G, Iaconelli M, Pourshaban M, Muscillo M. 2010. Detection and molecular characterization of noroviruses from five sewage treatment plants in central Italy. Water Res 44:1777–1784. doi: 10.1016/j.watres.2009.11.055. [DOI] [PubMed] [Google Scholar]
- 60.Pusch D, Oh DY, Wolf S, Dumke R, Schroter-Bobsin U, Hohne M, Roske I, Schreier E. 2005. Detection of enteric viruses and bacterial indicators in German environmental waters. Arch Virol 150:929–947. doi: 10.1007/s00705-004-0467-8. [DOI] [PubMed] [Google Scholar]
- 61.Simmons FJ, Xagoraraki I. 2011. Release of infectious human enteric viruses by full-scale wastewater utilities. Water Res 45:3590–3598. doi: 10.1016/j.watres.2011.04.001. [DOI] [PubMed] [Google Scholar]
- 62.Helsel DR. 2006. Fabricating data: how substituting values for nondetects can ruin results, and what can be done about it. Chemosphere 65:2434–2439. doi: 10.1016/j.chemosphere.2006.04.051. [DOI] [PubMed] [Google Scholar]
- 63.Nauta MJ. 2010. “Campylobacter transfer from naturally contaminated chicken thighs to cutting boards is inversely related to initial load,” a comment on: J Food Prot 72:1836–1840 (2009). J Food Prot 73:6–7. (Author reply, 73: 7–8.) [DOI] [PubMed] [Google Scholar]
- 64.Iwai M, Hasegawa S, Obara M, Nakamura K, Horimoto E, Takizawa T, Kurata T, Sogen S, Shiraki K. 2009. Continuous presence of noroviruses and sapoviruses in raw sewage reflects infections among inhabitants of Toyama, Japan (2006 to 2008). Appl Environ Microbiol 75:1264–1270. doi: 10.1128/AEM.01166-08. [DOI] [PMC free article] [PubMed] [Google Scholar]
- 65.Lodder WJ, de Roda Husman AM. 2005. Presence of noroviruses and other enteric viruses in sewage and surface waters in The Netherlands. Appl Environ Microbiol 71:1453–1461. doi: 10.1128/AEM.71.3.1453-1461.2005. [DOI] [PMC free article] [PubMed] [Google Scholar]
- 66.Prado T, Silva DM, Guilayn WC, Rose TL, Gaspar AM, Miagostovich MP. 2011. Quantification and molecular characterization of enteric viruses detected in effluents from two hospital wastewater treatment plants. Water Res 45:1287–1297. doi: 10.1016/j.watres.2010.10.012. [DOI] [PubMed] [Google Scholar]
- 67.Mounts AW, Ando T, Koopmans M, Bresee JS, Noel J, Glass RI. 2000. Cold weather seasonality of gastroenteritis associated with Norwalk-like viruses. J Infect Dis 181(Suppl 2):S284–S287. doi: 10.1086/315586. [DOI] [PubMed] [Google Scholar]
- 68.Laverick MA, Wyn-Jones AP, Carter MJ. 2004. Quantitative RT-PCR for the enumeration of noroviruses (Norwalk-like viruses) in water and sewage. Lett Appl Microbiol 39:127–136. doi: 10.1111/j.1472-765X.2004.01534.x. [DOI] [PubMed] [Google Scholar]
- 69.Dancho BA, Chen H, Kingsley DH. 2012. Discrimination between infectious and non-infectious human norovirus using porcine gastric mucin. Int J Food Microbiol 155:222–226. doi: 10.1016/j.ijfoodmicro.2012.02.010. [DOI] [PubMed] [Google Scholar]