

Abstract
Dynamic anaerobic-aerobic feast-famine conditions are applied to wastewater treatment plants to select polyphosphate-accumulating organisms to carry out enhanced biological phosphorus removal. Acetate is a well-known substrate to stimulate this process, and here we show that different amino acids also are suitable substrates, with glycine as the most promising. 13C-labeled glycine and nuclear magnetic resonance (NMR) were applied to investigate uptake and potential storage products when activated sludge was fed with glycine under anaerobic conditions. Glycine was consumed by the biomass, and the majority was stored intracellularly as free glycine and fermentation products. Subsequently, in the aerobic phase without addition of external substrate, the stored glycine was consumed. The uptake of glycine and oxidation of intracellular metabolites took place along with a release and uptake of orthophosphate, respectively. Fluorescence in situ hybridization combined with microautoradiography using 3H-labeled glycine revealed uncultured actinobacterial Tetrasphaera as a dominant glycine consumer. Experiments with Tetrasphaera elongata as representative of uncultured Tetrasphaera showed that under anaerobic conditions it was able to take up labeled glycine and accumulate this and other labeled metabolites to an intracellular concentration of approximately 4 mM. All components were consumed under subsequent aerobic conditions. Intracellular accumulation of amino acids seems to be a novel storage strategy for polyphosphate-accumulating bacteria under dynamic anaerobic-aerobic feast-famine conditions.
INTRODUCTION
The wastewater treatment process known as enhanced biological phosphorus removal (EBPR) is a widely employed process in wastewater treatment for removal of phosphorus (P). The principle is to create favorable conditions for the enrichment of microorganisms capable of excess uptake and storage of orthophosphate (Pi) as polyphosphate [poly(P)], based on alternating anaerobic and aerobic periods (1). Early metabolic models detailed that in the anaerobic phase, polyphosphate-accumulating organisms (PAOs) take up volatile fatty acids (e.g., acetate and propionate), using polyphosphate as an energy source. These substrates are reduced and stored as intracellular polyhydroxyalkanoates (PHA) with energy obtained from hydrolysis of intracellular polyphosphate and energy and reducing power from glycolysis of intracellular glycogen (2), the tricarboxylic acid (TCA) cycle (3), or both (4). In the subsequent aerobic or denitrifying phase, the PAOs use PHA for growth and for replenishing their polyphosphate and glycogen reserves (5). As the quantity of phosphate removed during the aerobic stage is greater than that released during the initial anaerobic stage, a net removal of phosphate from the wastewater is achieved.
While PAOs share the metabolic ability for accumulation of polyphosphate as an energy storage compound, they are phylogenetically diverse (6–9). Rhodocyclus-related bacteria (“Candidatus Accumulibacter”), belonging to the Betaproteobacteria, are identified as important PAOs, with a typical abundance of 5% of the bacterial community in some full-scale plants (10). Other bacteria, “Candidatus Halomonas phosphatis” (“Ca. Halomonas” PAO) have also been claimed to be PAOs and have been found in full-scale EBPR plants (at 3% abundance on average) (9). Both types of PAOs behave as predicted by the biochemical models described above (9, 11). However, the actinobacterial genus Tetrasphaera contains putative PAOs in high abundances in many full-scale EBPR plants, where they account for up to 30% of the total bacterial biovolume (7, 8, 10) and may thus be more important than “Ca. Accumulibacter” and “Ca. Halomonas” PAO in many full-scale plants.
In situ ecophysiological studies have shown that Tetrasphaera can assimilate a range of substrates under anaerobic conditions (primarily glucose and some amino acids) and subsequently can use the energy stored for taking up Pi aerobically and store it intracellularly as poly(P) (7, 8). Recently, Kristiansen et al. (12) proposed a metabolic model for Tetrasphaera PAOs. Based on the model, Tetrasphaera-related PAOs take up glucose anaerobically and ferment this to succinate and other components. They do not produce PHA but can synthesize glycogen as a storage polymer, using energy generated from substrate fermentation and degradation of stored poly(P). During the aerobic phase, the stored glycogen is catabolized to provide energy for growth and to replenish the intracellular poly(P) reserves needed for subsequent anaerobic metabolism. This physiology is markedly different from that displayed by the PAO model organism “Ca. Accumulibacter,” which consumes acetate, indicating metabolic variation and thus expanding the definition of the phenotype.
Tetrasphaera is the dominant PAO that consumes amino acids under anaerobic conditions with a subsequent uptake of Pi under oxic conditions (7, 8). Protein is a main component of typical wastewater (25 to 35% of the organic material [13]), and amino acids seem to be an important substrate for many bacterial species, including Tetrasphaera in activated-sludge plants sustaining EBPR (7, 8, 13), while the combination of acetate and propionate constitutes the most important substrate for “Ca. Accumulibacter” (4, 15–17). However, all metabolic models for EBPR have been developed on acetate and glucose (11, 12) and do not cover the use of amino acids. A typical Pi release and uptake pattern from EBPR plants has been observed upon addition of certain amino acids under dynamic anaerobic-aerobic conditions (7, 8), but the storage product(s) and metabolic pathways remain unknown.
In this study, the aim was to confirm that uncultured Tetrasphaera from full-scale EBPR wastewater treatment plants (WWTPs) could take up amino acids under anaerobic conditions along with P release and to identify potential storage products and key metabolites in the Tetrasphaera-containing biomass and pure cultures of Tetrasphaera elongata. The amino acid glycine induced the highest P release activity in activated sludge and is not used by “Ca. Accumulibacter” (39) or “Ca. Halomonas” PAO (9), so glycine was used as a model compound. The two types of biomass were subjected to dynamic anaerobic-aerobic conditions in the presence of 13C-labeled glycine, and the intra- and extracellular metabolites were investigated by nuclear magnetic resonance (NMR).
MATERIALS AND METHODS
Activated-sludge batch experiments for P release test with 20 different amino acids.
Activated-sludge samples were collected from the Aalborg West full-scale WWTP, a well-working and stable EBPR plant with nitrogen removal (nitrification and denitrification). Aalborg West has a BioDenipho configuration that includes an anaerobic tank before tanks with alternating anoxic-aerobic operation (18). For studies with Pi release upon addition of amino acid, fresh activated sludge from Aalborg West was preaerated for approximately 40 min, kept close to the in situ temperature (15°C), and stirred (∼250 rpm). The activated sludge was switched to an anaerobic condition by purging N2 gas for 15 min, and different amino acids were added, each in an amount of 300 mg chemical oxygen demand (COD)/liter. Release of orthophosphate was measured every 30 min, and the total amount of P released after 8 h was measured. All experiments were performed in duplicate.
Activated-sludge batch experiments with glycine uptake.
Fresh samples from the aeration tank of Aalborg West were stored at 4°C for <24 h before the experiments were carried out. The samples were diluted with filtered nitrate and nitrite-free effluent to a final concentration of 1 g biomass (suspended solids) per liter. Activated sludge was first incubated aerobically for 1 h in filtered effluent to exhaust any storage polymers before experiments were initiated. [13C]glycine was added (1 mM final concentration) and incubated anaerobically for 3 h. Biomass was then harvested and washed under anaerobic conditions with filtered effluent supplemented with 0.5 mM phosphate before being incubated under aerobic conditions. No exogenous carbon source was added. Both supernatant and biomass were sampled for later assessment of substrate consumption, intracellular metabolite analysis, and P uptake/release measurements. All experiments were performed in duplicates at room temperature (approximately 22°C). The average value from the two experiments is shown. The standard deviation was always below 9%. Three types of control experiments were carried out: 3 h of anaerobic incubation without a carbon source, 3 h of anaerobic incubation with pasteurized biomass (10 min at 80°C) with 1.5 mM [13C]glycine, and 3 h of aerobic incubation with 1.5 mM [13C]glycine. All control experiments were performed at room temperature, with biomass and supernatant samples taken at the start (0 h) and end (3 h) of each experiment.
Pure culture batch experiments.
Tetrasphaera elongata strain Lp2 (19) isolated from activated sludge was used. T. elongata was cultured in Erlenmeyer flasks in an orbital incubator at 22°C in R2A broth (20) (which includes glucose and 0.5 g/liter yeast extract, 0.5 g/liter meat peptone, 0.5 g/liter Casamino Acids, 0.3 g/liter dipotassium hydrogen phosphate, and 0.05 g/liter magnesium) without starch and sodium pyruvate to generate enough biomass for biochemical studies. When an adequate amount was produced (typically after 7 days), cells were harvested by centrifugation. For biochemical studies, prepared biomass was incubated anaerobically with the chemically defined MSV medium (21) containing 1 mM [13C]glycine as only carbon source and then harvested and washed after 3 h with MSV medium under anaerobic conditions before being incubated under aerobic conditions for an additional 3 h in MSV with 0.5 mM phosphate. No exogenous carbon source was added. Samples were taken for phosphate release/uptake measurements, carbon source consumption measurements, and intracellular metabolite analysis. All experiments were performed in duplicate at room temperature (approximately 22°C). A 3-h anaerobic incubation of T. elongata without a carbon source was used as a control. Both supernatant and biomass were taken at the start (0 h) and end (3 h) of each experiment for NMR analysis. All T. elongata control experiments were performed at room temperature.
Microscopy, FISH, MAR, DAPI, cell volumes and, cell dry biomass.
Fluorescence in situ hybridization (FISH) was performed as detailed previously (22). The oligonucleotide EUBmix probes (equimolar concentrations of EUB338, EUB338II, and EUB338III), targeting most bacteria (23, 24), were labeled with FLUOS [5(6)-carboxyfluorescein-N-hydroxy-succinimide ester], whereas 4 probes (Tet1-266, Tet2-892, Tet2-174, and Tet3-654) targeting 3 Tetrasphaera clades (8) and PAOmix (equimolar concentrations of PAO462, PAO651, and PAO846), targeting most “Ca. Accumulibacter” strains (25), were labeled with the sulfoindocyanine dye Cy3. Twenty separate microscopy images were taken for quantitative FISH analysis, with the final results reflecting the mean percentages of Tetrasphaera-related PAOs of the entire bacterial community detected by EUBmix (22).
The microautoradiography (MAR)-FISH method was described in detail by Nguyen et al. (8). Briefly, activated sludge was incubated in 9-ml serum bottles for 3 h with labeled and unlabeled glycine under anaerobic conditions. The anaerobic preparation was carefully flushed with O2-free N2 prior to the addition of tracer. Following incubation, the samples were fixed by addition of freshly prepared paraformaldehyde in phosphate-buffered saline (PBS) to a final concentration of 4% and allowed to stand for 3 h at 4°C, and then the biomass was washed in distilled water. Prior to FISH, the samples were gently homogenized by rubbing a 40-μl sample between two gelatin-coated cover glasses (24 by 60 mm). FISH probing of MAR-incubated biomass, coating with emulsion, exposure, and development of the hybridized FISH slides prior to examination by microscopy were carried out as described elsewhere (26).
For cell number and biomass determination, T. elongata was grown in Erlenmeyer flasks in an orbital incubator at 22°C in R2A broth without starch and sodium pyruvate for 7 days. Every day, 2 ml of the culture was fixed in a final concentration of 2% (wt/vol) formaldehyde for cell number determination. The fixed sample was homogenized, stained for 10 min with 5 μg/ml of DAPI (4′,6′-diamidino-2-phenylindole), and filtered through a 0.2-μm black polycarbonate filter, and the stained cells were counted using an epifluorescence microscope (100× objective). At 10 different fields of view on the filter, the number of cells was counted and reported with calculated mean values. The suspended solids were also determined by filtering an aliquot through a 0.2-μm cellulose ester membrane filter that was dried overnight at 60°C (27). The cell volume was determined using epifluorescence microscopy for measuring the length and width of the bacteria and calculated, considering the T. elongata cells to be straight-sided rods with hemispherical ends (28), as v = (π/4)d2(l − d/3), where v is bacterial volume, l is length, and d is diameter. Cell dimensions and volumes are given in Table 1.
TABLE 1.
Key parameters and stoichiometries for T. elongata and activated sludge
| Parameter | Valuea |
|---|---|
| T. elongata | |
| Cell no./g biomass | 5.6 × 10¹² |
| Cell size (width × length, μm), vol (μm3) | 1 × 4; 2.88 |
| Cell vol (μl)/mg biomass | 16.1 |
| Intracellular concn of glycine (mM) | 3.9b |
| Intracellular amt of glycine (mg/g biomass) | 4.7b |
| Pi release/glycine uptake ratio (mol P/mol C) | 0.48 |
| Activated sludge | |
| Cells no./g biomass | 5 × 10¹² |
| Intracellular concn of glycine (mM) | 2.9b,c |
| Intracellular amt of glycine (mg/g biomass) | 3.5b,c |
| Pi release/glycine uptake ratio (mol P/mol C) | 0.47 |
All values are averages from duplicate experiments.
The intracellular concentration of glycine was calculated after 3 h or anaerobic incubation.
Assuming that only Tetrasphaera accumulated glycine.
Chemical analyses.
(i) Determination of carbon source consumption and extracellular/intracellular metabolites.
In total, 10 ml of cell culture containing biomass was centrifuged for 5 min at 4,500 × g. The supernatant was filtered through a Millipore Millex-HV 0.45-μm polyvinylidene difluoride (PVDF) filter to another test tube and put on ice. The pellet was washed three times with 5 ml of ice-cold PBS. Both supernatant and pellet were flash-frozen in liquid nitrogen and lyophilized. The metabolites were extracted in a way similar to that described by Wu and Wang (29). Briefly, freeze-dried cells were resuspended in 1 ml of cold methanol (−20°C) and vortexed for 1 min. One milliliter of cold chloroform (−20°C) was added, followed by addition of 0.9 ml of cold H2O containing 10 mM fumarate (pH 7) (as an internal standard), with 1 min of vortexing after each addition. The cell lysate was centrifuged at 10,000 rpm for 10 min at 4°C. Besides the polar and the organic phases, there was an insoluble phase at the interface. After careful withdrawal of the water and the organic phases, the insoluble phase was extracted twice again with the same amounts of methanol, chloroform, and water but without addition of fumarate. Pooled aqueous extracts were lyophilized and resuspended in 0.6 ml of 4.8 mM sodium 2,2,3,3-tetradeutero-3-(trimethylsilyl) propionate (Sigma-Aldrich) (TSP-d4) in D2O (Sigma-Aldrich) at pH 7. Pooled organic extracts were vacuum dried and resuspended in 0.6 ml of chloroform-d with 0.05% trimethylsilane (TMS). The remaining insoluble phase was hydrolyzed with 0.9 M HCl at 100°C for 6 h and filtered through 0.22-μm PVDF syringe filter. The hydrolyzed extracts were lyophilized and resuspended in 0.6 ml of 4.8 mM TSP in D2O (Sigma-Aldrich) at pH 7.
NMR spectra were acquired with a Bruker AVIII-600 spectrometer equipped with a 5-mm TCI (H/C/N) probe, operating at 600.13 MHz for 1H and 150.9 MHz for 13C. Intracellular metabolites were identified by acquiring heteronuclear single quantum coherence (HSQC) and two-dimensional (2D) HSQC-total correlation spectroscopy (TOCSY) spectra and comparing the observed shifts against reference profiles in the Human Metabolome Database (30) and Bruker's BBIOREFCODE spectral database. The ChenomX NMR Suite 7.6 was used to quantify the labeled and unlabeled intracellular metabolite products and carbon source consumption from 1H-1D NMR.
In order to quantify metabolite concentrations from 2D HSQC, a standard curve was measured with known concentrations of all the metabolites to be quantified.
(ii) Orthophosphate.
Supernatant samples were filtered through a 0.45-mm cellulose acetate filter, stored in 0.04 M H2SO4 at 4°C, and analyzed spectrophotometrically according to the ascorbic acid standard method 4500-P E (27, 31).
RESULTS
The anaerobic Pi release from 20 different amino acids was investigated on fresh biomass (activated sludge) from the Aalborg West full-scale EBPR plant. Eleven of the amino acids induced release of Pi (Fig. 1A). Glycine showed the highest release, although the Pi release was lower than that caused by acetate (1.14 mmol P/g volatile suspended solids) (data not shown). Quantitative FISH analyses showed the presence of two PAOs with 3 clades of Tetrasphaera as the most abundant (in total, approximately 27% of the biomass), whereas “Ca. Accumulibacter” constituted approximately 4% of the biomass (data not shown). MAR-FISH analyses showed that [3H]glycine was consumed by most probe-defined Tetrasphaera (Fig. 1B) but not by any “Ca. Accumulibacter” (data not shown).
FIG 1.

(A) Anaerobic Pi release after addition of different amino acids to activated sludge from Aalborg West. The average concentrations from duplicate experiments are shown. The horizontal line shows the release in the control without addition of any substrates. (B) FISH-MAR image of anaerobic uptake of [3H]glycine by Tetrasphaera. (B) Panel I, FISH image showing bacteria hybridizing with the bacterial probes EUBmix (green) and Tetrasphaera probe Tet3-654 (red) targeting clade 3. Yellow microcolonies and cells are an overlay of red and green. Panel II, bright-field microautoradiography image shows dark silver grains on top of cells, indicating that they took up [3H]glycine. Other cells, probably other Tetrasphaera species, also took up labeled glycine.
NMR analysis and optimization.
The glycine uptake of activated sludge and pure culture T. elongata and the production of intracellular and extracellular metabolites during an anaerobic-aerobic cycle were investigated in greater detail by 13C NMR analysis. Supernatant as well as biomass was sampled for assessment of substrate consumption and metabolite production.
(i) Absolute quantification of sampled biomass.
The reliable calculation of intracellular metabolite concentrations from the concentrations detected in sampled and extracted biomass requires the precise knowledge of all losses during the sampling and extraction process. These losses were found to vary significantly between samples. We found that the addition of an internal standard both to the final sample (TSP-d4) and to the aqueous solution used for extraction (fumarate) allows for a quantitative assessment of the sampled biomass and the losses during extraction and sample preparation. This procedure is described in detail in the supplemental material. Briefly, we established a standard curve for calculating the total amount of biomass in the final sample from the total integral of NMR signals of the cellular metabolome between 0.45 and 4.5 ppm. The plot of the corrected NMR integral of the region from 0.45 to 4.5 ppm versus the initial amount of biomass displayed excellent linearity (see Fig. S1 in the supplemental material) and was used to correct metabolite quantities in all samples for losses that occurred.
(ii) Metabolite quantification from 2D HSQC spectra.
Although 1D 1H NMR is a reliable method for quantification of compounds in mixtures, severe overlap of the resonances creates a serious limitation, hindering the unambiguous identification and quantification of metabolites, especially those occurring at low concentrations. 2D NMR spectra offer the advantage of increased spectral resolution, thus reducing signal overlap. However, quantitative analysis of 2D NMR spectra is not straightforward, as parameters different from metabolite concentration (transfer efficiency in mixing steps and relaxation) can dominate the NMR signal intensity in 2D spectra. Quantitative versions of the HSQC spectra have been described in the literature (32, 33), but they appear at the expense of reduced sensitivity. In this study, 2D NMR experiments were used in combination with 1D measurements, where the quantification of metabolites that were assigned based on 2D results was performed on 1D spectral data wherever possible. Resonances that could not be quantified reliably from 1D NMR spectra were quantified from 2D HSQC NMR spectra. In order to provide reliable quantification from 2D HSQC spectra, we recorded reference spectra with the exact same spectral parameters and a mixture of the compounds to be quantified in known concentrations.
A selection of 1H NMR spectra acquired from cell extracts from activated sludge at different time points during a full anaerobic-aerobic cycle with labeled glycine is shown in Fig. 2. Concentrations of intracellular glycine increased over time during the anaerobic phase (0 to 180 min), with the highest increase in the beginning. Then, under aerobic conditions, intracellular 13C-labeled glycine was gradually consumed over 3 h.
FIG 2.
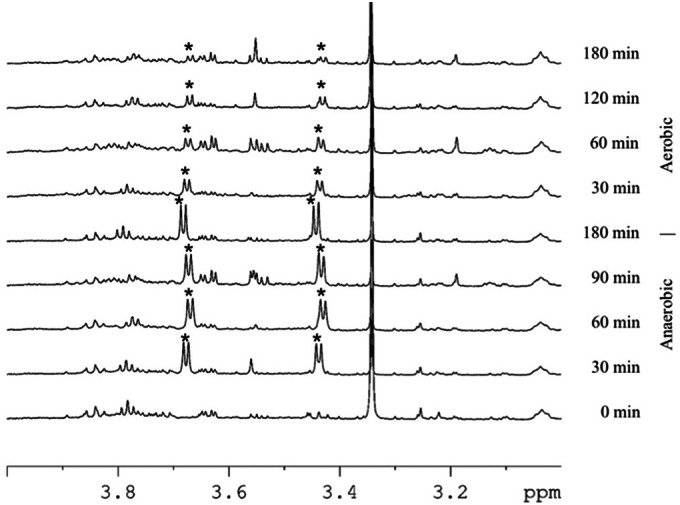
1H NMR spectra of cell extracts from activated sludge at different time points during a full anaerobic-aerobic cycle with [13C]glycine. The glycine peaks are marked with an asterisk. Glycine Hα signal splitting is caused by 1JHαCα and 2JHαC.
Storage products of activated sludge under dynamic anaerobic-aerobic conditions.
Fresh activated sludge from Aalborg West was investigated to determine the fate of the 13C-labeled glycine taken up under anaerobic conditions by searching for labeled PHA, glycogen, other macromolecules, and other intracellular metabolites.
Fresh activated sludge did not contain detectable unlabeled intracellular glycine. When 13C-labeled glycine was added to activated sludge under anaerobic conditions, it was consumed, accompanied by Pi release to the bulk liquid. Most glycine was consumed in the first hour, and after 3 h, the uptake had almost stopped. The uptake was 0.45 ± 0.01 mmol glycine per g suspended solids (n = 4) (Fig. 3A), and the ratio of Pi release to glycine uptake was 0.47 ± 0.01 mol/mol (n = 4). No intracellular PHA was found. Instead, the uptake was accompanied by accumulation of intracellular glycine (Fig. 3B) and small amounts of labeled glutamine, serine, and alanine. During the subsequent aerobic phase, Pi was taken up, and the labeled intracellular glycine, glutamine, serine, and alanine were gradually consumed over several hours.
FIG 3.

Change in concentration of metabolites in bulk medium and biomass in activated sludge with 13C-labeled glycine as the sole carbon source under dynamic anaerobic-aerobic conditions. (A) The average concentrations and standard deviation from duplicate experiments are shown for Pi and glycine medium. The concentration of biomass (activated sludge) was 1 g SS/liter. (B) Calculated intracellular concentration of metabolites in Tetrasphaera, assuming that all 13C-labeled glycine was stored in these species. Labeled intracellular glutamine, serine, and alanine were detected but in very low concentrations (not shown).
Assuming that glycine was taken up only by Tetrasphaera, the intracellular glycine concentration was calculated. The calculation was based on enumeration of the total number of bacteria by DAPI count, the fraction of 3 clades of Tetrasphaera, and their average cell volume (Table 1), and the concentrations are shown in Fig. 3B. At the beginning of the anaerobic period before glycine addition, no intracellular glycine was detected. After addition, the intracellular concentration rose quickly within 30 min to 2 mM; thereafter it increased slowly to approximately 3 mM by the end of the 3-h anaerobic period. Intracellular glycine amounted to 11 to 15% of the consumed glycine (Table 2). Only low intracellular concentrations of 13C-labeled glutamine, serine, and alanine were detected (<1% of the glycine consumed).
TABLE 2.
Mass balance of 13C-labeled carbon taken up and 13C-labeled intracellular metabolites produced in activated sludge fed with glycine (100% of [13C]glycine consumed)
| Metabolite(s) | % of substrate taken up |
||
|---|---|---|---|
| Anaerobic culture |
Aerobic culture, 3 h | ||
| 5 min | 3 h | ||
| Soluble compounds | |||
| Intracellular glycine | 15.0 | 11.0 | <1.0 |
| Intracellular glutamine, serine, and alanine | <1.0 | <1.0 | <1.0 |
| Bound to macromolecules | |||
| Glycine | 18.0 | 4.0 | <1.0 |
| Serine | 2.0 | 1.0 | <1.0 |
| Glutamine | 1.0 | 1.0 | <1.0 |
| Alanine | 1.0 | 1.0 | <1.0 |
| Medium | |||
| Glyoxylate | 14.0 | 2.0 | 0.0 |
| Serine | 14.0 | 1.0 | 0.0 |
| Alanine | 4.0 | 1.0 | 0.0 |
| Acetate | 3.0 | 1.0 | 0.0 |
| Sugar | NQa | NQ | 0.0 |
| CO2 | NQ | NQ | NQ |
| Total | >73 | >24 | |
NQ, not quantifiable.
Fresh activated sludge contained unlabeled intracellular glutamate, and if we as a rough estimate assume it was present only inside Tetrasphaera and not in other species, it corresponded to an intracellular concentration of 3.1 mM. Interestingly, unlabeled glutamate increased to 27 mM after 3 h of anaerobic incubation with labeled glycine. It was not possible to detect the source for the glutamate production. No unlabeled intracellular glycine was detected.
Some 13C-labeled glycine was also found incorporated into bacterial macromolecules, likely protein (4 to 18% of total glycine consumed). Small amounts of 13C-labeled glutamate, serine, and alanine (1 to 2% of total glycine consumed) were also seen in the bacterial macromolecules. In addition, very small amounts of labeled carbohydrates were found; however, this could not be quantified or identified more precisely.
Secretion of 13C-labeled serine, alanine, acetate, and glyoxylate to the bulk medium during anaerobic incubation was detected, especially in the first few minutes, and bulk concentrations of 2.0 μM, 3.4 μM, 6.0 μM and 9.4 μM, respectively, were observed. No glutamine was observed in the bulk medium. When a mass balance was calculated based on the 13C-labeled glycine consumed after 5 min of incubation, the extracellular glyoxylate and serine corresponded to 14%, and alanine and acetate to 3 to 4%, of the glycine consumed (all as moles 13C). All excreted products were consumed by the biomass, and after the 3-h anaerobic period, the bulk concentrations of serine, glyoxylate, alanine, and acetate (all as moles 13C) dropped to 1 to 2% of the exogenous glycine consumed (Table 2).
During the subsequent aerobic phase, intracellular glycine, glutamine, and alanine were slowly consumed over time (Fig. 3). No detectable accumulation of other 13C-labeled metabolites (intracellular or extracellular) was observed under the subsequent aerobic conditions.
In order to assess whether glycine could be adsorbed by the extracellular matrix and then mistakenly considered intracellular during the extraction procedure, a control experiment was conducted. Glycine was added to activated sludge at 1.5 mM under aerobic conditions, and it was reduced to approximately 0.95 mM after 3 h. No intracellular glycine could be detected (data not shown) despite the presence of extracellular glycine, showing that no adsorption of glycine took place. Likewise, no 13C-labeled glycine was found in the biomass fraction of sludge samples that had been pasteurized prior to incubation with glycine.
Glycine accumulation by T. elongata.
T. elongata is difficult to grow, and we were successful in growing it only in R2A medium, so due to the complexity of this medium, all experiments were performed in mineral medium (MSV) after washing of the biomass. 13C-labeled glycine was supplied anaerobically to T. elongata to investigate intracellular and extracellular metabolites produced during an anaerobic-aerobic cycle.
Figure 4A shows that T. elongata demonstrated a typical PAO phenotype, with the consumption of organics (glycine) and release of Pi during the anaerobic phase and reassimilation of Pi under subsequent aerobic conditions. This is known to be accumulated as poly(P) (12). The ratio between glycine taken up and released Pi was 0.48 mol/mol. After 3 h under aerobic conditions, the Pi uptake was approximately 0.21 mM. T. elongata consumed 13C-labeled glycine under anaerobic conditions and excreted succinate, alanine, and acetate along with Pi to the medium. No intracellular PHA was detected, but a significant accumulation of labeled glycine, glutamine, alanine, and serine was observed (Table 3). After 3 h of anaerobic incubation, intracellular glycine amounted to 9% of the glycine consumed (Table 3). Only low intracellular concentrations of 13C-labeled glutamine, serine, and alanine were detected (165 μM, 54 μM, and 21 μM, respectively), corresponding to less than 1% of the glycine consumed.
FIG 4.

(A) Ability of T. elongata to release Pi and consume 13C-labeled glycine in the anaerobic phase (0 to 3 h), to take up Pi in the aerobic phase (3.25 to 6.25 h), and to accumulate and consume glycine in the anaerobic and aerobic phases, respectively. The average concentrations and standard deviations from duplicate experiments are shown. The concentration of biomass was 0.3 g/liter. (B) Calculated intracellular concentrations of metabolites in T. elongata. Labeled intracellular glutamine, serine, and alanine were detected but in very low concentrations (not shown).
TABLE 3.
Mass balance of 13C-labeled carbon taken up and 13C-labeled intracellular metabolites produced in pure-culture T. elongata fed with glycine (100% of [13C]glycine consumed)
| Metabolite(s) | % of substrate taken up at 3 h |
|
|---|---|---|
| Anaerobic culture | Aerobic culture | |
| Intracellular | ||
| Glycine | 9.0 | <1 |
| Glutamine, serine, and alanine | <1 | <1 |
| Bound to macromolecules | ||
| Glycine | 4.0 | <1 |
| Glutamine | 4.0 | <1 |
| Serine | 2.0 | <1 |
| Alanine | 1.0 | <1 |
| Medium | ||
| Acetate | 20.0 | 0.0 |
| Succinate | 13.0 | 0.0 |
| Alanine | 27.0 | 0.0 |
| CO2 | NQa | NQ |
| Total | >83 | |
NQ, not quantifiable.
T. elongata contained intracellular unlabeled glutamate, just like activated sludge. Glutamate was detected at the beginning of the anaerobic period (approximately 19 mM), indicating residual carryover from the aerobic growth on the R2A medium. When glycine was added, the intracellular concentrations of glutamate increased from approximately 19 mM to approximately 31 mM during the 3-h anaerobic period. In the carbon source-free control experiment, the intracellular concentration of glutamate decreased from approximately 19 mM to approximately 13 mM during the 3-h anaerobic period and to approximately 8 mM during the 3-h aerobic period.
None of the four labeled intracellular metabolites (glycine, glutamine, alanine, and serine) were detectable when the anaerobic conditions started. Approximately 12% of the carbon taken up as [13C]glycine was stored intracellularly and approximately 9% as glycine (Table 3). In aerobic control experiments with 1 mM glycine added at the beginning, no intracellular glycine was observed after 3 h (data not shown). This control experiment also showed that no adsorption of glycine to the extracellular matrix of the biomass took place, since the concentration in the biomass fraction was zero, although the bulk concentration was approximately 0.54 mM.
Approximately 11% of glycine consumed was also found incorporated into bacterial proteins in the form of 13C labeled glycine, glutamine, alanine, and serine (Table 3). The largest fraction of the glycine consumed (60%) was excreted to bulk medium as alanine, acetate, and succinate (Table 3).
After switching to aerobic conditions, all intracellular 13C-labeled metabolites were almost consumed over 3 h. The long-term aerobic control showed that all components were consumed to concentrations below detection levels (results not shown).
DISCUSSION
The release of Pi under anaerobic conditions in activated sludge indicates that amino acids are important substrates for some PAOs in full-scale EBPR plants. Glycine was found to release most Pi and thus showed the highest potential for being taken up by PAOs. PAOs and many other microorganisms are known to form different compounds for energy and carbon storage, such as PHA, glycogen, and triacylglycerides (11, 34, 35), when growing under dynamic feast-famine conditions. This study demonstrates an additional strategy for growth under such conditions in Tetrasphaera: uptake and intracellular accumulation of the amino acid glycine along with a release of Pi under anaerobic conditions for subsequent use as a carbon source in the aerobic phase.
Uptake of glycine and release of Pi.
The uptake of glycine under anaerobic conditions occurred with a simultaneous release of Pi for both T. elongata and activated sludge. The molar ratio of P released to C glycine taken up was around 0.5, which is similar to the uptake of acetate by “Ca. Accumulibacter” (11, 36) The capacity for storage of acetate as PHA by “Ca. Accumulibacter” is controlled by the intracellular pools of poly(P) and glycogen (2, 17, 37, 38). Glycine uptake by Tetrasphaera is likely also controlled by the amount of intracellular poly(P) available to provide energy for substrate uptake by the action of the low-affinity Pit transporter that is present in all known PAOs, including Tetrasphaera (12, 35). This is also supported by the observation that uptake of glycine by both T. elongata and activated sludge showed the same saturation behavior as is known for acetate uptake in “Ca. Accumulibacter,” i.e., an initial fast uptake which gradually stops after 1.5 to 2 h when the internal storage capacity is saturated (7, 8, 39). Thus, the uptake of glycine most likely stopped when the intracellular pools of poly(P) in T. elongata and Tetrasphaera-like organisms in activated sludge were exhausted.
Accumulation and fermentation of glycine.
When glycine was taken up by T. elongata, part of it was fermented to glutamine, serine, and alanine. The intracellular concentration of glycine increased to 3.9 mM, while the other compounds gradually increased to 20 to 165 μM in T. elongata and to a comparable level in activated sludge (data not shown). Most was, however, excreted again.
Glycine can be consumed by many bacteria and converted through several biochemical pathways. The genomes of T. elongata contain genes for glycine fermentation via the glycine-serine-pyruvate interconversion, where acetate and serine are produced (40) (Table 4). The main reactions are the split of glycine into methylene-tetrahydrofolate (methylene-THF), CO2, and NH3 and the subsequent condensation of the methylene-THF formed with another glycine, yielding serine. Serine is converted into pyruvate, from which acetate is finally formed. The genes include the candidate genes encoding aminomethyltransferase (gcvT), glycine cleavage complex lipoyl-protein (gcvH), glycine/serine hydroxymethyltransferase (glyA), and pyruvate production (threonine dehydratase [tdc]). Glutamine and succinate may possibly be produced via the TCA cycle, where succinate is an intermediate, and glutamine can be formed from glutamate that can be produced by transamination of α-ketoglutarate. The ability of T. elongata to ferment provides an alternative source of energy which, is an additional key metabolic feature distinguishing it from “Ca. Accumulibacter.”
TABLE 4.
Genes coding for enzymes involved in glycine fermentation
| Gene | Protein | EC no. | T. elongata locus tag |
|---|---|---|---|
| tdc | Threonine dehydratase | 4.3.1.19 | BN10v3_920048 |
| tdh | Threonine 3-dehydrogenase | 1.1.1.103 | BN10v3_580033 |
| ltaE | Threonine aldolase | 4.1.2.5 | BN10v3_360038 |
| kbl | 2-Amino-3-ketobutyrate CoA ligase (glycine acetyltransferase) | 2.3.1.29 | BN10v3_580030 |
| glyA | Glycine/serine hydroxymethyltransferase | 2.1.2.1 | BN10v3_1140014 |
| serB | Phosphoserine phosphatase | 3.1.3.3 | BN10v3_1080040 |
| serC | Phosphoserine aminotransferase | 2.6.1.52 | BN10v3_510004 |
| serA | d-3-Phosphoglycerate dehydrogenase | 1.1.1.95 | BN10v3_330004 |
| gcvP | Glycine dehydrogenase (decarboxylating) | 1.4.4.2 | BN10v3_590002 |
| gcvT | Aminomethyltransferase | 2.1.2.10 | BN10v3_290005 |
| gcvH | Glycine cleavage complex lipoylprotein | BN10v3_590007 |
There are few studies where absolute intracellular concentrations have been measured in nonhalophilic bacteria. The total intracellular solute concentration in Escherichia coli grown on glucose has been found to be approximately 300 mM, with amino acids making up 50% (41). Glutamate was most abundant (100 mM), followed by aspartate, glutamine, and alanine in the range of 2 to 4 mM. Serine was present in concentrations of 0.02 to 0.1 mM, while glycine was not detected. However, the exact concentrations cannot be compared, as Bennett et al. (41) applied organic extraction that did not differentiate between free and macromolecule-bound metabolites.
The presence of high intracellular concentrations of glutamate is described for some Gram-positive bacteria (42) which are exploited for industrial production of glutamate and succinate (42, 43). Glutamate has been reported to have several important roles in living organisms, including stress response and as an important link between C and N metabolism (44). The putative PAO Microlunatus phosphovorus has previously been observed to contain intracellular glutamate, presumably taken up directly from the medium (14).
When glycine was taken up in our study, this was followed by an increase in the unlabeled intracellular glutamate concentration during the anaerobic period for both activated sludge and T. elongata. The unlabeled intracellular glutamate did not derive from glycine but must come from protein degradation, other nonidentified internal metabolites, or storage components. More investigations of these unknown metabolites should be conducted.
Excretion of metabolites and C mass balances.
When glycine was taken up and accumulated intracellularly in T. elongata, a large fraction (60%) was excreted to bulk medium as the fermentation products acetate, succinate, and alanine. This was also detectable in activated sludge, where primarily glyoxylate and serine were detected shortly after glycine addition but were very quickly metabolized by the flanking community.
In T. elongata, no excreted glyoxylate was found, in agreement with the absence of the key genes in the genome. This indicates that bacteria other than Tetrasphaera species, with a metabolism different from that of T. elongata, may excrete glyoxylate from glycine in activated sludge. Most of the 13C consumed could be accounted for in the mass balances. Less than 27% (in activated sludge) and 17% (in T. elongata) could not be accounted for and is likely converted to CO2 or diluted below the detection limit among many different products.
Intracellular accumulation of metabolites, a novel microbial strategy for survival in dynamic anaerobic-aerobic feast-famine systems.
Many bacteria in activated sludge are known to take up substrate and form PHA, but only few can do so under anaerobic conditions. These primarily are PAOs and related organisms such as “Ca. Accumulibacter,” “Ca. Halomonas” PAO, and “Candidatus Competibacter” (9, 11, 35, 45). PHA formation usually occurs in order to balance high NADH/NAD+ ratios in the presence of high acetyl coenzyme A (acetyl-CoA) production, in which case PHA acts as an alternate electron sink (46). Glycine was not converted to PHA in the activated sludge, despite the presence of “Ca. Accumulibacter,” which supports the observation that there is a niche differentiation between “Ca. Accumulibacter” and Tetrasphaera, and only the latter consumes glycine and several other amino acids (8).
The intracellular accumulation of substrate by Tetrasphaera was not very high (4 mM) and not comparable in amount to the accumulation of storage products such as PHA by “Ca. Accumulibacter.” However, since the uptake was very quick (a few minutes in these experiments), it provides a competitive advantage in highly dynamic systems, as can be found in many EBPR plants. Since Tetrasphaera can also ferment glycine, it obtains additional energy under the anaerobic conditions, similar to what it obtains from glucose (12); these are all physiological traits that allow them to be so successful in EBPR plants.
In this study, only the uptake of glycine was investigated in greater detail. Several other amino acids also induced P release from activated sludge, although to a lesser extent than glycine, so more studies are needed to understand the full the potential and mechanisms behind amino acids and EBPR activity.
On the methodology side, we here demonstrate a procedure for robust quantification of intracellular metabolites independent of losses during sampling and sample preparation by using a triple internal standard, allowing the back-calculation of accurate concentrations in the initially taken sample from the finally measured concentrations. Having established the expected NMR integral of the region from 0.45 to 4.5 ppm per gram of biomass makes the further inclusion of fumarate as a standard in principle unnecessary; however, this value, and thus qf, can vary from reactor to reactor and from biomass to biomass. Thus, it is recommended to always include fumarate in order to eliminate the influence of (the randomly varying) losses during the extraction step. Thus, even if the exact value of qf were unknown, metabolite concentrations in several different samples could still be reliably quantified relative to each other.
In summary, bacteria in the genus Tetrasphaera are exciting and extremely versatile microorganisms perfectly suited for living in highly dynamic systems such as EBPR plants, where they belong to the most abundant organisms and play many roles; they can use oxygen and nitrate/nitrite as electron acceptors, they ferment glucose, glycine, and likely other compounds, they take up and release Pi, they excrete extracellular enzymes, and we can now also add the capability for anaerobic intracellular storage of several soluble substrates.
Supplementary Material
ACKNOWLEDGMENTS
This study was funded by Danish wastewater treatment plants (the Microbial Database), the Danish Research Council (Ion Accumulation), and the Innovation Fund Denmark (EcoDesign-MBR). The NMR laboratory at Aalborg University is supported by the Obel, SparNord, and Carlsberg foundations.
We thank P. Wilinski for help with P release experiments.
Footnotes
Supplemental material for this article may be found at http://dx.doi.org/10.1128/AEM.01012-15.
REFERENCES
- 1.Comeau Y, Hall KJ, Hancock REW, Oldham WK. 1986. Biochemical model for enhanced biological phosphorus removal. Water Res 20:1511–1521. doi: 10.1016/0043-1354(86)90115-6. [DOI] [Google Scholar]
- 2.Mino T, van Loosdrecht MCM, Heijnen JJ. 1998. Microbiology and biochemistry of the enhanced biological phosphate removal process. Water Res 32:3193–3207. doi: 10.1016/S0043-1354(98)00129-8. [DOI] [Google Scholar]
- 3.Pereira H, Lemos PC, Reis MAM, Crespo JPSG, Carrondo MJT, Santos H. 1996. Model for carbon metabolism in biological phosphorus removal processes based on in vivo 13C-NMR labeling experiments. Water Res 30:2128–2138. doi: 10.1016/0043-1354(96)00035-8. [DOI] [Google Scholar]
- 4.Wexler M, Richardson DJ, Bond PL. 2009. Radiolabelled proteomics to determine differential functioning of Accumulibacter during the anaerobic and aerobic phases of a bioreactor operating for enhanced biological phosphorus removal. Environ Microbiol 11:3029–3044. doi: 10.1111/j.1462-2920.2009.02007.x. [DOI] [PubMed] [Google Scholar]
- 5.van Loosdrecht MCM, Smolders GJ, Kuba T, Heijnen JJ. 1997. Metabolism of micro-organisms responsible for enhanced biological phosphorus removal from wastewater: use of dynamic enrichment cultures. Antonie Van Leeuwenhoek 71:109–116. doi: 10.1023/A:1000150523030. [DOI] [PubMed] [Google Scholar]
- 6.Seviour RJ, Mino T, Onuki M. 2003. The microbiology of biological phosphorus removal in activated sludge systems. FEMS Microbiol Rev 27:99–127. doi: 10.1016/S0168-6445(03)00021-4. [DOI] [PubMed] [Google Scholar]
- 7.Kong Y, Nielsen JL, Nielsen PH. 2005. Identity and ecophysiology of uncultured actinobacterial polyphosphate-accumulating organisms in full-scale enhanced biological phosphorus removal plants. Appl Environ Microbiol 71:4076–4085. doi: 10.1128/AEM.71.7.4076-4085.2005. [DOI] [PMC free article] [PubMed] [Google Scholar]
- 8.Nguyen HTT, Le VQ, Hansen AA, Nielsen JL, Nielsen PH. 2011. High diversity and abundance of putative polyphosphate-accumulating Tetrasphaera-related bacteria in activated sludge systems. FEMS Microbiol Ecol 76:256–267. doi: 10.1111/j.1574-6941.2011.01049.x. [DOI] [PubMed] [Google Scholar]
- 9.Nguyen HTT, Nielsen JL, Nielsen PH. 2012. “Candidatus Halomonas phosphatis,” a novel polyphosphate-accumulating organism in full-scale enhanced biological phosphorus removal plants. Environ Microbiol 14:2826–2837. doi: 10.1111/j.1462-2920.2012.02826.x. [DOI] [PubMed] [Google Scholar]
- 10.Mielczarek AT, Nguyen HTT, Nielsen JL, Nielsen PH. 2013. Population dynamics of bacteria involved in enhanced biological phosphorus removal in Danish wastewater treatment plants. Water Res 47:1529–1544. doi: 10.1016/j.watres.2012.12.003. [DOI] [PubMed] [Google Scholar]
- 11.Garcia Martin H, Ivanova N, Kunin V, Warnecke F, Barry KW, McHardy AC, Yeates C, He S, Salamov AA, Szeto E, Dalin E, Putnam NH, Shapiro HJ, Pangilinan JL, Rigoutsos I, Kyrpides NC, Blackall LL, McMahon KD, Hugenholtz P. 2006. Metagenomic analysis of two enhanced biological phosphorus removal (EBPR) sludge communities. Nat Biotechnol 24:1263–1269. doi: 10.1038/nbt1247. [DOI] [PubMed] [Google Scholar]
- 12.Kristiansen R, Nguyen HTT, Saunders AM, Nielsen JL, Wimmer R, Le VQ, McIlroy SJ, Petrovski S, Seviour RJ, Calteau A, Nielsen KL, Nielsen PH. 2013. A metabolic model for members of the genus Tetrasphaera involved in enhanced biological phosphorus removal. ISME J 7:543–554. doi: 10.1038/ismej.2012.136. [DOI] [PMC free article] [PubMed] [Google Scholar]
- 13.Nielsen PH, Mielczarek AT, Kragelund C, Nielsen JL, Saunders AM, Kong Y, Hansen AA, Vollertsen J. 2010. A conceptual ecosystem model of microbial communities in enhanced biological phosphorus removal plants. Water Res 44:5070–5088. doi: 10.1016/j.watres.2010.07.036. [DOI] [PubMed] [Google Scholar]
- 14.Santos MM, Lemos PC, Reis MA, Santos H. 1999. Glucose metabolism and kinetics of phosphorus removal by the fermentative bacterium Microlunatus phosphovorus. Appl Environ Microbiol 65:3920–3928. [DOI] [PMC free article] [PubMed] [Google Scholar]
- 15.Pijuan M, Saunders AM, Guisasola A, Baeza JA, Casas C, Blackall LL. 2004. Enhanced biological phosphorus removal in a sequencing batch reactor using propionate as the sole carbon source. Biotechnol Bioeng 85:56–67. doi: 10.1002/bit.10813. [DOI] [PubMed] [Google Scholar]
- 16.Lu H, Oehmen A, Virdis B, Keller J, Yuan Z. 2006. Obtaining highly enriched cultures of Candidatus Accumulibacter phosphates through alternating carbon sources. Water Res 40:3838–3848. doi: 10.1016/j.watres.2006.09.004. [DOI] [PubMed] [Google Scholar]
- 17.Oehmen A, Lemos PC, Carvalho G, Yuan Z, Keller J, Blackall LL, Reis MA. 2007. Advances in enhanced biological phosphorus removal: from micro to macro scale. Water Res 41:2271–2300. doi: 10.1016/j.watres.2007.02.030. [DOI] [PubMed] [Google Scholar]
- 18.Seviour R, Blackall LL (ed). 1999. The microbiology of activated sludge. Kluwer Academic Publishers, Dordrecht, The Netherlands. [Google Scholar]
- 19.Hanada S, Liu WT, Shintani T, Kamagata Y, Nakamura K. 2002. Tetrasphaera elongata sp. nov., a polyphosphate-accumulating bacterium isolated from activated sludge. Int J Syst Evol Microbiol 52:883–887. doi: 10.1099/ijs.0.01990-0. [DOI] [PubMed] [Google Scholar]
- 20.Reasoner DJ, Geldreich EE. 1985. A new medium for the enumeration and subculture of bacteria from potable water. Appl Environ Microbiol 49:1–7. [DOI] [PMC free article] [PubMed] [Google Scholar]
- 21.Williams TM, Unz RF. 1989. The nutrition of Thiothrix, type 021N, Beggiatoa and Leucothrix strains. Water Res 23:15–22. [Google Scholar]
- 22.Nielsen JL. 2009. Protocol for Fluorescence in situ hybridization (FISH) with rRNA-targeted oligonucleotides, p 73–84. In Nielsen PH, Daims H, Lemmer H (ed), FISH handbook for biological wastewater treatment: identification and quantification of microorganisms in activated sludge and biofilms by FISH. IWA Publishing, London, United Kingdom. [Google Scholar]
- 23.Amann RI, Ludwig W, Schleifer KH. 1995. Phylogenetic identification and in situ detection of individual microbial cells without cultivation. Microbiol Rev 59:143–169. [DOI] [PMC free article] [PubMed] [Google Scholar]
- 24.Daims H, Brühl A, Amann R, Schleifer KH, Wagner M. 1999. The domain-specific probe EUB338 is insufficient for the detection of all Bacteria: development and evaluation of a more comprehensive probe set. Syst Appl Microbiol 22:434–444. doi: 10.1016/S0723-2020(99)80053-8. [DOI] [PubMed] [Google Scholar]
- 25.Crocetti GR, Hugenholtz P, Bond PL, Schuler A, Keller J, Jenkins D, Blackall LL. 2000. Identification of polyphosphate-accumulating organisms and design of 16S rRNA-directed probes for their detection and quantitation. Appl Environ Microbiol 66:1175–1182. doi: 10.1128/AEM.66.3.1175-1182.2000. [DOI] [PMC free article] [PubMed] [Google Scholar]
- 26.Nielsen JL, Nielsen PH. 2005. Advances in microscopy: microautoradiography of single cells. Methods Enzymol 397:237–256. doi: 10.1016/S0076-6879(05)97014-6. [DOI] [PubMed] [Google Scholar]
- 27.American Public Health Association. 1981. Standard methods for the examination of water and wastewater, 15th ed American Public Health Association, Washington, DC. [Google Scholar]
- 28.Fry JC. 1988. Determination of biomass, p 27–72. In Austin B. (ed), Methods in aquatic bacteriology. John Wiley, Chichester, United Kingdom. [Google Scholar]
- 29.Wu H, Wang W-X. 2010. NMR-based metabolomic studies on the toxicological effects of cadmium and copper on green mussels Perna viridis. Aquat Toxicol 100:339–345. doi: 10.1016/j.aquatox.2010.08.005. [DOI] [PubMed] [Google Scholar]
- 30.Wishart DS, Knox C, Guo AC, Eisner R, Young N, Gautam B, Hau DD, Psychogios N, Dong E, Bouatra S, Mandal R, Sinelnikov I, Xia J, Jia L, Cruz JA, Lim E, Sobsey CA, Shrivastava S, Huang P, Liu P, Fang L, Peng J, Fradette R, Cheng D, Tzur D, Clements M, Lewis A, De Souza A, Zuniga A, Dawe M, Xiong Y, Clive D, Greiner R, Nazyrova A, Shaykhutdinov R, Li L, Vogel HJ, Forsythe I. 2009. HMDB: a knowledgebase for the human metabolome. Nucleic Acids Res 37:D603–D610. doi: 10.1093/nar/gkn810. [DOI] [PMC free article] [PubMed] [Google Scholar]
- 31.Murphy J, Riley JP. 1962. A modified single solution method for the determination of phosphate in natural waters. Anal Chim Acta 27:31–36. doi: 10.1016/S0003-2670(00)88444-5. [DOI] [Google Scholar]
- 32.Heikkinen S, Toikka MM, Karhunen PT, Kilpeläinen IA. 2003. Quantitative 2D HSQC (Q-HSQC) via suppression of J-dependence of polarization transfer in NMR spectroscopy: application to wood lignin. J Am Chem Soc 125:4362–4367. doi: 10.1021/ja029035k. [DOI] [PubMed] [Google Scholar]
- 33.Peterson DJ, Loening NM. 2007. QQ-HSQC: a quick, quantitative heteronuclear correlation experiment for NMR spectroscopy. Magn Reson Chem 45:937–941. doi: 10.1002/mrc.2073. [DOI] [PubMed] [Google Scholar]
- 34.Alvarez HM, Steinbuchel A. 2002. Triacylglycerols in prokaryotic microorganisms. Appl Microbiol Biotechnol 60:367–376. doi: 10.1007/s00253-002-1135-0. [DOI] [PubMed] [Google Scholar]
- 35.McIlroy SJ, Albertsen M, Andresen EK, Saunders AM, Kristiansen R, Stokholm-Bjerregaard M, Nielsen KL, Nielsen PH. 2014. “Candidatus Competibacter”-lineage genomes retrieved from metagenomes reveal functional metabolic diversity. ISME J 8:613–624. doi: 10.1038/ismej.2013.162. [DOI] [PMC free article] [PubMed] [Google Scholar]
- 36.Hesselmann RPX, von Rummel R, Resnick SM, Hany R, Zehnder AJB. 2000. Anaerobic metabolism of bacteria performing enhanced biological phosphate removal. Water Res 34:3487–3494. doi: 10.1016/S0043-1354(00)00092-0. [DOI] [Google Scholar]
- 37.Burow LC, Mabbett AN, McEwan AG, Bond PL, Blackall LL. 2008. Bioenergetic models for acetate and phosphate transport in bacteria important in enhanced biological phosphorus removal. Environ Microbiol 10:87–98. doi: 10.1111/j.1462-2920.2007.01432.x. [DOI] [PubMed] [Google Scholar]
- 38.He S, McMahon KD. 2011. Microbiology of “Candidatus Accumulibacter” in activated sludge. Microb Biotechnol 4:603–619. doi: 10.1111/j.1751-7915.2011.00248.x. [DOI] [PMC free article] [PubMed] [Google Scholar]
- 39.Kong Y, Nielsen JL, Nielsen PH. 2004. Microautoradiographic study of Rhodocyclus-related polyphosphate-accumulating bacteria in full-scale enhanced biological phosphorus removal plants. Appl Environ Microbiol 70:5383–5390. doi: 10.1128/AEM.70.9.5383-5390.2004. [DOI] [PMC free article] [PubMed] [Google Scholar]
- 40.Klein SM, Sagers RD. 1962. Intermediary metabolism of Diplococcus glycinophilus. II. Enzymes of the acetate-generating system. J Bacteriol 83:121–126. [DOI] [PMC free article] [PubMed] [Google Scholar]
- 41.Bennett BD, Kimball EH, Gao M, Osterhout R, Van Dien SJ, Rabinowitz JD. 2009. Absolute metabolite concentrations and implied enzyme active site occupancy in Escherichia coli. Nat Chem Biol 5:593–599. doi: 10.1038/nchembio.186. [DOI] [PMC free article] [PubMed] [Google Scholar]
- 42.Pequignot C, Dussap CG, Pons A, Gros JB. 1997. Intra- and extracellular concentrations of glutamate, lactate and acetate during growth of Corynebacterium glutamicum on different media. J Ind Microbiol Biotechnol 18:312–318. doi: 10.1038/sj.jim.2900386. [DOI] [Google Scholar]
- 43.Agarwal L, Isar J, Meghwanshi GK, Saxena RK. 2007. Influence of environmental and nutritional factors on succinic acid production and enzymes of reverse tricarboxylic acid cycle from Enterococcus flavescens. Enzyme Microb Technol 40:629–636. doi: 10.1016/j.enzmictec.2006.05.019. [DOI] [Google Scholar]
- 44.Feehily C, Karatzas KAG. 2013. Role of glutamate metabolism in bacterial responses towards acid and other stresses. J Appl Microbiol 114:11–24. doi: 10.1111/j.1365-2672.2012.05434.x. [DOI] [PubMed] [Google Scholar]
- 45.Crocetti GR, Banfield JF, Keller J, Bond PL, Blackall LL. 2002. Glycogen-accumulating organisms in laboratory-scale and full-scale wastewater treatment processes. Microbiology 148:3353–3364. [DOI] [PubMed] [Google Scholar]
- 46.Anderson AJ, Dawes EA. 1990. Occurrence, metabolism, metabolic role, and industrial uses of bacterial polyhydroxyalkanoates. Microbiol Rev 54:450–472. [DOI] [PMC free article] [PubMed] [Google Scholar]
Associated Data
This section collects any data citations, data availability statements, or supplementary materials included in this article.