

Abstract
Nitrobacter winogradskyi is a chemolithotrophic bacterium that plays a role in the nitrogen cycle by oxidizing nitrite to nitrate. Here, we demonstrate a functional N-acyl-homoserine lactone (acyl-HSL) synthase in this bacterium. The N. winogradskyi genome contains genes encoding a putative acyl-HSL autoinducer synthase (nwi0626, nwiI) and a putative acyl-HSL autoinducer receptor (nwi0627, nwiR) with amino acid sequences 38 to 78% identical to those in Rhodopseudomonas palustris and other Rhizobiales. Expression of nwiI and nwiR correlated with acyl-HSL production during culture. N. winogradskyi produces two distinct acyl-HSLs, N-decanoyl-l-homoserine lactone (C10-HSL) and a monounsaturated acyl-HSL (C10:1-HSL), in a cell-density- and growth phase-dependent manner, during batch and chemostat culture. The acyl-HSLs were detected by bioassay and identified by ultraperformance liquid chromatography with information-dependent acquisition mass spectrometry (UPLC-IDA-MS). The C=C bond in C10:1-HSL was confirmed by conversion into bromohydrin and detection by UPLC-IDA-MS.
INTRODUCTION
The fate of nitrogen in aquatic and terrestrial environments is dependent on the microbially driven process of nitrification. Aerobic nitrification is carried out primarily by diverse, chemolithotrophic microorganisms in a two-step process with ammonia (NH3) being converted to nitrite (NO2−) and then to nitrate (NO3−) (1–3). Two physiologically distinct and diverse groups of organisms participate: the ammonia oxidizers, bacteria (AOB) and archaea (AOA), and nitrite-oxidizing bacteria (NOB) (1–3). Coupling of NH3 oxidation to NO2− oxidation is important to provide energy and reductant for both nitrification partners, to avoid the inhibitory effects of NO2− accumulation on AOB and AOA, and to control the availability of NO3− for plant growth (1–4). The process of nitrification is mostly well coupled in natural environments as NO2− rarely accumulates (5, 6). However, environmental fluctuations and stresses can result in uncoupling and NO2− accumulation (7, 8), which may lead to production of N2O, a potent greenhouse gas, and a reduction in nitrogen use efficiency by agricultural crops (9). Considering the wide variety of proteobacteria involved in nitrification, bacterial cell-cell signaling or quorum sensing (QS) via N-acyl-homoserine lactones (acyl-HSLs) may be one mechanism that contributes to coupling and maintaining efficient nitrification between nitrifying bacteria (10–12).
QS is a common strategy to coordinate gene expression with cell density, diffusion dynamics, and spatial distribution via the production of diffusible chemical signals (10–12). In bacteria, QS can control a host of different cooperative and stress-associated phenotypes, including exopolysaccharide production, biofilm formation, motility, exoenzyme secretion, luminescence, conjugation, and adaptation to stationary phase (10, 12–14). Acyl-HSLs are the best-studied signaling compounds, or autoinducers, in Gram-negative bacteria, but peptide signals, quinolones, aryl-homoserine lactones, and other chemical moieties can also act as autoinducers in bacteria (15, 16).
Acyl-HSL QS usually employs a LuxI homolog autoinducer synthase and a LuxR homolog signal receptor, with their associated genes being commonly located adjacent to each other in the genome and LuxI being generally positively autoregulated (16). The autoinducer synthase is continuously expressed at a basal level and produces acyl-HSLs that initially diffuse or are transported out of the cell. When a critical threshold concentration is reached, autoinducers diffuse or are transported back into the cell and are bound by the signal receptor that activates transcription of a variety of genes, generally including the autoinducer synthase. In this way, whole populations of cells coordinate gene expression in response to diffusible chemical signals.
There is evidence for acyl-HSL QS in nitrifying bacteria. Two AOB may produce acyl-HSLs (17–19), and a metagenomic clone from the phylum Nitrospirae and potentially from the NOB “Candidatus Nitrospira defluvii” contained LuxI and LuxR homologs (20). There is precedent for acyl-HSL QS in mixed populations of bacteria carrying out anaerobic ammonium oxidation (anammox) (21, 22); however, we are focused on aerobic nitrifying bacteria. Nitrobacter winogradskyi, a well-studied nitrite-oxidizing bacterium, contains adjacent luxI and luxR gene homologs in its genome (nwi0626 and nwi0627, respectively), suggesting that it has the potential to produce and respond to acyl-HSL autoinducers (23).
The Nitrobacter genus is a widely distributed group of NOB in the family Bradyrhizobiaceae that is isolated from soil, water, and sewage and closely related to various Rhizobiales group members (3, 4). Nitrobacter winogradskyi was isolated from soil, and it is commonly used as a model NOB because of its superior growth rate, nitrite tolerance, and growth yield compared to those of other NOB (3, 4). Currently, there is no information on the purpose of acyl-HSL QS in N. winogradskyi, but QS may serve to regulate cellular functions, such as nitrogen metabolism and biofilm formation, or possibly interspecies signaling with AOB. Further knowledge of acyl-HSL QS in this NOB is the first step in determining if there is a role for QS during nitrification.
In this study, we characterize a LuxI signal synthase homolog (referred to here as NwiI) and a LuxR signal receptor homolog (referred to here as NwiR) in N. winogradskyi by comparison to homologs in other Rhizobiales members with QS systems. We show that nwiI and nwiR are expressed in a cell density- and growth phase-dependent manner that correlates with acyl-HSL production measured by bioassay. Finally, we identify acyl-HSLs by ultraperformance liquid chromatography with information-dependent acquisition mass spectrometry (UPLC-IDA-MS).
MATERIALS AND METHODS
Chemicals.
N-Decanoyl-dl-homoserine lactone, analytical-grade acetonitrile, and formic acid were purchased from Sigma-Aldrich (St. Louis, MO). High-performance liquid chromatography (HPLC)-grade ethyl acetate and acetic acid were purchased from EMD Chemicals (Darmstadt, Germany) and VWR International (Radnor, PA), respectively.
Bacterial strains and growth medium.
N. winogradskyi Nb-255 was routinely cultivated in 60 mM NaNO2− minimal salts medium as described previously (24). Agrobacterium tumefaciens KYC55(pJZ372)(pJZ384)(pJZ410) was cultivated, preinduced, and used in detection of acyl-HSLs as described previously (25, 26).
Bioinformatic analyses.
The Kyoto Encyclopedia of Genes and Genomes (KEGG) (http://www.genome.jp/kegg/) and Basic Local Alignment Search Tool (BLAST) (http://blast.ncbi.nlm.nih.gov/Blast.cgi) were used to identify QS-related genes in N. winogradskyi and homologs in related organisms (27, 28). MUSCLE was used for multiple alignment of amino acid sequences (29, 30), and phylogenetic analyses were conducted using MEGA6 (31). The NwiI and NwiR evolutionary histories were inferred using the maximum likelihood method, based on the Le Gascuel model, gamma distributed with invariant sites and with partial deletion of gaps (32). Phylogenetic trees were visualized using FigTree, version 1.4.2 (http://tree.bio.ed.ac.uk/software/figtree/).
Growth conditions.
Cells in chemostats were grown at 28°C in NO2−-supplemented medium adjusted to pH 7.2 to reduce lactonolysis of potential acyl-HSLs. Cell density was manipulated by changing the NO2− concentration in the medium reservoir (5 mM, 12 mM, and 60 mM) to generate approximately 1 × 10⁶, 4 × 10⁶, and 2 × 10⁷ cells ml−1 (optical densities at 600 nm [OD600s] of 0.003 to 0.006, 0.01 to 0.03, and 0.04 to 0.07, respectively) based on previously published cell density estimates (33). Experimental chemostats with 1 liter of culture medium were assembled in glass vessels (Bio-Probe, catalog number 1965-97001; Bellco Glass, Vineland, NJ) and maintained at a steady-state dilution rate (D) of 0.015 h−1 (doubling time [Td] of 1.93 days). Steady state was defined as two doublings with less than a 10% change in OD600 and nitrite concentration. At steady state, D is equal to the specific growth rate (μ), and μ can be converted to Td via the equation ln(2) = Td · μ (based on the classic growth equation N = N0 · eμt, where N represents the cell density at time t and N0 represents the starting cell density). Chemostats were routinely monitored for OD600 and NO2− concentration, and heterotrophic bacterial contamination was assessed by plating 200-μl aliquots of culture on Luria-Bertani agar plates. Batch cultures were carried out as outlined above in 60 mM NO2−-supplemented medium at pH 7.2, inoculated to an optical density at 600 nm (OD600) of 0.0005 from mid-exponential-phase cultures, and grown in Erlenmeyer flasks in a rotary shaker at 100 rpm at 28°C. Experimental cultures were monitored every 24 h to check the OD600 value, the NO2− concentration by the Griess assay as described previously (34), and for the presence of acyl-HSL (bioassay). Cells were harvested on days 2, 4, and 6 for RNA extraction from batch cultures growing at three different approximate growth rates (fast, day 2 OD600 of ≈0.00387 and Td of ≈0.67 days; medium, day 4 OD600 of ≈0.0330 and Td of ≈1.75 days; slow, day 6 OD600 of ≈0.0458 and Td of ≈2.20 days). Growth rate was calculated using the equation: Td = (t2 − t1) · [log(2)/log(q2/q1)], where the OD600 is used for cell density q and time t is in days. The Td was calculated based on the change in cell density from the previous day.
RNA extraction and qPCR.
RNA was extracted as described previously with minor modifications (33). Briefly, bacterial cells were collected and concentrated by centrifugation and lysed via sonication, and RNA was purified with an RNeasy minikit (Qiagen, Germantown, MD) as recommended by the manufacturer. Transcript levels were analyzed by a two-step reverse-transcription quantitative PCR (qPCR) procedure using a CFX96 Touch real-time PCR system with SYBR green-I-based detection kits according to the directions of the manufacturer (Bio-Rad Laboratories, Hercules, CA) and normalized to cDNA concentrations measured with a NanoDrop ND UV-visible light (UV-Vis) spectrophotometer (Thermo Scientific, Wilmington, DE) to account for differences in cell density and reverse transcriptase efficiency between samples. Synthesis of cDNAs was carried out as previously described (35). Primers for qPCR transcript quantification of nwiI were ACGAGATGGAGCAGGCTTAT (forward) and AGAACGCGATCTTCTTCGAT (reverse), and those for nwiR were GAGCGCTATTTCACGAAAGG (forward) and GTTTGACCGTTGAGGGTGAT (reverse). The 25-μl qPCR mixtures contained forward and reverse primers (300 nM each; listed above), 1 ng of purified cDNA, and iQ SYBR green Supermix reagents (Bio-Rad Laboratories, Hercules, CA). The cycling program consisted of 5 min at 95°C, followed by 40 cycles of 15 s at 95°C and 1 min at 60°C. Dissociation curves were created to ensure the absence of nonspecific amplification. Reaction efficiency and initial concentrations of template were calculated with LinRegPCR, version 2015.1, as described previously (36).
Acyl-HSL bioassay.
Acyl-HSLs were extracted twice from 10 ml of culture supernatant with an equal volume of acidified ethyl acetate as previously described (37). Extracts were dried down under filtered air, reconstituted to a 100× stock, and screened for acyl-HSLs (at a 1× concentration) by a broad-range Agrobacterium bioassay (via a β-galactosidase reporter system) as described previously (25, 26). Briefly, the cell lysate from the bioassay is used to perform a Miller assay to detect β-galactosidase activity by adding o-nitrophenyl-β-d-galactopyranoside (ONPG), measuring the time to observe a color change, and measuring the OD420. Miller units were calculated using the following equation: number of Miller units = 1,000(OD420)/[(bioassay OD600)(Ts − T0)0.2] where the Ts is the time of color change and T0 is the time of ONPG addition. The Agrobacterium bioassay used in this study was previously shown to detect at least 32 acyl-HSLs and acyl-HSL analogs (25, 38).
Ultraperformance liquid chromatography with information-dependent acquisition mass spectrometry (UPLC-IDA-MS).
Acyl-HSL signal structure was identified as described previously with modifications (39). The supernatants of three replicate 1-liter batch cultures were collected after the cells were pelleted by centrifugation during the period of peak signal production per cell (day 4 batch culture at an OD600 of 0.025 to 0.035, according to the bioassay). The supernatant was then acidified to pH 2 with HCl to avoid lactonolysis and extracted five times with 200 ml of ethyl acetate. Extracts were dried down under a stream of filtered air and reconstituted in water with 20% (vol/vol) acetonitrile and 0.1% (vol/vol) formic acid.
Samples (volume, 10 μl) were separated on a Synergi C12 reverse-phase column (250 by 1 mm; particle size, 4 μm [Phenomenex, Torrance, CA]) using a Nexera LC-30AD UPLC (Shimadzu, Kyoto, Japan). The elution program consisted of water with 5% acetonitrile for 2 min, followed by a linear increase to 90% acetonitrile over 30 min, and a hold of 15 min at 90% acetonitrile; the column was then reequilibrated for 15 min at 5% acetonitrile. Mass spectrometry was performed using a 5600 Triple TOF (time of flight) instrument (AB Sciex, Concord, Ontario, Canada) in positive-ion electrospray ionization (ESI) mode. The instrument was operated at a temperature of 250°C and a spray voltage of 5,500 V. An information-dependent acquisition (IDA) HPLC-MS method was used to acquire MS and product ion data. Product ion parameters were set at a collision energy (CE) of 30 and a declustering potential (DP) of 80. Product ion spectra were searched for marker fragment products at m/z (mass/charge) 102.055 since acyl-HSLs consistently fragment to a protonated ([M+H]+) lactone moiety (C4H8NO2, [M+H]+, m/z 102.055). Data were analyzed by Analyst TF, version 1.5, and PeakView, view 1.2 (AB Sciex, Concord, Ontario, Canada). Chemical structures were drawn with ChemSketch Freeware, version 2012 (ACD Labs, Ontario, Canada).
The position of the C=C double bond on the acyl chain of C10:1-HSL was determined based on the ion fragmentation series of unsaturated acyl-HSLs reported previously (40). Briefly, unsaturated acyl-HSL ion fragmentation suggests that if the double bond were placed on the (7 ± x)th carbon distant from the amidic group, then the series of ions with even-numbered m/z ratios would end at m/z (198 ± 14x) (40).
RESULTS
Characterization of autoinducer synthase and receptor homologs NwiI and NwiR.
The open reading frames (ORFs) nwi0626 and nwi0627 of N. winogradskyi were previously annotated as putative LasI and LasR homologs, autoinducer synthase and signal receptor proteins, respectively, of the gammaproteobacterium Pseudomonas aeruginosa (23). LasI and LasR are homologs of the extensively studied LuxI and LuxR of Aliivibrio fischeri (formerly Vibrio fischeri) (16). For sequence identity comparison and phylogenetic analysis of putative autoinducer synthase and receptor homologs in N. winogradskyi, BLAST was coupled with KEGG to identify protein homologs of nwi0626 (NwiI) and nwi0627 (NwiR) and with MUSCLE to align the corresponding amino acid sequences. The closest homologs (by percent identity) to NwiI were found to be from Nitrobacter hamburgensis and closely related NOB (86 to 94%), Rhodopseudomonas palustris HaA2 (72%), and various Rhizobiales (38 to 68%). NwiI was only 25% similar to LasI. MEGA6 was used to construct a phylogenetic tree of various LuxI homologs to determine the evolutionary relationship of NwiI to other acyl-HSL synthases (Fig. 1A).
FIG 1.
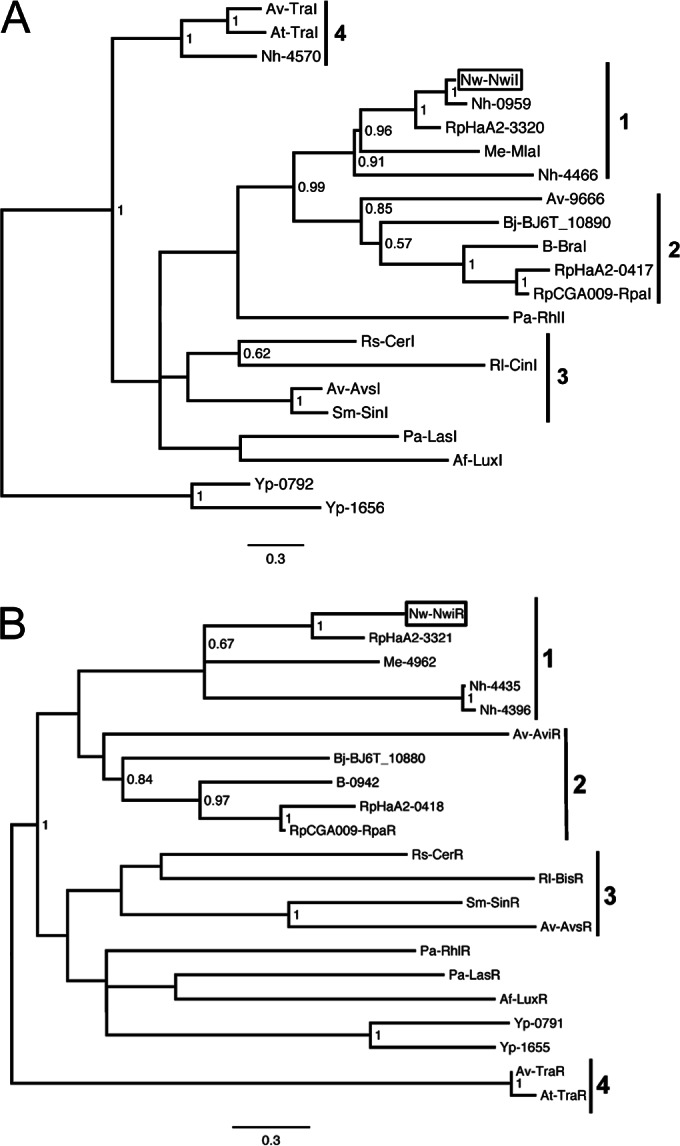
Phylogenetic trees of selected NwiI (A) and NwiR (B) homologs. The scale bar indicates the number of substitutions per residue. Bootstrap values from 500 resamplings are shown for nodes with 0.5 or greater. Boxes indicate the locations of NwiI and NwiR in the trees. Numbered bars indicate clades 1 through 4 described in Results. The name or gene number of the homolog follows abbreviations for genus and species: N. winogradskyi Nb-255 (Nw), N. hamburgensis X14 (Nh), Rhodopseudomonas palustris HaA2 and CGA009 (Rp), Methylobacterium extorquens AM1 (Me), Bradyrhizobium japonicum USDA6 (Bj), Bradyrhizobium sp. strain ORS278 (B), P. aeruginosa PAO1-UW (Pa), Rhodobacter sphaeroides 2.4.1 (Rs), Rhizobium leguminosarum bv. viciae 3841 (Rl), Agrobacterium vitis S4 (Av), Sinorhizobium meliloti 1021 (Sm), Aliivibrio fischeri ES114 (Af), A. tumefaciens C58 (At), and Yersinia paratuberculosis YP111 (Yp).
Autoinducer synthases from the Rhizobiales form four clades, each with distinguishing features (Fig. 1A). Clade 1 includes NwiI as well as two putative autoinducer synthases from the closely related N. hamburgensis, several uncharacterized autoinducer synthase genes from different R. palustris strains (only strain HaA2 shown), and a synthase from Methylobacterium extorquens (41–44). Clade 1 has few other distinguishing features besides that M. extorquens produces unsaturated acyl-HSLs (41). Clade 2 is distinguished by the production of unusual branched-chain acyl-HSLs and aryl-HSLs by R. palustris and Bradyrhizobium species (45–47). While clade 3 is poorly supported by bootstraps, all synthases in this clade synthesize long-chain (≥12 carbons), unsaturated acyl-HSLs (48–51). Clade 4 consists of TraI homologs, including a signal synthase from one of the large plasmids of N. hamburgensis (43, 52). The TraI/TraR (TraI/R) system has been well studied in Agrobacterium tumefaciens and other Rhizobiales, where it generally controls conjugation of the Ti plasmid involved in crown gall formation (52).
We reasoned that the cognate signal receptor genes, usually found adjacent to the autoinducer synthase in the genomes of characterized acyl-HSL-producing microorganisms, would form similar clades as they generally evolve together (53). We used the same pipeline outlined above to construct a phylogenetic tree of various LuxR homologs (Fig. 1B). While the nodes and branches of the receptor tree are different, each cognate signal receptor can be found in the same clade as the signal synthase genes, albeit with poor bootstrap support (Fig. 1B). The next step in demonstrating acyl-HSL quorum sensing (QS) in N. winogradskyi was to determine if nwiI and nwiR are expressed in a cell density-dependent manner and show positive auto-regulation.
Expression of nwiI and production of acyl-HSLs are cell density dependent during chemostat culture.
To measure expression of nwiI and nwiR during steady-state growth at different cell densities, we chose a chemostat culture maintained at a constant growth rate. By making NO2− the growth-limiting nutrient in chemostat culture and reducing its concentration in the medium reservoir, we altered the steady-state cell density while keeping the dilution rate constant for a steady-state doubling time (Td) of 1.93 days.
We found that nwiI was induced in a cell density-dependent manner (Fig. 2A). In the chemostat, expression of nwiI was induced greater than 10-fold at medium (OD600 of 0.012) and high (OD600 of 0.069) cell densities compared to the level at a low (OD600 of 0.0056) cell density (Fig. 2A). However, nwiR showed no change in gene expression in response to cell density under these conditions (Fig. 2A). Next, we measured the acyl-HSL concentration during chemostat culture using a broad-range, ultrasensitive A. tumefaciens bioassay that has been shown to detect a wide variety of acyl-HSLs of various chain lengths, saturation levels, and oxidation states (25, 38). Because the bioassay responds differently to different acyl-HSLs, quantification of specific signal populations was not possible, so signal concentrations were expressed as Miller units (see the “Acyl-HSL bioassay” section in Materials and Methods) (25). A significant increase in acyl-HSL concentration was detected when cell density increased in response to an increasing NO2− concentration (Fig. 2B). A 2-fold increase in cell density caused by increasing the NO2− concentration from 5 to 12 mM resulted in a 6-fold increase in total acyl-HSL. The highest cell densities showed a 10-fold increase relative to the lowest cell densities (Fig. 2B). When we calculated the amount of acyl-HSL produced per day, normalized to optical density, there was significantly more acyl-HSL being produced at the medium cell density than at the other densities (Fig. 2C).
FIG 2.

Gene expression and acyl-HSL detection during chemostat culture. Fold change in expression of nwiI and nwiR was measured by qPCR (A), and total acyl-HSL detected (B) and acyl-HSL production (C) were measured by bioassay during chemostat culture. Filled circles (line graphs) indicate cell density measured as the optical density at 600 nm (OD600; right y axis) controlled by the concentration of NO2− (x axis) in the medium reservoir. (A) Bars represent fold change expression relative to 5 mM NO2− (left y axis). (B and C) Bars represent acyl-HSL level or production (reported as Miller units or as Miller units · OD600−1 · day−1; left y axis). Asterisks indicate a statistically significant increase in expression or acyl-HSL level between 5 mM NO2− and other NO2− concentrations (*, P ≤ 0.05; **, P ≤ 0.005; ***, P ≤ 5e−5, by a two-tailed t test). Values are the means of three independent biological replicates. Error bars indicate the standard deviations of the means.
nwiI and nwiR expression and acyl-HSL production are cell density and growth phase dependent during batch culture.
The absence of nwiR induction during chemostat culture led us to investigate gene expression and acyl-HSL production during batch culture, where the growth rate is dynamic. We mimicked the different cell densities achieved in the chemostats by extracting RNA from batch cultures at similar cell densities (see Materials and Methods) but corresponding to different growth phases (Fig. 3A, x axis). Compared to the chemostat data, we detected similar cell density-dependent induction of nwiI when gene expression was measured in the presence of acyl-HSL during batch culture, but the growth rate of the batch cultures (based on the slope of the growth curve) had a profound effect (Fig. 3). Both nwiI and nwiR were induced approximately 5-fold at medium cell density compared to levels at low density, but when the growth rate decreased at high cell density, expression of both genes decreased (Fig. 3A).
FIG 3.

Gene expression and acyl-HSL detection during batch culture. Fold change in expression of nwiI and nwiR was measured by qPCR (A), and total acyl-HSL detected (B) and acyl-HSL production (C) were measured by bioassay during batch culture. Filled circles (line graphs) indicate cell density measured as the OD600 (right y axis). (A) RNA was extracted from batch cultures on days 2, 4, and 6 at three approximate cell densities that correspond to Tds (x axis). Bars represent fold change expression relative to a Td of 0.67 days (left y axis). (B) Bars represent acyl-HSL detected (reported as Miller units; left y axis). (C) Squares represent acyl-HSL production (Miller units · OD600−1 · day−1; left y axis). Batch cultures were sampled daily (x axis). Asterisks indicate statistically significant changes in gene expression compared to a Td of 0.67 days or acyl-HSL detection between days 1 and 2 and days 3 and 4 (*, P ≤ 0.05; **, P ≤ 0.005; ***, P ≤ 5e−5, by a two-tailed t test). The data points in a circle highlight a statistically significant (P ≤ 0.05 by a two-tailed t test) spike in acyl-HSL production (compared to levels for previous days) that correlates with growth phase transition (Td of ≈0.67 days changes to 1.75 days). Values are the means of three independent biological replicates. Error bars indicate the standard deviations of the means.
To further characterize the induction of acyl-HSL synthesis during batch culture, we measured acyl-HSL accumulation throughout batch growth. Similar to the chemostat results, acyl-HSL significantly accumulated during a 2-fold increase in the OD600 from low cell density (Fig. 3B). On day 3, acyl-HSL increased 6-fold compared to the level at day 2, and on day 4 there was a 4-fold increase in the amount of acyl-HSL compared to the amount at day 3 (Fig. 3B). When we calculated the amount of acyl-HSL produced per day, normalized to optical density, a significant spike in acyl-HSL production was observed on day 4 (Fig. 3C). This increase in acyl-HSL level coincided with the transition to slower growth, as shown by plotting the log OD600 value against time (Fig. 3C, circled data). The increase in acyl-HSL also coincided with an increase in the expression of nwiI and nwiR (Fig. 3A). Interestingly, acyl-HSL production significantly decreased on day 5, followed by an eventual decrease in acyl-HSL concentration on days 8 and 9 (Fig. 3C).
Closer examination of the data showed that expression of nwiI and nwiR was sensitive to growth phase during both batch and chemostat cultures. When cells were growing quickly at low density in batch culture, both genes were expressed at low levels (Fig. 3A). If expression values during slow growth of both chemostat (Td of 1.93 days) and batch (Td of ≈1.75 and 2.20 days, for day 4 and day 6, respectively) cultures are compared to those of low-cell-density batch cultures growing at the maximum growth rate (Td of ≈0.67, day 2 batch culture), both nwiI and nwiR were strongly induced during slow growth (Td ≥ 1.75) (Fig. 4). However, expression of nwiR and nwiI decreased when the Td slowed to 1.93 and 2.2 days, respectively (Fig. 4). These data provided further evidence that N. winogradskyi produces and responds to acyl-HSLs.
FIG 4.

Growth phase- and cell density-dependent gene expression of nwiI and nwiR. Fold change expression (y axis) of nwiI and nwiR relative to that in a batch culture with a Td of 0.67 days (day 2) plotted against Td (x axis). Cell density was measured as the OD600 (right y axis). Tds of 0.67, 1.75, and 2.20 days correspond to batch culture samples harvested on days 2, 4, and 6, respectively. A Td of 1.93 days corresponds to 60 mM NO2− chemostat samples (circled values). Values are the means of three independent biological replicates. Error bars indicate the standard deviations of the means.
Identification of acyl-HSLs by UPLC-IDA-MS.
Acyl-HSLs from N. winogradskyi batch cultures were extracted and concentrated for detection by mass spectrometry. UPLC-IDA-MS analysis of N. winogradskyi supernatant extracts detected two compounds with molecular ions [M+H]+ of m/z 256.1886 and 254.1729, corresponding to N-decanoyl-l-homoserine lactone (C10-HSL) and an unsaturated acyl-HSL, C10:1-HSL (Table 1). Semiquantitative measurement of the intensity of each compound's peak suggested that C10:1-HSL was the predominant autoinducer (Table 1). The compounds were identified as acyl-HSLs by the presence of a high-intensity peak at m/z 102.055 corresponding to the protonated lactone moiety in the extracted-ion chromatogram (XIC) fragmentation pattern spectra. To further confirm the identity of the compounds, the XIC fragmentation pattern from a synthetic C10-HSL standard was compared to that of C10-HSL from N. winogradskyi (Fig. 5A and B, respectively). The two compounds have similar fragmentation patterns, including characteristic [M+H-H2O]+, [M+H-101]+, and [M+H-101-H2O]+ peaks at m/z 238, 155, and 137, respectively (Fig. 5A and B). We were unable to find a C10:1-HSL standard for comparison, but the XIC fragmentation pattern supports our conclusion (Fig. 5C). Peaks at m/z 236, 153, and 135 correspond to [M+H-H2O]+, [M+H-101]+, and [M+H-101-H2O]+, respectively, considering the loss of two H molecules due to the carbon-carbon double bond (C=C) (Fig. 5C). In addition, we identified the position of the C=C bond in the acyl chain between carbon 9 and carbon 10 based on the ion fragmentation model presented in a previous study on unsaturated acyl-HSLs by Cataldi et al. (Fig. 5C, chemical structure) (40). Unfortunately, our analysis was unable to clarify the isomeric form of the C=C bond of C10:1-HSL.
TABLE 1.
Chromatographic and mass spectrometric data of acyl-HSLs identified by UPLC-IDA-MS in extracts from N. winogradskyi batch culture
| Acyl-HSL | Chemical formula | Exact mass (Da) | RT (min)a | [M+H]+ (m/z)b | Error (ppm) | Intensityc |
|---|---|---|---|---|---|---|
| C10-HSL | C14H25NO3 | 255.18344 | 31.5 | 256.1886 | −0.5 | 26,046 |
| C10:1-HSL | C14H23NO3 | 253.16779 | 30.7 | 254.1729 | +0.5 | 242,770 |
RT, retention time.
Experimental m/z values of protonated molecules.
Relative abundance of protonated molecules (unitless).
FIG 5.

UPLC-IDA-MS chromatograms of standards and acyl-HSLs produced by N. winogradskyi. Extracted-ion chromatogram (XIC) fragmentation pattern spectra for protonated molecules ([M+H]+) and chemical structures of synthetic C10-HSL standard (A), C10-HSL extracted from N. winogradskyi culture supernatant (B), and C10:1-HSL extracted from N. winogradskyi culture supernatant (C) are shown. (D) XIC fragmentation pattern spectra and ion currents (inset) for protonated ([M+H]+) oxybrominated acyl-HSL corresponding to the main isotopologues of the bromohydrin of C10:1-HSL. Noise was reduced in all XICs by thresholding and Gaussian smoothing, and mass values were rounded to the nearest whole numbers.
Finally, to further confirm the identity of an unsaturated acyl-HSL, acyl-HSL extracts were treated with bromine aqueous solution and examined by UPLC-IDA-MS. Bromohydrins are readily formed by a water nucleophilic attack to the reactive bridged bromonium ion formed by the reaction of bromine with the C=C bond (40). After bromine treatment, the [M+H]+ m/z of 254.1729 corresponding to C10:1-HSL was not detected, but the corresponding isotopologues and XIC fragmentation pattern of the oxybrominated OHBrC10-HSL were detected (Fig. D). The structure of C10-HSL was unaffected by bromine treatment and was still detected (data not shown). These results further suggest the presence of a C=C double bond in the C10:1-HSL of N. winogradskyi.
DISCUSSION
Evolutionary history of autoinducer synthases in Rhizobiales suggests a functional split into four clades.
Previous analysis of autoinducer synthase evolutionary history has focused on broad surveys of all known LuxI and QS-related LuxR homologs, and phylogenetic comparison has been unable to predict what acyl-HSL is synthesized (53–55). Our phylogenetic analysis was focused on comparing NwiI and NwiR with their orthologues in QS-proficient Rhizobiales. Our analysis identified four potential clades of autoinducer synthases in the Rhizobiales, with clade 1 and clade 2 being sister clades (Fig. 1). Clade 2 is the best-supported clade, both by bootstrap values and function, with all Bradyrhizobium and R. palustris strains producing unusual aryl-HSLs or isovaleryl-HSLs (44–47). With the inclusion of our data, clade 1 includes two characterized members (N. winogradskyi and M. extorquens) that produce unsaturated acyl-HSLs, a possible discriminatory characteristic of this clade (41). Production of unsaturated acyl-HSLs by N. winogradskyi may simply be the result of a larger than usual pool of unsaturated fatty acids. N. winogradskyi contains a complex membrane system, and when its fatty acid methyl ester (FAME) profile was analyzed, greater than 90% of the pool was unsaturated (see Table S1 in the supplemental material). Our phylogenetic analysis also suggests that N. hamburgensis has been the recipient of horizontal gene transfer events since it contains three autoinducer synthases in two different clades, including a homolog to the classic TraI/R conjugation system on one of its large plasmids (43, 55).
Cell density- and growth phase-dependent expression is a marker of acyl-HSL QS systems.
Our results add to a large body of work suggesting that induction of many acyl-HSL QS systems is both cell density and growth phase dependent (13). Although NOB are generally found at low cell densities in soils (105 to 5 × 10⁵ nxrA copies g−1) (56, 57), heterogeneous spatial distribution and restricted diffusion under unsaturated soil conditions could, in fact, permit autoinducers to reach effective localized concentrations (11). Indeed, our experiments confirmed that the QS system of N. winogradskyi was induced at a cell density of approximately 3.2 ×10⁶ cells ml−1 during batch culture (Fig. 3B).
Our data also suggest that the amount of acyl-HSL produced per cell is affected by both cell density and growth phase. For example, the chemostat experiments suggest that acyl-HSL production is highest at a medium cell density (OD600 of 0.0119) corresponding with a Td of 1.93 days (Fig. 2C). A similar result was observed during batch culture on day 4, when the Td of the culture was ≈1.75 days (Fig. 3C). Equally intriguing is the sharp decrease in production and concentration of acyl-HSL when cells enter deep stationary phase (Fig. 3C, days 5 to 9). This growth phase-dependent decrease in acyl-HSL resembles the las system in Pseudomonas aeruginosa where the production and concentration of the autoinducer 3-oxo-C12-HSL decrease during slow growth (14). Both studies may hint at biotic degradation of acyl-HSL via production of acylase or lactonase, similar to the phenomenon observed in the AOB Nitrosospira multiformis, especially since abiotic decay due to pH was negligible (19, 58–60).
Expression of nwiI and nwiR lends support to the hypothesis that QS-controlled genes in N. winogradskyi are tuned for expression during a specific phase of growth between the exponential and stationary phases. While expression of nwiI is cell density dependent during both the exponential and early stationary phase of growth (Td ≤ 1.93 days), nwiR expression is much more sensitive to growth phase and decreases when growth is slower than a Td of 1.75 days (Fig. 4). The expression of nwiI and production of acyl-HSL decreased after this growth phase transition following the decrease in expression of nwiR (Fig. 3C and 4). Differences in expression levels of nwiI and nwiR suggest that, like many LuxI/R QS systems, the transcriptional regulation of these genes is complex (10, 61–63). Precisely timed expression of nwiR during and after a transition to slow growth is likely critical for QS-controlled gene expression, but further studies are needed to identify QS-regulated genes.
Gene induction studies in Pseudomonas aeruginosa have shown that signal integration from nutrient starvation, induction of RpoS (a stationary-phase sigma factor) and the stringent response, and cell density-dependent autoinducer accumulation is necessary for induction of QS-controlled genes (14, 35, 64, 65). QS genes from members of the Rhizobiales, such as R. palustris, Sinorhizobium meliloti, A. tumefaciens, and M. extorquens, generally respond to nutrient presence or deprivation (13, 41, 45, 52, 66). Similarly, the highest production of acyl-HSL in N. winogradskyi was measured during a transition to slow growth.
The role of QS in N. winogradskyi and other nitrifying bacteria.
A coupled acyl-HSL synthase and receptor in the genome, without the presence of an orphan or solo LuxR homolog, suggests a within-species function for QS in N. winogradskyi (67). However, the lack of a genetic system in N. winogradskyi could hamper efforts to precisely determine a phenotype. One interesting phenotype that coincides with acyl-HSL production is the reduction in growth rate during batch culture, despite the presence of approximately 40 mM NO2−, which is >120-fold more than the half-saturation constant, Ks, for NO2− (0.309 mM) reported by Nowka et al. (see Fig. S1 in the supplemental material) (68). This observation suggests that a possible within-species function of the QS regulon in N. winogradskyi is to control central metabolism and stress response genes to prepare the organism for either higher cell densities or NO2− limitation (69). N. winogradskyi and other nitrifying bacteria commonly form complex biofilm communities in the environment, and this may be another role for QS (70). One other potential role for QS is control of chemotaxis, similar to that in R. palustris (45). Of course, these possible roles for QS remain to be tested in N. winogradskyi and other nitrifying bacteria.
Acyl-HSL QS presents an attractive model for interspecies cell-cell communication between nitrifying bacteria in the natural environment, and some evidence of this phenomenon may already exist. Nitrosomonas europaea, one of the possible AOB partners of N. winogradskyi, has shown a cell density-dependent recovery from starvation and produces C10-HSL (17, 18), one of the same autoinducers as N. winogradskyi, via a candidate hdtS gene (71, 72). Nitrosospira multiformis, another AOB, also has the capacity to produce acyl-HSLs (19). Genomic evidence suggests that N. hamburgensis also can potentially produce acyl-HSLs, but signals were not detected by bioassay under the same growth conditions used for N. winogradskyi (data not shown). We cannot rule out the possibility that the broad-range bioassay may not be able to detect autoinducers produced by the LuxI homologs of N. hamburgensis or that acyl-HSLs may be produced under different growth conditions. There is metagenomic evidence that other NOB may produce acyl-HSLs (20), but a broad survey of acyl-HSL production by AOB and NOB is necessary to establish if acyl-HSL production is ubiquitous in environmental nitrifying bacteria, particularly when they are actively growing together in coculture. Future transcriptome analyses of N. winogradskyi, possibly by measuring transcriptome changes in response to autoinducer addition or depletion, may shed light on the purpose of QS in this NOB.
Supplementary Material
ACKNOWLEDGMENTS
We thank Kristin Trippe for providing the C10-HSL standard, Jeffrey Morré for mass spectrometry expertise, Michael Dobie for testing signal production in N. hamburgensis, and Aidan Maxwell and Taylor Barnes for laboratory assistance. We also thank Aidan Maxwell, Taylor Barnes, Neeraja Vajrala, Anne Taylor, Andrew Giguere, Michael Dobie, Alija Mujic, and Derek Johnson for helpful advice.
This work was supported by a Department of Energy (DOE) award ER65192 (co-principal investigators, L.A.S.-S. and P.J.B.). The mass spectrometry performed in this project was supported, in part, by award number P30ES000210 from the National Institute of Environmental Health Sciences (NIEHS) and National Institutes of Health (NIH). The authors acknowledge the Biomolecular Mass Spectrometry Core of the Environmental Health Sciences Core Center at Oregon State University.
Opinions, findings, conclusions, or recommendations expressed in this material are those of the author(s) and do not necessarily reflect the views of the DOE, NIEHS, or NIH.
Footnotes
Supplemental material for this article may be found at http://dx.doi.org/10.1128/AEM.01103-15.
REFERENCES
- 1.Ward BB. 2011. Nitrification: an introduction and overview of the state of the field, p 3–8. In Ward BB, Arp DJ, Klotz MG (ed), Nitrification. ASM Press, Washington, DC. [Google Scholar]
- 2.Sayavedra-Soto LA, Arp DJ. 2011. Ammonia-oxidizing bacteria: their biochemistry and molecular biology, p 11–37. In Ward BB, Arp DJ, Klotz MG (ed), Nitrification. ASM Press, Washington, DC. [Google Scholar]
- 3.Starkenburg SR, Spieck E, Bottomley PJ. 2011. Metabolism and genomics of nitrite-oxidizing bacteria: emphasis on studies of pure cultures and of Nitrobacter species, p 267–293. In Ward BB, Arp DJ, Klotz MG (ed), Nitrification. ASM Press, Washington, DC. [Google Scholar]
- 4.Daims H, Lucker S, Paslier DL, Wagner M. 2011. Diversity, environmental genomics, and ecophysiology of nitrite-oxidizing bacteria, p 295–322. In Ward BB, Arp DJ, Klotz MG (ed), Nitrification. ASM Press, Washington, DC. [Google Scholar]
- 5.Casciotti KL, Buchwald C. 2012. Insights on the marine microbial nitrogen cycle from isotopic approaches to nitrification. Front Microbiol 3:356. doi: 10.3389/fmicb.2012.00356. [DOI] [PMC free article] [PubMed] [Google Scholar]
- 6.Grundmann GL, Dechesne A, Bartoli F, Flandrois JP, Chasse JL, Kizungu R. 2001. Spatial modeling of nitrifier microhabitats in soil. Soil Sci Soc Am J 65:1709–1716. doi: 10.2136/sssaj2001.1709. [DOI] [Google Scholar]
- 7.Rice CW, Smith MS. 1983. Nitrification of fertilizer and mineralized ammonium in no-till and plowed soil. Soil Sci Soc Am J 47:1125–1129. doi: 10.2136/sssaj1983.03615995004700060013x. [DOI] [Google Scholar]
- 8.Shen QR, Ran W, Cao ZH. 2003. Mechanisms of nitrite accumulation occurring in soil nitrification. Chemosphere 50:747–753. doi: 10.1016/S0045-6535(02)00215-1. [DOI] [PubMed] [Google Scholar]
- 9.Robertson GP. 1997. Nitrogen use efficiency in row-crop agriculture: crop nitrogen use and soil nitrogen loss, p 347–365. In Jackson LE. (ed), Ecology in agriculture. Academic Press, San Diego, CA. [Google Scholar]
- 10.Waters CM, Bassler BL. 2005. Quorum sensing: cell-to-cell communication in bacteria. Annu Rev Cell Dev Biol 21:319–346. doi: 10.1146/annurev.cellbio.21.012704.131001. [DOI] [PubMed] [Google Scholar]
- 11.Hense BA, Kuttler C, Muller J, Rothballer M, Hartmann A, Kreft JU. 2007. Does efficiency sensing unify diffusion and quorum sensing? Nat Rev Microbiol 5:230–239. doi: 10.1038/nrmicro1600. [DOI] [PubMed] [Google Scholar]
- 12.Hense BA, Schuster M. 2015. Core principles of bacterial autoinducer systems. Microbiol Mol Biol Rev 79:153–169. doi: 10.1128/MMBR.00024-14. [DOI] [PMC free article] [PubMed] [Google Scholar]
- 13.Mellbye B, Schuster M. 2011. More than just a quorum: integration of stress and other environmental cues in acyl-homoserine lactone signaling networks, p 349–363. In Storz G, Hengge R (ed), Bacterial stress responses, 2nd ed ASM Press, Washington, DC. [Google Scholar]
- 14.Mellbye B, Schuster M. 2014. Physiological framework for the regulation of quorum sensing-dependent public goods in Pseudomonas aeruginosa. J Bacteriol 196:1155–1164. doi: 10.1128/JB.01223-13. [DOI] [PMC free article] [PubMed] [Google Scholar]
- 15.Ng WL, Bassler BL. 2009. Bacterial quorum-sensing network architectures. Annu Rev Genet 43:197–222. doi: 10.1146/annurev-genet-102108-134304. [DOI] [PMC free article] [PubMed] [Google Scholar]
- 16.Schuster M, Sexton DJ, Diggle SP, Greenberg EP. 2013. Acyl-homoserine lactone quorum sensing: from evolution to application. Annu Rev Microbiol 67:43–63. doi: 10.1146/annurev-micro-092412-155635. [DOI] [PubMed] [Google Scholar]
- 17.Batchelor SE, Cooper M, Chhabra SR, Glover LA, Stewart GS, Williams P, Prosser JI. 1997. Cell density-regulated recovery of starved biofilm populations of ammonia-oxidizing bacteria. Appl Environ Microbiol 63:2281–2286. [DOI] [PMC free article] [PubMed] [Google Scholar]
- 18.Burton EO, Read HW, Pellitteri MC, Hickey WJ. 2005. Identification of acyl-homoserine lactone signal molecules produced by Nitrosomonas europaea strain Schmidt. Appl Environ Microbiol 71:4906–4909. doi: 10.1128/AEM.71.8.4906-4909.2005. [DOI] [PMC free article] [PubMed] [Google Scholar]
- 19.Gao J, Ma A, Zhuang X, Zhuang G. 2014. An N-acyl homoserine lactone synthase in the ammonia-oxidizing bacterium Nitrosospira multiformis. Appl Environ Microbiol 80:951–958. doi: 10.1128/AEM.03361-13. [DOI] [PMC free article] [PubMed] [Google Scholar]
- 20.Nasuno E, Kimura N, Fujita MJ, Nakatsu CH, Kamagata Y, Hanada S. 2012. Phylogenetically novel LuxI/LuxR-type quorum sensing systems isolated using a metagenomic approach. Appl Environ Microbiol 78:8067–8074. doi: 10.1128/AEM.01442-12. [DOI] [PMC free article] [PubMed] [Google Scholar]
- 21.De Clippeleir H, Defoirdt T, Vanhaecke L, Vlaeminck SE, Carballa M, Verstraete W, Boon N. 2011. Long-chain acylhomoserine lactones increase the anoxic ammonium oxidation rate in an OLAND biofilm. Appl Microbiol Biotechnol 90:1511–1519. doi: 10.1007/s00253-011-3177-7. [DOI] [PubMed] [Google Scholar]
- 22.Tang X, Liu S, Zhang Z, Zhuang G. 2015. Identification of the release and effects of AHLs in anammox culture for bacteria communication. Chem Eng J 273:184–191. doi: 10.1016/j.cej.2015.03.045. [DOI] [Google Scholar]
- 23.Starkenburg SR, Chain PS, Sayavedra-Soto LA, Hauser L, Land ML, Larimer FW, Malfatti SA, Klotz MG, Bottomley PJ, Arp DJ, Hickey WJ. 2006. Genome sequence of the chemolithoautotrophic nitrite-oxidizing bacterium Nitrobacter winogradskyi Nb-255. Appl Environ Microbiol 72:2050–2063. doi: 10.1128/AEM.72.3.2050-2063.2006. [DOI] [PMC free article] [PubMed] [Google Scholar]
- 24.Sayavedra-Soto LA, Ferrell R, Dobie M, Mellbye B, Chaplen F, Buchanan A, Chang JH, Bottomley PJ, Arp DJ. 2015. Nitrobacter winogradskyi transcriptomic response to low and high ammonium concentrations. FEMS Microbiol Lett 362:1–7. doi: 10.1093/femsle/fnu040. [DOI] [PubMed] [Google Scholar]
- 25.Zhu J, Chai Y, Zhong Z, Li S, Winans SC. 2003. Agrobacterium bioassay strain for ultrasensitive detection of N-acylhomoserine lactone-type quorum-sensing molecules: detection of autoinducers in Mesorhizobium huakuii. Appl Environ Microbiol 69:6949–6953. doi: 10.1128/AEM.69.11.6949-6953.2003. [DOI] [PMC free article] [PubMed] [Google Scholar]
- 26.Joelsson AC, Zhu J. 2006. LacZ-based detection of acyl-homoserine lactone quorum-sensing signals. Curr Protoc Microbiol Chapter 1:Unit 1C.2. doi: 10.1002/9780471729259.mc01c02s3. [DOI] [PubMed] [Google Scholar]
- 27.Kanehisa M, Goto S. 2000. KEGG: Kyoto encyclopedia of genes and genomes. Nucleic Acids Res 28:27–30. doi: 10.1093/nar/28.1.27. [DOI] [PMC free article] [PubMed] [Google Scholar]
- 28.Boratyn GM, Camacho C, Cooper PS, Coulouris G, Fong A, Ma N, Madden TL, Matten WT, McGinnis SD, Merezhuk Y, Raytselis Y, Sayers EW, Tao T, Ye J, Zaretskaya I. 2013. BLAST: a more efficient report with usability improvements. Nucleic Acids Res 41:W29–W33. doi: 10.1093/nar/gkt282. [DOI] [PMC free article] [PubMed] [Google Scholar]
- 29.Edgar RC. 2004. MUSCLE: a multiple sequence alignment method with reduced time and space complexity. BMC Bioinformatics 5:113. doi: 10.1186/1471-2105-5-113. [DOI] [PMC free article] [PubMed] [Google Scholar]
- 30.Edgar RC. 2004. MUSCLE: multiple sequence alignment with high accuracy and high throughput. Nucleic Acids Res 32:1792–1797. doi: 10.1093/nar/gkh340. [DOI] [PMC free article] [PubMed] [Google Scholar]
- 31.Tamura K, Stecher G, Peterson D, Filipski A, Kumar S. 2013. MEGA6: molecular evolutionary genetics analysis version 6.0. Mol Biol Evol 30:2725–2729. doi: 10.1093/molbev/mst197. [DOI] [PMC free article] [PubMed] [Google Scholar]
- 32.Le SQ, Gascuel O. 2008. An improved general amino acid replacement matrix. Mol Biol Evol 25:1307–1320. doi: 10.1093/molbev/msn067. [DOI] [PubMed] [Google Scholar]
- 33.Perez J, Buchanan A, Mellbye B, Ferrell R, Chang JH, Chaplen F, Bottomley PJ, Arp DJ, Sayavedra-Soto LA. 2015. Interactions of Nitrosomonas europaea and Nitrobacter winogradskyi grown in co-culture. Arch Microbiol 197:79–89. doi: 10.1007/s00203-014-1056-1. [DOI] [PubMed] [Google Scholar]
- 34.Hood-Nowotny R, Umana NH-N, Inselbacher E, Oswald-Lachouani P, Wanek W. 2010. Alternative methods for measuring inorganic, organic, and total dissolved nitrogen in soil. Soil Sci Soc Am J 74:1018–1027. doi: 10.2136/sssaj2009.0389. [DOI] [Google Scholar]
- 35.Schuster M, Lostroh CP, Ogi T, Greenberg EP. 2003. Identification, timing, and signal specificity of Pseudomonas aeruginosa quorum-controlled genes: a transcriptome analysis. J Bacteriol 185:2066–2079. doi: 10.1128/JB.185.7.2066-2079.2003. [DOI] [PMC free article] [PubMed] [Google Scholar]
- 36.Ruijter JM, Ramakers C, Hoogaars WM, Karlen Y, Bakker O, van den Hoff MJ, Moorman AF. 2009. Amplification efficiency: linking baseline and bias in the analysis of quantitative PCR data. Nucleic Acids Res 37:e45. doi: 10.1093/nar/gkp045. [DOI] [PMC free article] [PubMed] [Google Scholar]
- 37.Pearson JP, Gray KM, Passador L, Tucker KD, Eberhard A, Iglewski BH, Greenberg EP. 1994. Structure of the autoinducer required for expression of Pseudomonas aeruginosa virulence genes. Proc Natl Acad Sci U S A 91:197–201. doi: 10.1073/pnas.91.1.197. [DOI] [PMC free article] [PubMed] [Google Scholar]
- 38.Zhu J, Beaber JW, More MI, Fuqua C, Eberhard A, Winans SC. 1998. Analogs of the autoinducer 3-oxooctanoyl-homoserine lactone strongly inhibit activity of the TraR protein of Agrobacterium tumefaciens. J Bacteriol 180:5398–5405. [DOI] [PMC free article] [PubMed] [Google Scholar]
- 39.Purohit AA, Johansen JA, Hansen H, Leiros HK, Kashulin A, Karlsen C, Smalas A, Haugen P, Willassen NP. 2013. Presence of acyl-homoserine lactones in 57 members of the Vibrionaceae family. J Appl Microbiol 115:835–847. doi: 10.1111/jam.12264. [DOI] [PMC free article] [PubMed] [Google Scholar]
- 40.Cataldi TR, Bianco G, Abate S, Losito I. 2011. Identification of unsaturated N-acylhomoserine lactones in bacterial isolates of Rhodobacter sphaeroides by liquid chromatography coupled to electrospray ionization-hybrid linear ion trap-Fourier transform ion cyclotron resonance mass spectrometry. Rapid Commun Mass Spectrom 25:1817–1826. doi: 10.1002/rcm.5054. [DOI] [PubMed] [Google Scholar]
- 41.Nieto Penalver CG, Morin D, Cantet F, Saurel O, Milon A, Vorholt JA. 2006. Methylobacterium extorquens AM1 produces a novel type of acyl-homoserine lactone with a double unsaturated side chain under methylotrophic growth conditions. FEBS Lett 580:561–567. doi: 10.1016/j.febslet.2005.12.062. [DOI] [PubMed] [Google Scholar]
- 42.Poonguzhali S, Madhaiyan M, Sa T. 2007. Production of acyl-homoserine lactone quorum-sensing signals is widespread in gram-negative Methylobacterium. J Microbiol Biotechnol 17:226–233. [PubMed] [Google Scholar]
- 43.Starkenburg SR, Larimer FW, Stein LY, Klotz MG, Chain PS, Sayavedra-Soto LA, Poret-Peterson AT, Gentry ME, Arp DJ, Ward B, Bottomley PJ. 2008. Complete genome sequence of Nitrobacter hamburgensis X14 and comparative genomic analysis of species within the genus Nitrobacter. Appl Environ Microbiol 74:2852–2863. doi: 10.1128/AEM.02311-07. [DOI] [PMC free article] [PubMed] [Google Scholar]
- 44.Oda Y, Larimer FW, Chain PS, Malfatti S, Shin MV, Vergez LM, Hauser L, Land ML, Braatsch S, Beatty JT, Pelletier DA, Schaefer AL, Harwood CS. 2008. Multiple genome sequences reveal adaptations of a phototrophic bacterium to sediment microenvironments. Proc Natl Acad Sci U S A 105:18543–18548. doi: 10.1073/pnas.0809160105. [DOI] [PMC free article] [PubMed] [Google Scholar]
- 45.Schaefer AL, Greenberg EP, Oliver CM, Oda Y, Huang JJ, Bittan-Banin G, Peres CM, Schmidt S, Juhaszova K, Sufrin JR, Harwood CS. 2008. A new class of homoserine lactone quorum-sensing signals. Nature 454:595–599. doi: 10.1038/nature07088. [DOI] [PubMed] [Google Scholar]
- 46.Ahlgren NA, Harwood CS, Schaefer AL, Giraud E, Greenberg EP. 2011. Aryl-homoserine lactone quorum sensing in stem-nodulating photosynthetic bradyrhizobia. Proc Natl Acad Sci U S A 108:7183–7188. doi: 10.1073/pnas.1103821108. [DOI] [PMC free article] [PubMed] [Google Scholar]
- 47.Lindemann A, Pessi G, Schaefer AL, Mattmann ME, Christensen QH, Kessler A, Hennecke H, Blackwell HE, Greenberg EP, Harwood CS. 2011. Isovaleryl-homoserine lactone, an unusual branched-chain quorum-sensing signal from the soybean symbiont Bradyrhizobium japonicum. Proc Natl Acad Sci U S A 108:16765–16770. doi: 10.1073/pnas.1114125108. [DOI] [PMC free article] [PubMed] [Google Scholar]
- 48.Marketon MM, Gronquist MR, Eberhard A, Gonzalez JE. 2002. Characterization of the Sinorhizobium meliloti sinR/sinI locus and the production of novel N-acyl homoserine lactones. J Bacteriol 184:5686–5695. doi: 10.1128/JB.184.20.5686-5695.2002. [DOI] [PMC free article] [PubMed] [Google Scholar]
- 49.Puskas A, Greenberg EP, Kaplan S, Schaefer AL. 1997. A quorum-sensing system in the free-living photosynthetic bacterium Rhodobacter sphaeroides. J Bacteriol 179:7530–7537. [DOI] [PMC free article] [PubMed] [Google Scholar]
- 50.Savka MA, Le PT, Burr TJ. 2011. LasR receptor for detection of long-chain quorum-sensing signals: identification of N-acyl-homoserine lactones encoded by the avsI locus of Agrobacterium vitis. Curr Microbiol 62:101–110. doi: 10.1007/s00284-010-9679-1. [DOI] [PubMed] [Google Scholar]
- 51.Lithgow JK, Wilkinson A, Hardman A, Rodelas B, Wisniewski-Dye F, Williams P, Downie JA. 2000. The regulatory locus cinRI in Rhizobium leguminosarum controls a network of quorum-sensing loci. Mol Microbiol 37:81–97. doi: 10.1046/j.1365-2958.2000.01960.x. [DOI] [PubMed] [Google Scholar]
- 52.White CE, Winans SC. 2007. Cell-cell communication in the plant pathogen Agrobacterium tumefaciens. Philos Trans R Soc Lond B Biol Sci 362:1135–1148. doi: 10.1098/rstb.2007.2040. [DOI] [PMC free article] [PubMed] [Google Scholar]
- 53.Lerat E, Moran NA. 2004. The evolutionary history of quorum-sensing systems in bacteria. Mol Biol Evol 21:903–913. doi: 10.1093/molbev/msh097. [DOI] [PubMed] [Google Scholar]
- 54.Case RJ, Labbate M, Kjelleberg S. 2008. AHL-driven quorum-sensing circuits: their frequency and function among the Proteobacteria. ISME J 2:345–349. doi: 10.1038/ismej.2008.13. [DOI] [PubMed] [Google Scholar]
- 55.Williams P, Winzer K, Chan WC, Camara M. 2007. Look who's talking: communication and quorum sensing in the bacterial world. Philos Trans R Soc Lond B Biol Sci 362:1119–1134. doi: 10.1098/rstb.2007.2039. [DOI] [PMC free article] [PubMed] [Google Scholar]
- 56.Attard E, Poly F, Commeaux C, Laurent F, Terada A, Smets BF, Recous S, Roux XL. 2010. Shifts between Nitrospira- and Nitrobacter-like nitrite oxidizers underlie the response of soil potential nitrite oxidation to changes in tillage practices. Environ Microbiol 12:315–326. doi: 10.1111/j.1462-2920.2009.02070.x. [DOI] [PubMed] [Google Scholar]
- 57.Placella SA, Firestone MK. 2013. Transcriptional response of nitrifying communities to wetting of dry soil. Appl Environ Microbiol 79:3294–3302. doi: 10.1128/AEM.00404-13. [DOI] [PMC free article] [PubMed] [Google Scholar]
- 58.Yates EA, Philipp B, Buckley C, Atkinson S, Chhabra SR, Sockett RE, Goldner M, Dessaux Y, Camara M, Smith H, Williams P. 2002. N-acylhomoserine lactones undergo lactonolysis in a pH-, temperature-, and acyl chain length-dependent manner during growth of Yersinia pseudotuberculosis and Pseudomonas aeruginosa. Infect Immun 70:5635–5646. doi: 10.1128/IAI.70.10.5635-5646.2002. [DOI] [PMC free article] [PubMed] [Google Scholar]
- 59.Roche DM, Byers JT, Smith DS, Glansdorp FG, Spring DR, Welch M. 2004. Communications blackout? Do N-acylhomoserine-lactone-degrading enzymes have any role in quorum sensing? Microbiology 150:2023–2028. [DOI] [PubMed] [Google Scholar]
- 60.Wahjudi M, Papaioannou E, Hendrawati O, van Assen AH, van Merkerk R, Cool RH, Poelarends GJ, Quax WJ. 2011. PA0305 of Pseudomonas aeruginosa is a quorum quenching acylhomoserine lactone acylase belonging to the Ntn hydrolase superfamily. Microbiology 157:2042–2055. doi: 10.1099/mic.0.043935-0. [DOI] [PubMed] [Google Scholar]
- 61.Fuqua C, Winans SC, Greenberg EP. 1996. Census and consensus in bacterial ecosystems: the LuxR-LuxI family of quorum-sensing transcriptional regulators. Annu Rev Microbiol 50:727–751. doi: 10.1146/annurev.micro.50.1.727. [DOI] [PubMed] [Google Scholar]
- 62.Siehnel R, Traxler B, An DD, Parsek MR, Schaefer AL, Singh PK. 2010. A unique regulator controls the activation threshold of quorum-regulated genes in Pseudomonas aeruginosa. Proc Natl Acad Sci U S A 107:7916–7921. doi: 10.1073/pnas.0908511107. [DOI] [PMC free article] [PubMed] [Google Scholar]
- 63.Hirakawa H, Harwood CS, Pechter KB, Schaefer AL, Greenberg EP. 2012. Antisense RNA that affects Rhodopseudomonas palustris quorum-sensing signal receptor expression. Proc Natl Acad Sci U S A 109:12141–12146. doi: 10.1073/pnas.1200243109. [DOI] [PMC free article] [PubMed] [Google Scholar]
- 64.Schuster M, Hawkins AC, Harwood CS, Greenberg EP. 2004. The Pseudomonas aeruginosa RpoS regulon and its relationship to quorum sensing. Mol Microbiol 51:973–985. doi: 10.1046/j.1365-2958.2003.03886.x. [DOI] [PubMed] [Google Scholar]
- 65.Schafhauser J, Lepine F, McKay G, Ahlgren HG, Khakimova M, Nguyen D. 2014. The stringent response modulates 4-hydroxy-2-alkylquinoline biosynthesis and quorum-sensing hierarchy in Pseudomonas aeruginosa. J Bacteriol 196:1641–1650. doi: 10.1128/JB.01086-13. [DOI] [PMC free article] [PubMed] [Google Scholar]
- 66.McIntosh M, Meyer S, Becker A. 2009. Novel Sinorhizobium meliloti quorum sensing positive and negative regulatory feedback mechanisms respond to phosphate availability. Mol Microbiol 74:1238–1256. doi: 10.1111/j.1365-2958.2009.06930.x. [DOI] [PubMed] [Google Scholar]
- 67.Subramoni S, Venturi V. 2009. LuxR-family “solos”: bachelor sensors/regulators of signalling molecules. Microbiology 155:1377–1385. doi: 10.1099/mic.0.026849-0. [DOI] [PubMed] [Google Scholar]
- 68.Nowka B, Daims H, Spieck E. 2015. Comparison of oxidation kinetics of nitrite-oxidizing bacteria: nitrite availability as a key factor in niche differentiation. Appl Environ Microbiol 81:745–753. doi: 10.1128/AEM.02734-14. [DOI] [PMC free article] [PubMed] [Google Scholar]
- 69.Goo E, Majerczyk CD, An JH, Chandler JR, Seo YS, Ham H, Lim JY, Kim H, Lee B, Jang MS, Greenberg EP, Hwang I. 2012. Bacterial quorum sensing, cooperativity, and anticipation of stationary-phase stress. Proc Natl Acad Sci U S A 109:19775–19780. doi: 10.1073/pnas.1218092109. [DOI] [PMC free article] [PubMed] [Google Scholar]
- 70.Mobarry BK, Wagner M, Urbain V, Rittmann BE, Stahl DA. 1996. Phylogenetic probes for analyzing abundance and spatial organization of nitrifying bacteria. Appl Environ Microbiol 62:2156–2162. (Erratum, 63:815, 1997.) [DOI] [PMC free article] [PubMed] [Google Scholar]
- 71.Laue BE, Jiang Y, Chhabra SR, Jacob S, Stewart GS, Hardman A, Downie JA, O'Gara F, Williams P. 2000. The biocontrol strain Pseudomonas fluorescens F113 produces the Rhizobium small bacteriocin, N-(3-hydroxy-7-cis-tetradecenoyl)homoserine lactone, via HdtS, a putative novel N-acylhomoserine lactone synthase. Microbiology 146:2469–2480. [DOI] [PubMed] [Google Scholar]
- 72.Chain P, Lamerdin J, Larimer F, Regala W, Lao V, Land M, Hauser L, Hooper A, Klotz M, Norton J, Sayavedra-Soto L, Arciero D, Hommes N, Whittaker M, Arp D. 2003. Complete genome sequence of the ammonia-oxidizing bacterium and obligate chemolithoautotroph Nitrosomonas europaea. J Bacteriol 185:2759–2773. (Erratum, 185:6496.) [DOI] [PMC free article] [PubMed] [Google Scholar]
Associated Data
This section collects any data citations, data availability statements, or supplementary materials included in this article.