

MEX-5/6 and PIE-1 form opposing concentration gradients in the cytoplasm of the Caenorhabditis elegans zygote. MEX-5/6 act in a concentration-dependent manner to increase GFP::PIE-1 mobility, suggesting direct coupling between the MEX-5/6 gradients and the formation of the PIE-1 gradient via the formation of a PIE-1 diffusion gradient.
Abstract
Cell polarity is characterized by the asymmetric distribution of factors at the cell cortex and in the cytoplasm. Although mechanisms that establish cortical asymmetries have been characterized, less is known about how persistent cytoplasmic asymmetries are generated. During the asymmetric division of the Caenorhabditis elegans zygote, the PAR proteins orchestrate the segregation of the cytoplasmic RNA-binding proteins MEX-5/6 to the anterior cytoplasm and PIE-1, POS-1, and MEX-1 to the posterior cytoplasm. In this study, we find that MEX-5/6 control the segregation of GFP::PIE-1, GFP::POS-1, and GFP::MEX-1 by locally increasing their mobility in the anterior cytoplasm. Remarkably, PIE-1, POS-1, and MEX-1 form gradients with distinct strengths, which correlates with differences in their responsiveness to MEX-5/6. We show that MEX-5/6 act downstream of the polarity regulators PAR-1 and PAR-3 and in a concentration-dependent manner to increase the mobility of GFP::PIE-1. These findings suggest that the MEX-5/6 concentration gradients are directly coupled to the establishment of posterior-rich PIE-1, POS-1, and MEX-1 concentration gradients via the formation of anterior-fast, posterior-slow mobility gradients.
INTRODUCTION
Cell polarity is fundamental to the biology of most cells and is characterized by the asymmetric distribution of factors at the cell cortex and in the cytoplasm. The PAR (partitioning defective) proteins are broadly conserved polarity regulators that concentrate at the cortex of polarized cells and control the segregation of both cortical and cytoplasmic factors (Kemphues, 2000; Goldstein and Macara, 2007; Nance and Zallen, 2011). Although mechanisms by which the PAR proteins establish cortical asymmetries have been characterized, relatively little is known about how they control the formation of precise and stable cytoplasmic asymmetries.
The Caenorhabditis elegans zygote provides a powerful system in which to characterize the mechanisms that generate cytoplasmic asymmetries. Upon the completion of meiosis, the zygote initiates an ∼10 min polarization process, during which a collection of maternally deposited cytoplasmic factors are partitioned along the anterior/posterior (A/P) axis. The similar tandem CCCH zinc finger (TZF) RNA-binding proteins MEX-5 and MEX-6 (MEX-5/6 hereafter) redistribute to form anterior-high, posterior-low cytoplasmic concentration gradients (Schubert et al., 2000; Tenlen et al., 2008; Daniels et al., 2010; Griffin et al., 2011). Concurrently a number of cytoplasmic factors, collectively called the germ plasm, become enriched in the posterior cytoplasm (Updike and Strome, 2010; Wang and Seydoux, 2013). The germ plasm includes nonmembranous ribonucleotide organelles called P granules, as well as three TZF RNA-binding proteins, PIE-1, POS-1, and MEX-1, which concentrate diffusely in the posterior cytoplasm and weakly on P granules (Strome and Wood, 1982; Mello et al., 1996; Guedes and Priess, 1997; Tenenhaus et al., 1998; Tabara et al., 1999; Ogura et al., 2003; Updike and Strome, 2010; Wang and Seydoux, 2013). The zygote divides ∼20 min after the completion of meiosis, leading to the preferential inheritance of MEX-5/6 by the anterior daughter cell and the germ plasm by the posterior daughter cell. As a result of the asymmetric inheritance of these factors, the anterior and posterior blastomeres adopt distinct somatic and germline identities, respectively (Sulston et al., 1983; Rose and Kemphues, 1998; Wang and Seydoux, 2013).
The partitioning of factors in the zygotic cytoplasm is controlled by the PAR proteins. During polarity establishment, the anterior PARs (the PDZ proteins PAR-3, PAR-6, and the aPKC kinase PKC-3) become enriched at the anterior cortex, and the posterior PARs (the kinase PAR-1 and the RING-finger protein PAR-2) become enriched at the posterior cortex (Etemad-Moghadam et al., 1995; Guo and Kemphues, 1995; Boyd et al., 1996; Watts et al., 1996; Tabuse et al., 1998). MEX-5/6, PIE-1, POS-1, and MEX-1 are symmetrically distributed in par-mutant embryos (Tenenhaus et al., 1998; Schubert et al., 2000; Cuenca et al., 2003; Ogura et al., 2003). Studies of fluorescently tagged MEX-5 have shown that differential mobility along the A/P axis underlies the segregation of MEX-5 to the anterior cytoplasm. PAR-1 phosphorylates MEX-5 and acts to increase MEX-5 mobility in the posterior cytoplasm (Tenlen et al., 2008; Griffin et al., 2011). Uniformly distributed PP2A phosphatase counteracts the increase in MEX-5 mobility by PAR-1, resulting in relatively low mobility of MEX-5 in the anterior cytoplasm (Schlaitz et al., 2007; Griffin et al., 2011). As a consequence of the differential in MEX-5 mobility along the A/P axis, MEX-5 is preferentially retained in the anterior cytoplasm, forming a persistent threefold concentration gradient that spans the A/P axis (Tenlen et al., 2008; Daniels et al., 2010; Griffin et al., 2011).
MEX-5/6 are required downstream of PAR polarity to control PIE-1, POS-1, and MEX-1 segregation. In mex-5/6 mutant embryos, PIE-1, POS-1, and MEX-1 remain symmetrically distributed even though most mex-5/6 mutant embryos establish polarized PAR domains (Schubert et al., 2000; Cuenca et al., 2003). MEX-5's role in segregating PIE-1 and POS-1 depends on MEX-5 phosphorylation by the kinase MBK-2, which is activated at the completion of meiosis (Pellettieri and Seydoux, 2003; Quintin et al., 2003; Pang et al., 2004; Nishi et al., 2008). The diffusion of GFP::PIE-1 is significantly slower in the posterior cytoplasm than in the anterior cytoplasm, indicating that, like MEX-5, differential mobility along the A/P axis likely underlies PIE-1 segregation (Daniels et al., 2009). It is not known whether the segregation of POS-1 and MEX-1 similarly results from local control of their mobility. Furthermore, it is not known how the PAR proteins and MEX-5/6 regulate the dynamics of PIE-1, POS-1 and MEX-1 in order to control their segregation.
We have analyzed the segregation of GFP::PIE-1, GFP::POS-1, and GFP::MEX-1 in the C. elegans zygote. We find that GFP::PIE-1, GFP::POS-1, and GFP::MEX-1 form posterior-rich concentration gradients that are established at distinct rates and have distinct strengths. All three proteins diffuse more slowly in the posterior cytoplasm than in the anterior cytoplasm, and the differential in their diffusivity along the A/P axis correlates with the strength of their respective concentration gradients. We find that MEX-5/6 act downstream of PAR-1 and PAR-3 and in a concentration-dependent manner to increase the mobility of GFP::PIE-1. These results support a model in which the MEX-5/6 concentration gradients are directly coupled to the formation of the PIE-1 concentration gradient via the formation of a PIE-1 diffusion gradient.
RESULTS
Quantification of GFP::PIE-1, GFP::POS-1, and GFP::MEX-1 segregation
To analyze the dynamics underlying the segregation of GFP::PIE-1, GFP::POS-1, and GFP::MEX-1, we first quantified their localization using time-lapse spinning-disk confocal microscopy. Before the onset of polarization, each protein is symmetrically distributed along the A/P axis (Figure 1A). Beginning with the onset of polarization, the concentrations of GFP::PIE-1, GFP::POS-1, and GFP::MEX-1 progressively decrease in the anterior cytoplasm as they increase in the posterior cytoplasm, consistent with previous analysis of GFP::PIE-1 (Figure 1B; Reese et al., 2000; Daniels et al., 2009). GFP::PIE-1 and GFP::POS-1 respectively reach half-maximal enrichment in the posterior 4.5 min (n = 5, SEM = 0.38) and 4.6 min (n = 5, SEM = 0.13) after the onset of polarization and reach maximal enrichment after ∼9 min. The accumulation of GFP::MEX-1 in the posterior cytoplasm occurs significantly more slowly than the accumulation of either GFP::PIE-1 or GFP::POS-1. GFP::MEX-1 reaches half-maximal enrichment after 6.3 min (n = 5, SEM = 0.39) and continues to enrich in the posterior cytoplasm through nuclear envelope breakdown (NEBD) ∼11 min after onset of polarization (Figure 1B).
FIGURE 1:
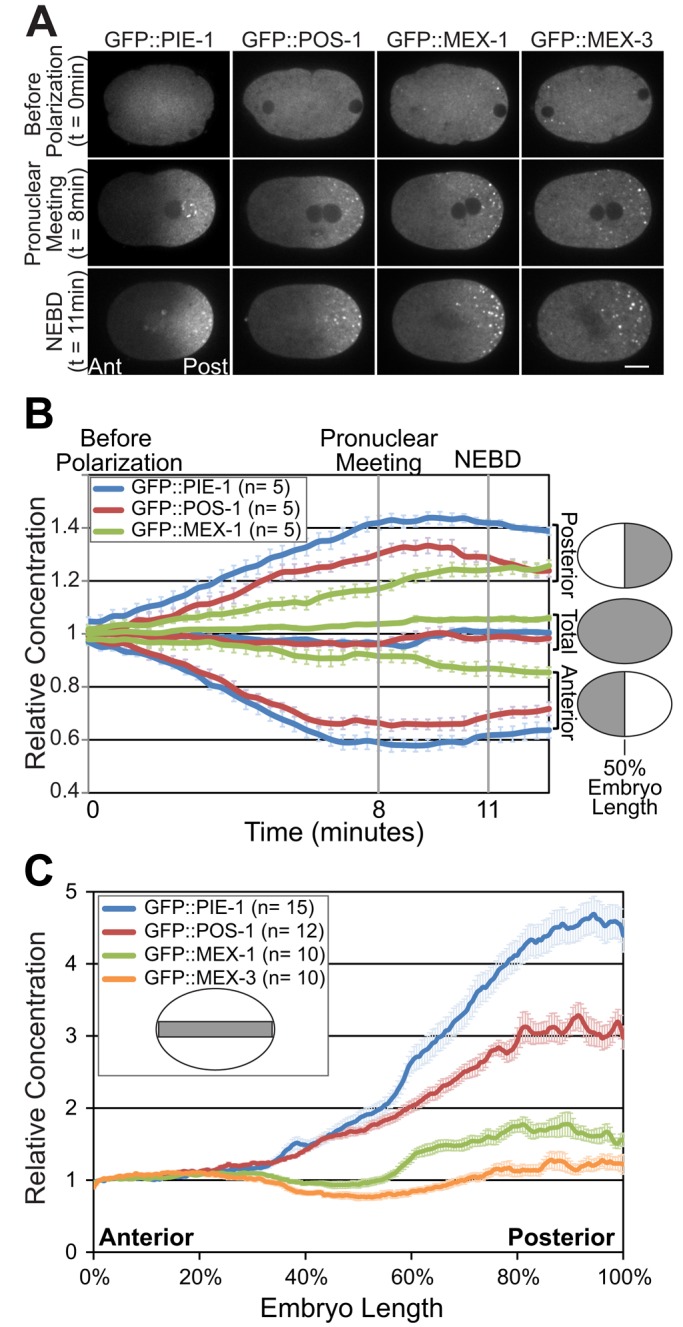
GFP::PIE-1, GFP::POS-1, GFP::MEX-1, and GFP::MEX-3 localization in the C. elegans zygote. (A) Images of zygotes expressing the indicated GFP fusion proteins collected before polarization, at pronuclear meeting, and at NEBD. All four GFP fusion proteins are present in the diffuse cytoplasm and associate with P granules (bright puncta in the posterior cytoplasm at pronuclear meeting and NEBD). Scale bar, 10 μm. Anterior is to the left and posterior is to the right. (B) Graph of the mean concentration of the indicated GFP fusion proteins in the anterior half, posterior half, or total cytoplasm from before polarization until 100 s after NEBD (just before cytokinesis). The regions used for quantification are indicated in gray in the embryo schematics to the right. (C) Line scan analysis of the concentration of the indicated GFP fusion proteins along the A/P axis at NEBD. The regions for quantification are indicated in gray in the embryo schematic. Values from the indicated number of embryos (n) were averaged. Error bars indicate SEM.
To characterize the shape and amplitude of their respective gradients, we next quantified the concentration of GFP::PIE-1, GFP::POS-1, and GFP::MEX-1 along the A/P axis at NEBD using line scan analysis. The concentration of each protein increases gradually between ∼30 and ∼90% embryo length (Figure 1C). The gradient formed by transgenic GFP::PIE-1 has a maximal amplitude of 4.8-fold and is very similar to the gradient formed by PIE-1 tagged at the endogenous locus with green fluorescent protein (GFP; Figure 1C and Supplemental Figure S1, A and B; Kim et al., 2014). The GFP::POS-1 and GFP::MEX-1 gradients are weaker than the GFP::PIE-1 gradient, with maximal amplitudes of three- and 1.8-fold, respectively (Figure 1C). The differences in gradient strength correlate with significant differences in the posterior enrichment of each protein. The ratio of the mean concentration in the posterior relative to the mean concentration in the anterior cytoplasm is 2.52 for GFP::PIE-1, 1.93 for GFP::POS-1, and 1.39 for GFP::MEX-1 (Supplemental Figure S2A). In contrast, GFP::MEX-3, which is an RNA-binding protein enriched on P granules but otherwise symmetrically distributed in the cytoplasm, has a posterior enrichment of only 1.05 (Figure 1, A and C, and Supplemental Figure S2A; Draper et al., 1996). Taken together, these data indicate that all three proteins begin to segregate to the posterior at the onset of polarization, but their rate of segregation and the strength of their respective gradients differ.
Differential diffusion of GFP::PIE-1, GFP::POS-1, and GFP::MEX-1
We next used fluorescence correlation spectroscopy (FCS) to estimate the apparent diffusion rate of GFP::PIE-1, GFP::POS-1, and GFP::MEX-1 in the anterior and posterior cytoplasm of polarized zygotes. FCS is an imaging technique in which the apparent diffusion coefficient of a fluorescently tagged protein can be estimated from analysis of fluorescence fluctuation patterns (Schwille et al., 1999). We first estimated the apparent diffusion coefficient of two symmetrically distributed proteins, GFP and GFP::MEX-3. As expected and consistent with previous findings, the mobility of GFP is similar in the anterior and posterior cytoplasm (Figure 2 and Supplemental Table S1; Tenlen et al., 2008; Daniels et al., 2010). Similarly, the diffusivity of GFP::MEX-3 is uniform along the A/P axis, although it is significantly lower than the apparent diffusion rate of GFP (Figure 2 and Supplemental Table S1). We next used FCS to estimate the diffusivity of GFP::PIE-1 and found that, consistent with previous FRAP and FCS analysis of GFP::PIE-1, the apparent diffusion rate of GFP::PIE-1 is significantly slower in the posterior than in the anterior cytoplasm (Figure 2 and Supplemental Table S1; Daniels et al., 2009). We find similar results for PIE-1 tagged with GFP at the endogenous locus (Supplemental Figure S1C; Kim et al., 2014). At intermediate positions along the A/P axis, the apparent diffusion of GFP::PIE-1 is intermediate relative to the anterior and posterior cytoplasm, suggesting that there is a continuous gradient of GFP::PIE-1 mobility along the A/P axis (Supplemental Figure S1, D and E).
FIGURE 2:
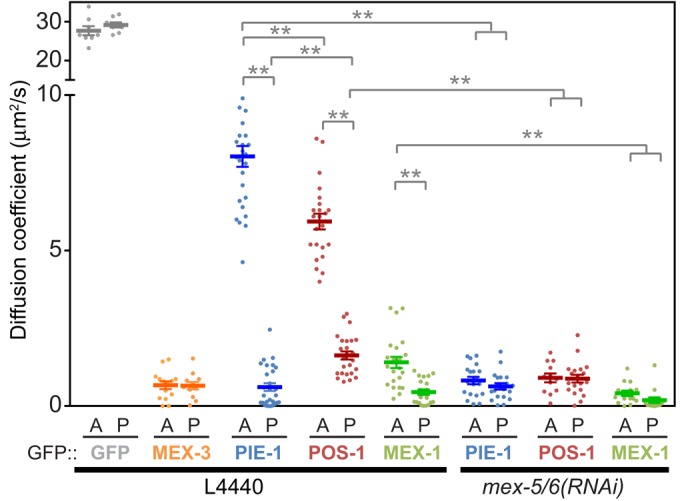
Differential diffusion of GFP::PIE-1, GFP::POS-1, and GFP::MEX-1 along the A/P axis. The apparent diffusion rates of the indicated GFP fusion proteins were estimated in wild-type and mex-5/6(RNAi) embryos by FCS analysis using a one-component anomalous diffusion model. Measurements were made at NEBD in the anterior cytoplasm (A) and posterior cytoplasm (P). These data, along with the anomaly coefficients and number of measurements, are also presented in Supplemental Table S1. Wild-type represents embryos treated with control RNAi conditions (empty L4440 vector). Statistical significance was determined by unpaired t tests with Welch's correction and is indicated by asterisks (**p < 0.01). Error bars represent SEM.
We next characterized the mobility of GFP::POS-1 and GFP::MEX-1 in the anterior and posterior cytoplasm at NEBD. Like GFP::PIE-1, both GFP::POS-1 and GFP::MEX-1 are less mobile in the posterior cytoplasm than in the anterior cytoplasm. Interestingly, the apparent diffusion rates of GFP::MEX-1 and GFP::POS-1 in the anterior cytoplasm are significantly lower than that of GFP::PIE-1, resulting in a smaller differential in the mobility of GFP::MEX-1 and of GFP::POS-1 along the A/P axis (Figure 2 and Supplemental Table S1). The mobility of GFP::POS-1 is slightly higher than GFP::PIE-1 in the posterior cytoplasm, which also contributes to its smaller differential in diffusivity (Figure 2 and Supplemental Table S1). Therefore the differentials in diffusivity along the A/P axis correlate with the strength of the respective concentration gradients such that proteins exhibiting a larger differential in mobility (e.g., GFP::PIE-1) form a stronger concentration gradient than proteins with a smaller differential in mobility (e.g., GFP::POS-1). Furthermore, the relatively low mobility of GFP::MEX-1 in the anterior cytoplasm likely limits the rate at which GFP::MEX-1 partitions to the posterior cytoplasm, resulting in the relatively slow rate of GFP::MEX-1 gradient formation (Figure 1B).
Because PIE-1 concentrates on P granules and in the cytoplasm surrounding P granules, we next sought to determine the extent to which enrichment on P granules contributes to the segregation of PIE-1 (Mello et al., 1996; Tenenhaus et al., 1998). PGL-1, PGL-3, GLH-1, and GLH-4 are core P granule components, and pgl-1;pgl-3;glh-1;glh-4(RNAi) results in dispersal of P granules (Updike et al., 2014). We find that in pgl-1;pgl-3;glh-1;glh-4(RNAi) embryos, GFP::PIE-1 is not concentrated in P granule–like foci and yet forms a gradient similar to control RNA interference (RNAi) embryos (Supplemental Figure S2, B and C; Updike et al., 2014). These results are consistent with the previous findings that PIE-1 segregates normally in pptr-1 and meg-3;meg-4 mutants, in which the assembly of P granules in the posterior cytoplasm is disrupted (Gallo et al., 2010; Wang et al., 2014). Taken together, these findings indicate that enrichment on P granules is not required for formation of the GFP::PIE-1 concentration gradient.
MEX-5/6 act to increase the mobility of GFP::PIE-1, GFP::POS-1, and GFP::MEX-1
MEX-5/6 form anterior-high, posterior-low concentration gradients and are required for the segregation of PIE-1, POS-1, and MEX-1 to the posterior cytoplasm (Schubert et al., 2000; Cuenca et al., 2003). Therefore we next characterized the role of MEX-5/6 in the regulation of GFP::PIE-1, GFP::POS-1, and GFP::MEX-1 mobility. For all three proteins, depletion of MEX-5/6 levels by RNAi results in uniform diffusivity, primarily due to significant decreases in their mobility in the anterior cytoplasm (Figure 2 and Supplemental Table S1). The mobility of GFP::PIE-1 and GFP::MEX-1 in mex-5/6(RNAi) embryos is similar to their mobility in the posterior cytoplasm of wild-type embryos (Figure 2 and Supplemental Table S1). In contrast, the mobility of GFP::POS-1 is slightly lower in mex-5/6(RNAi) embryos than in the posterior of wild-type embryos, suggesting that GFP::POS-1 mobility is sensitive to the relatively low concentration of MEX-5/6 in the posterior cytoplasm of wild-type embryos (Figure 2 and Supplemental Table S1). These data indicate that MEX-5/6 act to increase the mobility of GFP::PIE-1, GFP::POS-1, and GFP::MEX-1, particularly in the anterior cytoplasm, where MEX-5/6 concentrations are high.
MEX-5/6 act downstream of PAR-1 and PAR-3 to increase GFP::PIE-1 mobility
The partitioning of factors in the zygotic cytoplasm is controlled by the PAR proteins. For example, in par-1 and par-3 mutant embryos, MEX-5/6 and PIE-1 are symmetrically distributed throughout the cytoplasm (Tenenhaus et al., 1998; Schubert et al., 2000; Cuenca et al., 2003). Therefore we next characterized the role of PAR-1 and PAR-3 in the regulation of GFP::PIE-1 mobility. The apparent diffusion rate of GFP::PIE-1 is uniform in par-3(it71) and par-1(it51) mutant embryos and is significantly higher than in mex-5/6(RNAi) embryos (Figure 3 and Supplemental Table S2; Etemad-Moghadam et al., 1995; Guo and Kemphues, 1995; Tenenhaus et al., 1998). In mex-5/6(RNAi);par-1(it51) and mex-5/6(RNAi);par-3(it71) embryos, the apparent diffusion rate of GFP::PIE-1 is similar to that in mex-5/6(RNAi) embryos (Figure 3 and Supplemental Table S2). Therefore mex-5/6 are epistatic to par-1 and par-3 with respect to the control of GFP::PIE-1 mobility, suggesting that MEX-5/6 function downstream of PAR-1 and PAR-3 to increase GFP::PIE-1 mobility.
FIGURE 3:
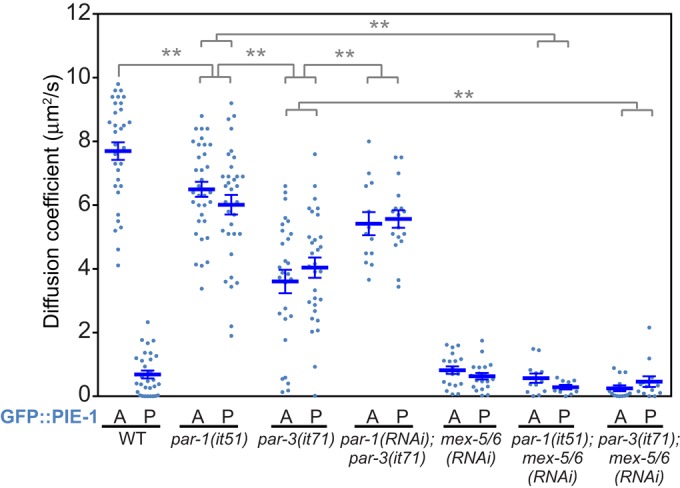
Regulation of GFP::PIE-1 mobility in the C. elegans zygote. The apparent diffusion rates of GFP::PIE-1 in zygotes with the indicated genotypes were determined as in Figure 2. The values for embryos treated with mex-5/6(RNAi) are duplicated from Figure 2 and are presented for comparison. Statistical significance was determined by unpaired t tests with Welch's correction and is indicated by asterisks (**p < 0.01). Error bars represent SEM.
We noted that the apparent diffusion of GFP::PIE-1 is significantly higher in par-1(it51) embryos than in par-3(it71) embryos (Figure 3 and Supplemental Table S2). Depletion of PAR-1 in par-3(it71) increases GFP::PIE-1 mobility, suggesting that PAR-1 functions downstream of PAR-3 in the control of GFP::PIE-1 mobility (Figure 3 and Supplemental Table S2). MEX-5 expression levels are similar in par-1 and par-3 mutant worms, suggesting that the difference in GFP::PIE-1 mobility may reflect differences in MEX-5 activity rather than MEX-5 expression levels (Supplemental Figure S3). This interpretation is consistent with the previous finding that PAR-1 acts downstream of PAR-3 to regulate MEX-5/6 activity with respect to the control of PIE-1 nuclear localization (Cuenca et al., 2003). PAR-1 phosphorylates MEX-5 on two residues near the C-terminus, and we speculate that this phosphorylation may reduce MEX-5's ability to stimulate increased GFP::PIE-1 mobility (Tenlen et al., 2008; Griffin et al., 2011).
MEX-5 controls GFP::PIE-1 mobility in a concentration-dependent manner
The preceding results are consistent with a model in which the PAR proteins function to establish the MEX-5/6 concentration gradients, which in turn function in a concentration-dependent manner to generate a gradient in the diffusivity of GFP::PIE-1 along the A/P axis. This model predicts that GFP::PIE-1 mobility should be sensitive to the concentration of MEX-5/6 independent of the activity of the PAR proteins. To test this prediction, we used partial MEX-5/6 RNAi to deplete MEX-5/6 levels to various extents in par-1(it51) embryos (schematized in Figure 4A). In parallel, we analyzed GFP::PIE-1 diffusion by FCS and MEX-5 levels by quantitative Western blot analysis. We were not able to monitor MEX-6 levels because there is not an antibody that specifically recognizes MEX-6. We find that as MEX-5/6 levels are depleted, the apparent diffusion coefficient of GFP::PIE-1 progressively decreases, reaching a minimum when MEX-5 levels are depleted to ∼25% of the levels in par-1(it51) worms (Figure 4, B–D). These data indicate that GFP::PIE-1 mobility is controlled by the concentration of MEX-5/6 and suggest a direct coupling between the MEX-5/6 concentration gradients and the formation of the GFP::PIE-1 diffusion gradient.
FIGURE 4:

MEX-5/6 control the mobility of GFP::PIE-1 in a concentration-dependent manner. (A) Schematic of the experimental design. In par-1(it51) embryos, MEX-5/6 (red) and PIE-1 (green) are uniformly distributed. MEX-5/6 levels were depleted with various strengths of mex-5/6(RNAi) treatment. (B) Western blot analysis of whole-worm extracts using either MEX-5 (top) or α-tubulin (bottom) antibodies. Left half of the blot: extracts from various numbers of par-1(it51) worms (where 1X = 18 worm equivalents) were used to determine the linearity of the MEX-5 and α-tubulin signals. Right half of the blot: Extracts from equivalent numbers of mex5/6(RNAi)-treated worms. The ratio of mex-5/6(RNAi):empty vector RNAi for each lane is indicated above the blot. Homozygous mex-5(zu199);mex-6(pk440) whole-worm extracts (far right lane) were used to establish the background signal for MEX-5. Dashed line indicates a region of the gel that was cropped. The normalized MEX-5 levels for each lane are indicated below the blot. (C, D) Graphs comparing the apparent diffusion rate (C) and the anomaly coefficient (D) of GFP::PIE-1 relative to the normalized concentration of MEX-5 in par-1(it51) embryos (as determined in B). Because both MEX-5/6 and GFP::PIE-1 are uniformly distributed in these embryos, measurements taken in the anterior and the posterior cytoplasm were combined for each RNAi condition. The data from three independent experiments are plotted together. Error bars represent SEM. (E) Schematic of our working model in which the MEX-5/6 concentration gradients establish a PIE-1 diffusion gradient, which in turn leads to the formation of a PIE-1 concentration gradient.
DISCUSSION
Taking together this and previous studies, we propose the following working model connecting cortical PAR polarity to the partitioning of cytoplasmic CCCH-finger proteins. The posterior enrichment of PAR-1 kinase results in a differential in MEX-5 (and presumably MEX-6) diffusivity along the A/P axis that leads to the formation of anterior-rich MEX-5/6 concentration gradients (Tenlen et al., 2008; Daniels et al., 2010; Griffin et al., 2011). In turn, MEX-5/6 act in a concentration-dependent manner to increase the mobility of PIE-1, resulting in a gradient in PIE-1 mobility along the A/P axis. As a consequence, PIE-1 is preferentially retained in the posterior cytoplasm and forms a persistent, posterior-rich concentration gradient (schematized in Figure 4E; Daniels et al., 2009). MEX-5/6 also act to increase the mobility of GFP::POS-1 and GFP::MEX-1, suggesting that MEX-5/6 likely functions downstream of the PAR proteins to regulate POS-1 and MEX-1 mobility as well. Thus we propose that polarity cues from the cortical PAR proteins are transduced to PIE-1, POS-1, and MEX-1 via direct coupling between MEX-5/6 concentration gradients and the establishment of PIE-1, POS-1, and MEX-1 mobility gradients.
To date, we have analyzed the mobility of five fluorescently tagged cytoplasmic RNA-binding proteins (PIE-1, POS-1, MEX-1, MEX-3, and MEX-5). All five proteins have highly retarded mobility in the zygotic cytoplasm, raising the possibility that their low mobility may result from their association with cytoplasmic RNA. Consistent with this possibility, mutations predicted to reduce the affinity of MEX-5 for RNA increase MEX-5 mobility and flatten the MEX-5 gradient (Griffin et al., 2011). In addition, mutations predicted to cause misfolding of the second PIE-1 zinc-finger RNA-binding domain prevent the segregation of GFP::PIE-1 (Reese et al., 2000). It has been shown that, in vitro, MEX-5 can compete POS-1 off of a common target mRNA (Oldenbroek et al., 2013). Therefore one possibility is that MEX-5/6 competes with PIE-1, POS-1, and MEX-1 for common transcripts that retard their diffusion, thus promoting their “release” into a free-diffusing state. The apparent difference in the responsiveness of GFP::PIE-1, GFP::POS-1, and GFP::MEX-1 to MEX-5/6 may reflect how easily these proteins can be dissociated from slow-diffusing complexes by MEX-5/6. We consider it unlikely that MEX-5/6 act solely to control the partitioning of an unknown regulator of GFP::PIE-1 mobility, because if this were the case, we would not predict that modulating MEX-5/6 levels in a nonpolarized embryo (such as a par-1 mutant embryo) would alter GFP::PIE-1 mobility.
MEX-5/6 contribute to the disassembly of P granules in the anterior cytoplasm and have been proposed to control the saturation concentration at which P granule components phase separate (Schubert et al., 2000; Brangwynne et al., 2009; Gallo et al., 2010). One intriguing possibility is that MEX-5/6 act through a common mechanism to contribute to P granule disassembly and to increase PIE-1, POS-1, and MEX-1 mobility. P granule components assemble into micrometer-sized foci in part due to the propensity of P granule proteins to aggregate through intrinsically disordered domains and/or high-valency interactions (Hanazawa et al., 2011, Updike et al., 2011; Wang et al., 2014; Elbaum-Garfinkle et al., 2015). PIE-1, POS-1, and MEX-1 may be less prone to assembly/aggregation than other P granule components, which may explain why they from diffuse cytoplasmic gradients rather than discrete foci in the posterior cytoplasm.
For cytoplasmic concentration gradients to persist, the dissipation of gradients by random diffusion must be overcome (Elowitz et al., 1999; Lipkow and Odde, 2008). In the case of morphogens, local protein production coupled with protein movement and degradation can generate gradients that form over the course of hours and span hundreds of micrometers (Wartlick et al., 2009; Muller et al., 2013). These mechanisms are unlikely to generate gradients at intracellular length scales due to the homogenizing effects of random diffusion (Howard, 2012). The work presented here, along with recent theoretical and experimental studies, supports an emerging model in which local modulation of protein mobility provides a robust and rapid mechanism by which cytoplasmic concentration gradients can be established at cellular length scales (Lipkow and Odde, 2008; Daniels et al., 2009; Griffin et al., 2011; Kiekebusch et al., 2012).
MATERIALS AND METHODS
Worm strains
All worms were maintained at 25°C on nematode growth medium (NGM) plates and OP50 bacteria unless otherwise noted. The following transgenic strains were used in this study: JH2015, GFP::PIE-1 (unc-119(ed3); axIs1462[pCM4.08]; Merritt et al., 2008); JH2214, GFP::MEX-3 (unc-119(ed3); axIs1602[pCM4.38]; Merritt et al., 2008); JH1766, GFP::POS-1 (unc-119(ed3); axIs1266[pMS4.03]; Stitzel et al., 2007); and JH1743, GFP::MEX-1 (unc-119(ed3); axIs1251), a gift of G. Seydoux, Johns Hopkins University School of Medicine, Baltimore, MD). All four transgenic strains express N-terminal GFP fusion proteins at similar levels under the control of the pie-1 promoter and their own 3′ untranslated region (UTR), with the exception of GFP::POS-1, which is controlled by the PIE-1 3′ UTR. Strains with PIE-1 tagged at its endogenous locus were WM329 (PIE-1(ne4300[gfp::PIE-1])) and WM330 (PIE-1(ne4301[pie-1::GFP])); Kim et al., 2014. The mutant strains used in this study were KK292 (par-1(it51) rol-4(sc8)/DnT1); Guo and Kemphues, 1995; KK571 (lon-1(e185) par-3(it71)/qC1 dpy-19(e1259) glp-1(q339)III); Cheng et al., 1995; and JJ1244 (mex-6(pk440) II; unc-30(e191) mex-5(zu199) IV/nT1 (IV;V)); Schubert et al., 2000.
RNAi
RNAi depletions were performed using the feeding method with plasmids derived from L4440 (Timmons and Fire, 1998). HT115 bacteria (110 μl) transformed with an RNAi feeding plasmid were spread on NGM plates containing 1 mM isopropyl-β-d-thiogalactoside and 25 μg/ml carbenicillin. Plates were incubated overnight at 22°C. L4 worms were then grown on these RNAi plates for 24 h at 25°C, except for par-1 (RNAi), which was incubated for 28 h. MEX-5 (pEG656) and MEX-6 (pEG658) RNAi constructs target the second exon of MEX-5 and MEX-6, respectively. The PAR-1 RNAi construct (pEG793) targets the full-length PAR-1 coding sequence. pDU49 was used to simultaneously deplete GLH-1, GLH-4, PGL-1, and PGL-3 (gift of D. Updike, MDI Biological Laboratory, Bar Harbor, ME; Updike et al., 2014). For partial depletion of MEX-5/6 by RNAi, MEX-5 and MEX-6 RNAi bacteria were mixed and diluted 1:2.5, 1:5, and 1:7.5 and 1:10 with HT115 bacteria transformed with L4440 (empty RNAi feeding vector) and 1:40 dilution of GFP RNAi bacteria (in order to reduce expression of the GFP::PIE-1 transgene for FCS analysis).
Western blots
For quantification of MEX-5 levels after partial depletion by RNAi, 90 worms from each RNAi treatment were washed twice in egg salts, suspended in 45 μl of egg salts, flash frozen on dry ice, and stored at −80°C. Samples were thawed, and 15 μl of 4× Laemmli Sample Buffer (Bio-Rad, Hercules, CA) containing 5 mM phenylmethylsulfonyl fluoride (PMSF) was added. Samples were sonicated for 90 s in a Branson 1510 sonicating water bath. After sonication, 15 μl of dithiothreitol (DTT) was added, making a final concentration of 200 mM for DTT and 1 mM for PMSF. Samples were boiled at 95°C for 5 min, centrifuged at 13,000 rpm for 1 min, and loaded onto Any kD Mini-PROTEAN TGX Gel (Bio-Rad). Extracts from the equivalent of 14.4 (two experiments) or 10 (one experiment) worms treated with various strengths of mex-5/6; GFP(RNAi) were loaded per lane. To generate a standard curve for the MEX-5 and tubulin Western blot signals, a range of extract volumes from adult par-1(it51) worms (between 3.6 and 18 worm equivalents for two experiments and 2.5 and 12.5 worm equivalents for one experiment) were loaded, and the chemiluminescence intensities of MEX-5 and tubulin were plotted against the number of par-1 (it51) worm equivalents loaded in each lane. The background signal for the MEX-5 antibody was determined using extract from JJ1244 worms (mex-6(pk440) II; unc-30(e191) mex-5(zu199) IV/nT1 (IV;V)). Curves were fitted to polynomial functions with R2 > 0.985 in Excel (Microsoft, Redmond, WA). For all experiments, the signal from the MEX-5/6 RNAi samples was within the range of the standard curve. The relative concentration of MEX-5 was determined by normalizing to tubulin and averaged between duplicate blots. Proteins were transferred to Immobilon-P polyvinylidene fluoride membrane (EMD Millipore, Billerica, MA) and probed first with guinea pig anti-MEX-5 (Griffin et al., 2011) at a 1:1000 dilution. These blots were stripped using Restore PLUS Western Blot Stripping Buffer (Thermo Scientific, Waltham, MA) and probed with mouse monoclonal anti–α-tubulin antibody DM1A (Sigma-Aldrich, St. Louis, MO) at 1:1200 dilution. Peroxidase-conjugated secondary antibodies (Jackson ImmunoResearch, West Grove, PA) were used at 1:20,000 dilution. All antibodies were diluted in phosphate-buffered saline/Tween-20 (0.1%) with 5% milk. Blots were developed with the Clarity Western ECL Substrate (Bio-Rad) and imaged with the ChemiDoc XRS system (Bio-Rad).
Live microscopy and image analysis
For gradient quantification (Figure 1), worms were dissected and embryos were imaged in M9 buffer on a 3% agarose pad. Images and time-lapse movies were collected on a Marianas spinning-disk confocal microscope (Intelligent Imaging Innovations, Denver, CO) built around a Zeiss Axio Observer.Z1 microscope equipped with a Zeiss Plan-Apochromat 63×/1.4 numerical aperture (NA) oil immersion objective, an Evolve 512 × 512 electron-multiplying charge-coupled device camera (Photometrics, Tucson, AZ), a 488-nm, 50-mW solid-state laser, and a CSU-X1 spinning disk (Yokogawa, Tokyo, Japan). This microscope was controlled with the SlideBook software package (Intelligent Imaging Innovations). For all acquisitions, the camera intensification was 300, and the camera gain was 1. Images in Figure 1A are from time-lapse acquisitions in which images were captured at 15 s intervals with the 488-nm laser set at 60% power and 600 ms exposures. Time-lapse images quantified in Figure 1B were collected every 20 s using 200 ms exposures and 488 nm laser set at 45% power. Images quantified in Figure 1C were captured at the cell midplane using 488-nm laser set at 60% power and 1 s exposures.
To quantify the mean concentration in the anterior and posterior cytoplasm (Figure 1B), the mean fluorescence intensities in the anterior half, the posterior half, and throughout the zygote were determined at each time point. Background signals (outside the embryo) were subtracted from the embryonic values. Fluorescence intensities were normalized to the initial total value for each embryo. Movies were aligned temporally relative to pronuclear meeting. For line scan analysis (Figure 1C), fluorescence intensities were averaged for 15 pixels perpendicular to the A/P axis using ImageJ (National Institutes of Health, Bethesda, MD). Background signals (outside the embryo) were subtracted from the embryonic values. The fluorescence intensities along the A/P axis were normalized to the average of the first 10 pixels on the anterior end. To average the fluorescence values from multiple embryos that differ slightly in length, the signal at 201 regularly spaced points along the A/P axis (correlating to every 0.5% embryo length) was estimated using linear interpolation with the interp1 function in Matlab (version R2013a; MathWorks, Natick, MA).
Fluorescence correlation spectroscopy
To reduce GFP expression levels to facilitate FCS analysis, 60 worms were fed with GFP RNAi bacteria diluted at 1:40 in L4440 empty vector bacteria for 24 h at 25°C. Embryos were dissected from young adults and imaged in M9 on a 3% agarose pad. FCS was performed on a Nikon A1 laser scanning confocal microscope using a 60×/1.27 NA water immersion objective (Plan Apo IR; Nikon, Melville, NY). A pulsed 485-nm laser at 20-MHz repetition frequency (PDL800-D; PicoQuant GmbH, Berlin, Germany) was used, and autocorrelation curves were obtained with afterpulsing suppression in SymPhoTime (PicoQuant). The pinhole was set to 1 Airy unit. The effective confocal volume approximated by a Gaussian profile,  , was calibrated by fitting the autocorrelation curve of 1 nM fluorescence dye ATTO488 (ATTO-TEC, Siegen, Germany) to a three-dimensional triplet-state model with one free-diffusing species:
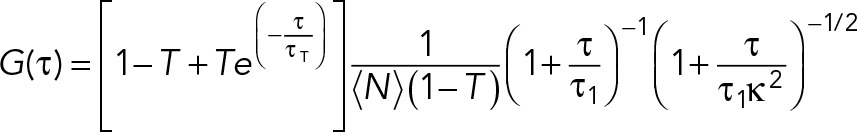 |
where w0 is the effective lateral focal radius at 1/e2 intensity, z0 is the effective focal radius along the optical axis at 1/e2 intensity, T is the triplet fraction of molecules, τT is the lifetime of the triplet state, N is the average number of molecules in the focal volume, τ1 is the diffusion time, and κ = z0/w0 is the length-to-diameter ratio of the focal volume. Given the diffusion coefficient of ATTO488 (360 μm2/s), we acquired mean κ values of 5.484 (SEM = 0.090) and a mean effective confocal volume Veff = 0.293 fl (SEM = 0.008). FCS data were collected for 60 s at ∼10% embryo length (anterior cytoplasm) or ∼90% embryo length (posterior cytoplasm) at NEBD. Autocorrelation curves were fitted to a three-dimensional one-component anomalous diffusion model:
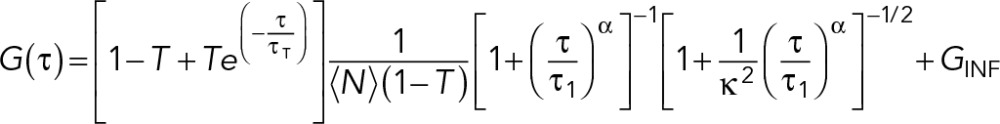 |
where α is the anomaly parameter and GINF is the correlation offset (Supplemental Figure S4). GFP::PIE-1, GFP::POS-1, GFP::MEX-1, and GFP::MEX-3 autocorrelation curves fit significantly better to either a one-component anomalous diffusion model or a two-component free diffusion model than to a one-component free diffusion model. We chose to use a one-component anomalous diffusion model for all of our analyses because GFP autocorrelation curves were fitted better using a one-component anomalous diffusion model than a one-component free diffusion model. Representative autocorrelation curves and fit residuals are presented in Supplemental Figure S4. Statistical analysis was performed using multiple t tests with Welch's correction in GraphPad Prism 6 (GraphPad Software, La Jolla, CA).
Supplementary Material
Acknowledgments
We thank Ekaterina Voronina, Amy Gladfelter, and members of the Griffin lab for helpful comments on the manuscript. We thank Tian Luo (Dartmouth College) for assistance with data analysis. We thank Geraldine Seydoux, Dustin Updike, and Craig Mello for providing strains and plasmids. Some strains were provided by the Caenorhabditis Genetics Center (CGC), which is funded by the National Institutes of Health Office of Research Infrastructure Programs (P40 OD010440). The Griffin lab acknowledges funding from the March of Dimes (5-FY14-63) and the Dartmouth-Hitchcock Norris Cotton Cancer Center.
Abbreviations used:
- A/P
anterior/posterior
- FCS
fluorescence correlation spectroscopy
- NEBD
nuclear envelope breakdown.
Footnotes
This article was published online ahead of print in MBoC in Press (http://www.molbiolcell.org/cgi/doi/10.1091/mbc.E15-05-0302) on July 8, 2015.
REFERENCES
- Boyd L, Guo S, Levitan D, Stinchcomb DT, Kemphues KJ. PAR-2 is asymmetrically distributed and promotes association of P granules and PAR-1 with the cortex in C. elegans embryos. Development. 1996;122:3075–3084. doi: 10.1242/dev.122.10.3075. [DOI] [PubMed] [Google Scholar]
- Brangwynne CP, Eckmann CR, Courson DS, Rybarska A, Hoege C, Gharakhani J, Jülicher F, Hyman AA. Germline P granules are liquid droplets that localize by controlled dissolution/condensation. Science. 2009;324:1729–1732. doi: 10.1126/science.1172046. [DOI] [PubMed] [Google Scholar]
- Cheng NN, Kirby CM, Kemphues KJ. Control of cleavage spindle orientation in Caenorhabditis elegans: the role of the genes par-2 and par-3. Genetics. 1995;139:549–559. doi: 10.1093/genetics/139.2.549. [DOI] [PMC free article] [PubMed] [Google Scholar]
- Cuenca AA, Schetter A, Aceto D, Kemphues K, Seydoux G. Polarization of the C. elegans zygote proceeds via distinct establishment and maintenance phases. Development. 2003;130:1255–1265. doi: 10.1242/dev.00284. [DOI] [PMC free article] [PubMed] [Google Scholar]
- Daniels BR, Dobrowsky TM, Perkins EM, Sun SX, Wirtz D. MEX-5 enrichment in the C. elegans early embryo mediated by differential diffusion. Development. 2010;137:2579–2585. doi: 10.1242/dev.051326. [DOI] [PMC free article] [PubMed] [Google Scholar]
- Daniels BR, Perkins EM, Dobrowsky TM, Sun SX, Wirtz D. Asymmetric enrichment of PIE-1 in the Caenorhabditis elegans zygote mediated by binary counterdiffusion. J Cell Biol. 2009;184:473–479. doi: 10.1083/jcb.200809077. [DOI] [PMC free article] [PubMed] [Google Scholar]
- Draper BW, Mello CC, Bowerman B, Hardin J, Priess JR. MEX-3 is a KH domain protein that regulates blastomere identity in early C. elegans embryos. Cell. 1996;87:205–216. doi: 10.1016/s0092-8674(00)81339-2. [DOI] [PubMed] [Google Scholar]
- Elbaum-Garfinkle S, Kim Y, Szczepaniak K, Chen CC, Eckmann CR, Myong S, Brangwynne CP. The disordered P granule protein LAF-1 drives phase separation into droplets with tunable viscosity and dynamics. Proc Natl Acad Sci USA. 2015;112:7189–7194. doi: 10.1073/pnas.1504822112. [DOI] [PMC free article] [PubMed] [Google Scholar]
- Elowitz MB, Surette MG, Wolf PE, Stock JB, Leibler S. Protein mobility in the cytoplasm of Escherichia coli. J Bacteriol. 1999;181:197–203. doi: 10.1128/jb.181.1.197-203.1999. [DOI] [PMC free article] [PubMed] [Google Scholar]
- Etemad-Moghadam B, Guo S, Kemphues KJ. Asymmetrically distributed PAR-3 protein contributes to cell polarity and spindle alignment in early C. elegans embryos. Cell. 1995;83:743–752. doi: 10.1016/0092-8674(95)90187-6. [DOI] [PubMed] [Google Scholar]
- Gallo CM, Wang JT, Motegi F, Seydoux G. Cytoplasmic partitioning of P granule components is not required to specify the germline in C. elegans. Science. 2010;330:1685–1689. doi: 10.1126/science.1193697. [DOI] [PMC free article] [PubMed] [Google Scholar]
- Goldstein B, Macara IG. The PAR proteins: fundamental players in animal cell polarization. Dev Cell. 2007;13:609–622. doi: 10.1016/j.devcel.2007.10.007. [DOI] [PMC free article] [PubMed] [Google Scholar]
- Griffin EE, Odde DJ, Seydoux G. Regulation of the MEX-5 gradient by a spatially segregated kinase/phosphatase cycle. Cell. 2011;146:955–968. doi: 10.1016/j.cell.2011.08.012. [DOI] [PMC free article] [PubMed] [Google Scholar]
- Guedes S, Priess JR. The C. elegans MEX-1 protein is present in germline blastomeres and is a P granule component. Development. 1997;124:731–739. doi: 10.1242/dev.124.3.731. [DOI] [PubMed] [Google Scholar]
- Guo S, Kemphues KJ. par-1, a gene required for establishing polarity in C. elegans embryos, encodes a putative Ser/Thr kinase that is asymmetrically distributed. Cell. 1995;81:611–620. doi: 10.1016/0092-8674(95)90082-9. [DOI] [PubMed] [Google Scholar]
- Hanazawa M, Yonetani M, Sugimoto A. PGL proteins self associate and bind RNPs to mediate germ granule assembly in C. elegans. J Cell Biol. 2011;192:929–937. doi: 10.1083/jcb.201010106. [DOI] [PMC free article] [PubMed] [Google Scholar]
- Howard M. How to build a robust intracellular concentration gradient. Trends Cell Biol. 2012;22:311–317. doi: 10.1016/j.tcb.2012.03.002. [DOI] [PubMed] [Google Scholar]
- Kemphues K. PARsing embryonic polarity. Cell. 2000;101:345–348. doi: 10.1016/s0092-8674(00)80844-2. [DOI] [PubMed] [Google Scholar]
- Kiekebusch D, Michie KA, Essen LO, Löwe J, Thanbichler M. Localized dimerization and nucleoid binding drive gradient formation by the bacterial cell division inhibitor MipZ. Mol Cell. 2012;46:245–259. doi: 10.1016/j.molcel.2012.03.004. [DOI] [PMC free article] [PubMed] [Google Scholar]
- Kim H, Ishidate T, Ghanta KS, Seth M, Conte D, Jr, Shirayama M, Mello CC. A Co-CRISPR strategy for efficient genome editing in Caenorhabditis elegans. Genetics. 2014;197:1069–1080. doi: 10.1534/genetics.114.166389. [DOI] [PMC free article] [PubMed] [Google Scholar]
- Lipkow K, Odde DJ. Model for protein concentration gradients in the cytoplasm. Cell Mol Bioeng. 2008;1:84–92. doi: 10.1007/s12195-008-0008-8. [DOI] [PMC free article] [PubMed] [Google Scholar]
- Mello CC, Schubert C, Draper B, Zhang W, Lobel R, Priess JR. The PIE-1 protein and germline specification in C. elegans embryos. Nature. 1996;382:710–712. doi: 10.1038/382710a0. [DOI] [PubMed] [Google Scholar]
- Merritt C, Rasoloson D, Ko D, Seydoux G. 3' UTRs are the primary regulators of gene expression in the C. elegans germline. Curr Biol. 2008;18:1476–1482. doi: 10.1016/j.cub.2008.08.013. [DOI] [PMC free article] [PubMed] [Google Scholar]
- Muller P, Rogers KW, Yu SR, Brand M, Schier AF. Morphogen transport. Development. 2013;140:1621–1638. doi: 10.1242/dev.083519. [DOI] [PMC free article] [PubMed] [Google Scholar]
- Nance J, Zallen JA. Elaborating polarity: PAR proteins and the cytoskeleton. Development. 2011;138:799–809. doi: 10.1242/dev.053538. [DOI] [PMC free article] [PubMed] [Google Scholar]
- Nishi Y, Rogers E, Robertson SM, Lin R. Polo kinases regulate C. elegans embryonic polarity via binding to DYRK2-primed MEX-5 and MEX-6. Development. 2008;135:687–697. doi: 10.1242/dev.013425. [DOI] [PubMed] [Google Scholar]
- Ogura K, Kishimoto N, Mitani S, Gengyo-Ando K, Kohara Y. Translational control of maternal glp-1 mRNA by POS-1 and its interacting protein SPN-4 in Caenorhabditis elegans. Development. 2003;130:2495–2503. doi: 10.1242/dev.00469. [DOI] [PubMed] [Google Scholar]
- Oldenbroek M, Robertson SM, Guven-Ozkan T, Spike C, Greenstein D, Lin R. Regulation of maternal Wnt mRNA translation in C. elegans embryos. Development. 2013;140:4614–4623. doi: 10.1242/dev.096313. [DOI] [PMC free article] [PubMed] [Google Scholar]
- Pang KM, Ishidate T, Nakamura K, Shirayama M, Trzepacz C, Schubert CM, Priess JR, Mello CC. The minibrain kinase homolog, mbk-2, is required for spindle positioning and asymmetric cell division in early C. elegans embryos. Dev Biol. 2004;265:127–139. doi: 10.1016/j.ydbio.2003.09.024. [DOI] [PubMed] [Google Scholar]
- Pellettieri J, Reinke V, Kim SK, Seydoux G. Coordinate activation of maternal protein degradation during the egg-to-embryo transition in C. elegans. Dev Cell. 2003;5:451–462. doi: 10.1016/s1534-5807(03)00231-4. [DOI] [PubMed] [Google Scholar]
- Quintin S, Mains PE, Zinke A, Hyman AA. The mbk-2 kinase is required for inactivation of MEI-1/katanin in the one-cell Caenorhabditis elegans embryo. EMBO Rep. 2003;4:1175–1181. doi: 10.1038/sj.embor.7400029. [DOI] [PMC free article] [PubMed] [Google Scholar]
- Reese KJ, Dunn MA, Waddle JA, Seydoux G. Asymmetric segregation of PIE-1 in C. elegans is mediated by two complementary mechanisms that act through separate PIE-1 protein domains. Mol Cell. 2000;6:445–455. doi: 10.1016/s1097-2765(00)00043-5. [DOI] [PubMed] [Google Scholar]
- Rose LS, Kemphues KJ. Early patterning of the C. elegans embryo. Annu Rev Genet. 1998;32:521–545. doi: 10.1146/annurev.genet.32.1.521. [DOI] [PubMed] [Google Scholar]
- Schlaitz A-L, Srayko M, Dammermann A, Quintin S, Wielsch N, MacLeod I, de Robillard Q, Zinke A, Yates JR, 3rd, Müller-Reichert T, et al. The C. elegans RSA complex localizes protein phosphatase 2A to centrosomes and regulates mitotic spindle assembly. Cell. 2007;128:115–127. doi: 10.1016/j.cell.2006.10.050. [DOI] [PMC free article] [PubMed] [Google Scholar]
- Schubert CM, Lin R, de Vries CJ, Plasterk RH, Priess JR. MEX-5 and MEX-6 function to establish soma/germline asymmetry in early C. elegans embryos. Mol Cell. 2000;5:671–682. doi: 10.1016/s1097-2765(00)80246-4. [DOI] [PubMed] [Google Scholar]
- Schwille P, Haupts U, Maiti S, Webb WW. Molecular dynamics in living cells observed by fluorescence correlation spectroscopy with one- and two-photon excitation. Biophys J. 1999;77:2251–2265. doi: 10.1016/S0006-3495(99)77065-7. [DOI] [PMC free article] [PubMed] [Google Scholar]
- Stitzel ML, Cheng KC, Seydoux G. Regulation of MBK-2/Dyrk kinase by dynamic cortical anchoring during the oocyte-to-zygote transition. Curr Biol. 2007;17:1545–1554. doi: 10.1016/j.cub.2007.08.049. [DOI] [PubMed] [Google Scholar]
- Strome S, Wood WB. Immunofluorescence visualization of germ-line-specific cytoplasmic granules in embryos, larvae, and adults of Caenorhabditis elegans. Proc Natl Acad Sci USA. 1982;79:1558–1562. doi: 10.1073/pnas.79.5.1558. [DOI] [PMC free article] [PubMed] [Google Scholar]
- Sulston JE, Schierenberg E, White JG, Thomson JN. The embryonic cell lineage of the nematode Caenorhabditis elegans. Dev Biol. 1983;100:64–119. doi: 10.1016/0012-1606(83)90201-4. [DOI] [PubMed] [Google Scholar]
- Tabara H, Hill RJ, Mello CC, Priess JR, Kohara Y. pos-1 encodes a cytoplasmic zinc-finger protein essential for germline specification in C. elegans. Development. 1999;126:1–11. doi: 10.1242/dev.126.1.1. [DOI] [PubMed] [Google Scholar]
- Tabuse Y, Izumi Y, Piano F, Kemphues KJ, Miwa J, Ohno S. Atypical protein kinase C cooperates with PAR-3 to establish embryonic polarity in Caenorhabditis elegans. Development. 1998;125:3607–3614. doi: 10.1242/dev.125.18.3607. [DOI] [PubMed] [Google Scholar]
- Tenenhaus C, Schubert C, Seydoux G. Genetic requirements for PIE-1 localization and inhibition of gene expression in the embryonic germ lineage of Caenorhabditis elegans. Dev Biol. 1998;200:212–224. doi: 10.1006/dbio.1998.8940. [DOI] [PubMed] [Google Scholar]
- Tenlen JR, Molk JN, London N, Page BD, Priess JR. MEX-5 asymmetry in one-cell C. elegans embryos requires PAR-4- and PAR-1-dependent phosphorylation. Development. 2008;135:3665–3675. doi: 10.1242/dev.027060. [DOI] [PubMed] [Google Scholar]
- Timmons L, Fire A. Specific interference by ingested dsRNA. Nature. 1998;395:854. doi: 10.1038/27579. [DOI] [PubMed] [Google Scholar]
- Updike DL, Hatchey SJ, Kreher J, Strome S. P granules extend the nuclear pore environment in the C. elegans germ line. J Cell Biol. 2011;192:939–948. doi: 10.1083/jcb.201010104. [DOI] [PMC free article] [PubMed] [Google Scholar]
- Updike DL, Knutson AK, Egelhofer TA, Campbell AC, Strome S. Germ-granule components prevent somatic development in the C. elegans germline. Curr Biol. 2014;24:970–975. doi: 10.1016/j.cub.2014.03.015. [DOI] [PMC free article] [PubMed] [Google Scholar]
- Updike D, Strome S. P granule assembly and function in Caenorhabditis elegans germ cells. J Androl. 2010;31:53–60. doi: 10.2164/jandrol.109.008292. [DOI] [PMC free article] [PubMed] [Google Scholar]
- Wang JT, Seydoux G. Germ cell specification. Adv Exp Med Biol. 2013;757:17–39. doi: 10.1007/978-1-4614-4015-4_2. [DOI] [PMC free article] [PubMed] [Google Scholar]
- Wang JT, Smith J, Chen BC, Schmidt H, Rasoloson D, Paix A, Lambrus BG, Calidas D, Betzig E, Seydoux G. Regulation of RNA granule dynamics by phosphorylation of serine-rich, intrinsically disordered proteins in C. elegans. Elife. 2014;3:e04591. doi: 10.7554/eLife.04591. [DOI] [PMC free article] [PubMed] [Google Scholar]
- Wartlick O, Kicheva A, Gonzalez-Gaitan M. Morphogen gradient formation. Cold Spring Harb Perspect Biol. 2009;1:a001255. doi: 10.1101/cshperspect.a001255. [DOI] [PMC free article] [PubMed] [Google Scholar]
- Watts JL, Etemad-Moghadam B, Guo S, Boyd L, Draper BW, Mello CC, Priess JR, Kemphues KJ. par-6, a gene involved in the establishment of asymmetry in early C. elegans embryos, mediates the asymmetric localization of PAR-3. Development. 1996;122:3133–3140. doi: 10.1242/dev.122.10.3133. [DOI] [PubMed] [Google Scholar]
Associated Data
This section collects any data citations, data availability statements, or supplementary materials included in this article.