

Abstract
Objective
Dietary methionine restriction (MR) reduces adiposity, hepatic lipids, and increases overall insulin sensitivity in part by reducing lipogenic gene expression in liver, inducing browning of white adipose tissue (WAT), and enhancing the lipogenic and oxidative capacity of the remodeled WAT.
Methods
Ob/ob mice have compromised β-adrenergic receptor expression in adipose tissue, and were used to test whether MR could ameliorate obesity, insulin resistance, and disordered lipid metabolism.
Results
In contrast to responses in wild type-mice, MR failed to slow accumulation of adiposity, increase lipogenic and thermogenic gene expression in adipose tissue, reduce serum insulin, or increase serum adiponectin in ob/ob mice. However, MR produced comparable reductions in hepatic lipids and lipogenic gene expression in both genotypes. In addition, MR was fully effective in increasing insulin sensitivity in adiponectin−/− mice.
Conclusions
These findings show that diet-induced changes in hepatic lipid metabolism are independent of weight loss and remodeling of WAT, and are not required for insulin sensitization. In contrast, the failure of ob/ob mice to mount a normal thermogenic response to MR suggests that the compromised responsiveness of adipose tissue to SNS input is an important component of the inability of the diet to correct their obesity and insulin resistance.
Keywords: amino acid, obesity, β-adrenergic receptors, leptin, lipid, adiponectin
Introduction
Dietary methionine restriction (MR) produces a highly beneficial metabolic phenotype by increasing energy expenditure (EE), limiting fat deposition, and enhancing insulin sensitivity (1). The sensing and signaling systems that detect and coordinate the developmental progression of these responses are poorly defined, but it has become clear that MR provides regulatory input to multiple tissue-specific transcriptional programs. Recent work makes a compelling case that liver and adipose tissue are key targets of the diet, where the transcriptional responses effectively remodel the integration of lipid metabolism between the two tissues (2–5). For example, the MR diet diminishes the capacity of the liver to synthesize and export lipid, while simultaneously increasing these functions in white adipose tissue (WAT) (2). The respective transcriptional programs were identified by screening differentially expressed genes in each tissue against annotated databases to identify gene set enrichment within canonical pathways. Then an upstream regulator algorithm identified the transcription factors consistent with the observed programmatic changes in gene expression. In liver, the algorithm predicted that sterol regulatory element-binding proteins (SREBP)-1 and SREBP-2 (Srebf1, Srebf2), and carbohydrate response element binding protein (Mlxipl) were functioning as an inhibitory network to down-regulate 28 genes involved in lipid metabolism in response to the diet (2). In inguinal WAT, the algorithm predicted that SREBP-1 and PPARα were activated by the diet and functioning as a network to increase expression of 23 genes involved in lipid metabolism (2). Although the underlying mechanisms are unclear, the observed decreases in hepatic Srebf1, Srebf2, and Mlxipl mRNA expression and reduction in nuclear SREBP-1c expression confirm the prediction of the algorithm for the observed decline in lipogenic capacity (2). In IWAT, the predicted mechanisms are somewhat less ambiguous since several lines of evidence indicate that dietary MR produces a chronic increase in SNS-dependent activation of β-adrenergic receptors in this tissue (6, 7). The morphological remodeling of the depot and increase in catabolic gene expression are characteristic of the observed browning produced by MR in this tissue (2, 6, 7). Although it is well known that cAMP-dependent activation of PKA increases expression of genes such as Ucp1 and Ppargc1a through cAMP response elements in their promoters, it remains unclear how MR produced the observed up-regulation of SREBP1 and PPARα-sensitive genes in IWAT. Recent work has shown that PKA-dependent activation of adipose triglyceride lipase (ATGL) serves the dual purpose of releasing free fatty acids for oxidation but also generating ligands for PPARα and PPARδ (8, 9). The resulting ATGL-mediated transactivation of PPARs is essential to the remodeling of WAT that occurs after chronic activation of β-adrenergic receptors (9). More interestingly, chronic adrenergic activation of adipose tissue produces a simultaneous up-regulation of both lipogenic and oxidative capacity across brown and white adipose depots (9). Therefore, the observed upregulation of PPAR-sensitive genes in IWAT after MR supports the view that the chronic adrenergic stimulation produced by the diet is regulating lipid metabolism through this mechanism (2). In contrast, cross-talk with SREBP1, if it is occurring, remains poorly understood.
The ob/ob mouse is a genetic model of obesity that develops hyperphagia, insulin resistance and disordered lipid metabolism after weaning (10). The mice become obese even when pair-fed to lean littermates, due in part to more frequent entry and defective exit from torpor (11–13). In addition to a nonfunctional leptin gene (14), adipose tissue of ob/ob mice is resistant to mobilization of FFAs by adrenergic stimulation (15, 16). The molecular defect is compromised β3- and β1-adrenergic receptor expression in WAT (17, 18), resulting in minimal cAMP production and PKA activation when adipocytes are stimulated with sympathomimetics (19). Therefore, ob/ob mice were used to test whether this signaling defect would compromise the normal metabolic and transcriptional responses to MR. A broader goal was to test the ability of dietary MR to reverse the development of obesity in these mice. Using ob/ob mice fed the MR diet for 3 months, we show that many but not all of the metabolic and transcriptional responses to MR are compromised in ob/ob mice.
Methods
Animal Studies
Experiment 1
These experiments were reviewed and approved by the Pennington Institutional Animal Care and Use Committee based on guidelines established for the humane care and use of laboratory animals. The study was conducted using singly housed ob/ob mice (B6.Cg-Lepob/J #000632, Jackson Labs, Bar Harbor, ME) and +/? (WT) littermates obtained at ~28 days of age and adapted to the Control diet for one week. Thereafter, 8 animals of each genotype were randomly assigned to receive either the Control diet (0.86% methionine) or a methionine-restricted diet (0.17% methionine) for the subsequent 12 wks. The diets were from Dyets Inc. (Bethlehem, PA) as described previously (6) and were provided ad libitum. At 2 week intervals throughout the study, food consumption was measured over a 48h period. At the beginning and at 7 day intervals, body composition was determined by NMR using a Bruker Mouse Minispec (Bruker Optics, Billerica, MA). The instrument was calibrated to an external standard before each use, and body composition was determined per manufacturer’s instructions. At experiment’s end, animals were fasted for 4h and then sacrificed by decapitation following CO2-induced narcosis. Trunk blood, liver, IWAT, and brown adipose tissue (BAT) were collected and the tissues were snap frozen in liquid nitrogen.
Experiment 2
These experiments were approved by the UT Southwestern Medical Center IACUC. Adiponectin knockout (AdipoQ−/−) mice were generated as previously described (20). Beginning at 6 weeks of age, male AdipoQ−/− mice and WT littermates were fed the control or MR diets as previously described for 8 weeks. Glucose tolerance tests were conducted after a 6h fast as before (20). Mice were fasted for 6h prior to harvesting blood.
Serum Analysis
Insulin and adiponectin were measured using ELISA kits (Millipore; Billerica, MA) in serum obtained from trunk blood postmortem.
Hepatic Triglyceride Analysis
Livers (~50 mg) were homogenized in 10 volumes of 0.5% Triton-X 100 using a Polytron homogenizer, followed by centrifugation for 5min at maximum speed. Triglyceride content was determined using a glycerol assay (21) after alkaline saponification of the supernatant.
Western Blot Analysis
Pulverized livers of mice, were lysed in RIPA buffer [50mM Tris, pH 7.4, 150mM NaCl, 1mM EDTA, 1% NP40, protease and phosphatase inhibitor mixes (Pierce, Thermo Fisher Scientific Inc., Rockford, IL)], aspirated 3 times with a 20G needle and centrifuged at 10,000 rpm for 10min. Protein concentration was determined using Lowry assay. For western blot analysis, denatured tissue lysates (15μg) were separated on a 12.5% criterion gel (Biorad, Hercules, CA), transferred onto a PVDF membrane (Biorad) (12V, overnight), and then probed with a FAS antibody (Santa Cruz, sc-48357; Santa Cruz, CA). To normalize FAS expression, membranes were re-probed with β-actin antibody (Sigma, St. Louis, MO). After incubations with anti-mouse secondary antibody, signals were detected using ECL (GE). Image J was used for densitometry measurements.
RNA Isolation and Real-time PCR
Total RNA was isolated from frozen mouse livers, IWAT, and RPWAT using an RNeasy Mini Kit (QIAGEN Inc., Valencia, CA). Two micrograms of total RNA were reverse transcribed to produce complementary DNA. Gene expression was measured by RT-PCR in an ABI Prism 7900HT (Applied Biosystems, Foster City, CA). 2-ΔΔCT method was used to determine relative change of expression between livers of control- and MR-fed mice. Primer sequences are listed in Table 1.
Table 1.
primer sequences for qPCR
| Symbol | Name | Primer sequences |
|---|---|---|
| Scd1 | Stearoyl-CoA desaturase-1 | Forward: 5′-GTGCCGTGGGCGAGGGCTTC-3′ Reverse: 5′-AGCCCAAAGCTCAGCTACTCTT-3′ |
| Fasn | Fatty Acid synthase | Forward: 5′-TCCTGGAACGAGAACACGATCT-3′ Reverse: 5′-GAGACGTGTCACTCCTGGACTTG-3′ |
| Acaca | Acetyl-CoA carboxylase-1 | Forward: 5′-CTCACCCAACCCAGAAAGGCCAA-3′ Reverse: 5′-CAGGATCAGCTGGGATACTGAGT-3′ |
| Ucp1 | Uncoupling protein 1 | Forward: 5′-GAT CCA AGG TGA AGG CCA GG-3′ Reverse: 5′-GTT GAC AAG CTT TCT GTG GTG G-3′ |
| Adrb3 | β3-adrenergic receptor | Forward: 5′-CCAGCCAGCCCTGTTGA-3′ Reverse: 5′-GGACGCGCACCTTCATAGC-3′ |
| Ppargc1a | Peroxisome proliferator-activated receptor gamma coactivator 1-alpha | Forward: 5′-TGC CAT TGT TAA GAC CGA G-3′ Reverse: 5′-GGT CAT TTG GTG ACT CTG G-3′ |
| Fgf21 | Fibroblast growth factor 21 | Forward: 5′-TGACACCCAGGATTTGAATGAC-3′ Reverse: 5′-GCAGCCAATGATGTGTGCTTAC-3′ |
| Ppia | cyclophilin | Forward: 5′-CTT CGA GCT GTT TGC AGA CAA AGT-3′ Reverse: 5′-AGA TGC CAG GAC CTG TAT GCT-3′ |
Statistics
Data were obtained from 16 ob/ob and 16 lean littermates, equally divided between the diets. Changes in body weight, adiposity and food consumption over time were analyzed within genotype using multiple t tests with the Holm-Sidak correction for multiple comparisons, and glucose tolerance tests were compared based on the area under the curves. Protection against type I errors was set at 5% (α=0.05).
Results
The inhibitory effect of MR on weight gain was detected in WT mice after 18 days on the MR diet, and the differences expanded over the subsequent 9 weeks of the study (Fig. 1A). The body composition of WT mice on the respective diets was indistinguishable for the first 3 weeks, but at 4 weeks the adiposity of the two groups began to diverge (Fig. 1B). While adiposity of mice on the control diet increased steadily from 14% to 34% over the 12 week study, the increase in adiposity of WT mice on the MR diet was limited to 4% over the same period (Fig. 1B). WT mice on the MR diet also consumed more food than mice on the control diet. After 2 weeks and at all subsequent times, weight-adjusted food consumption was significantly higher in WT mice on the MR compared to the control diet (Fig. 1C). The difference was ~40% at 2 weeks and at all subsequent time point. In contrast to WT mice, body weights of ob/ob mice on each diet did not differ at the beginning or at any subsequent time point for the duration of the study (Fig. 1A). Adiposity of the ob/ob mice at the beginning of the study (e.g., 32 days) was ~49% and increased to ~58% in both treatment groups over the subsequent 4 weeks (Fig. 1B). And although body weight continued to increase in both groups over the final 8 weeks of the study, adiposity stayed nearly constant around 58% in both groups (Fig. 1B). Food consumption was significantly higher in ob/ob mice on the MR compared to the control diet at the 2 week time point, but at each subsequent interval food consumption was indistinguishable between the groups (Fig. 1C). Together, these data show that dietary MR was unable to reverse or slow the development of post weaning obesity in ob/ob mice. In contrast, the MR diet significantly limited the normal post weaning increases in adiposity in WT mice despite the significant increase in food consumption in the MR group during the entire study.
Figure 1.

MR does not affect body weight and adiposity in ob/ob mice. WT and ob/ob mice were fed either control (CON) or methionine-restricted (MR) diet for 12 weeks. Body weights (A), adiposity (B), and food intake (C) in WT and ob/ob mice were measured over the course of 12 weeks. Data are presented as mean ±SEM (N=8) for each group and means annotated with asterisks differ at P<0.05 within genotype.
To evaluate the impact of altered signaling through β-adrenergic receptors in adipose tissue, real time PCR was used to examine a number of transcriptional responses that are known to be regulated by MR in inguinal WAT. Dietary MR significantly increased mRNA expression of Scd1 (Fig. 2A), Fasn (Fig. 2B), Acaca (Fig. 2C), Ucp1 (Fig. 2D), Ppargc1a (Fig. 2F), and Adrb3 (Fig. 2G) in IWAT of WT mice, but in each instance MR failed to change mRNA levels for any of these genes in ob/ob mice. The first three genes code enzymes for the rate limiting steps in fatty acid synthesis and triglyceride assembly, and were increased by 2- to 3-fold in WT mice. The expression levels of these three genes were comparable in WT and ob/ob mice on the control diet. Expression of the thermogenic gene, Ucp1 was also comparable between the genotypes in mice on the control diet, but in this case MR increased mRNA levels by 10-fold in IWAT of WT mice (Fig. 2D). Ppargc1a, a transcriptional co-activator and marker of browning in WAT, was increased 2-fold by MR in WT but not in ob/ob mice (Fig. 2E). Adrb3 mRNA, which codes for the β3-adrenergic receptor, was increased by 2-fold in the WT group. In contrast, Adrb3 mRNA was nearly undetectable in ob/ob mice on the control diet and was unaffected by MR (Fig. 2F). In BAT, MR produced a significant increase in Ucp1 mRNA in the WT group but no detectable change was attributable to the diet in ob/ob mice (Fig 2G). Collectively, these data show that neither of the transcriptional programs (e.g., lipogenesis, thermogenesis) that are normally induced by dietary MR in IWAT was responsive to the diet in ob/ob mice. Induction of the thermogenic gene, Ucp1 was also compromised in BAT of ob/ob mice.
Figure 2.

MR has no effect on expression of target genes in adipose tissue of ob/ob mice. Expression of lipogenic genes [Scd1(A), Fasn (B), Acaca (C)], UCP1 (D), Ppargc1a (E), and Adrb3 (F) in IWAT, and UCP1 in BAT (G) was compared between WT and ob/ob mice fed either control or MR diet for 12 weeks. Data are presented as mean ±SEM (N=8), and means annotated with different letters differ at P<0.05.
The MR diet reduced liver triglyceride to comparable levels in both genotypes (Fig. 3A) despite the fact that baseline levels were 3-fold higher in ob/ob mice on the control diet. The net reduction (3-fold) was larger in ob/ob mice than WT mice (2-fold), but the difference is mainly attributable to the higher basal triglyceride levels in ob/ob mice (Fig. 3A). Examination of key genes involved in de novo lipogenesis and triglyceride synthesis showed that dietary MR produced comparable reductions in Scd1, Acaca, and Fasn mRNA in both genotypes (Figs. 3B, 3C, 3D). Fig. 3E shows that the diet-induced decrease in Fasn mRNA was paralleled by comparable decreases (P<0.05) in FASN protein expression by the diet in both genotypes. As noted previously (1), MR produced an increase in hepatic Fgf21 mRNA in WT mice, but the effect of MR in ob/ob mice did not reach significance (Fig. 3F). This was primarily explained by the elevated expression of Fgf21 mRNA in ob/ob mice on the control diet (Fig. 3F). Together, these findings show that dietary MR was equally effective in livers of WT and ob/ob mice, producing comparable reductions in expression of the 3 key determinants of lipogenic capacity within the liver. Consequently, dietary MR reduced hepatic triglyceride levels in both genotypes, fully reversing the hepatic steatosis in ob/ob mice.
Figure 3.

The effect of MR on hepatic triglyceride levels, lipogenic genes and FGF21 in WT and ob/ob mice. Hepatic triglyceride concentration (A), Scd1 mRNA (B), Acaca mRNA (C), Fasn mRNA (D) FASN protein (E) and FGF21 mRNA (F) were measured as described in Materials and Methods. Data are presented as mean ±SEM (n=8), and means annotated with different letters differ at P<0.05.
Two endocrine responses normally produced by dietary MR include increased plasma adiponectin and reductions in fasting insulin (6, 22). In WT mice, dietary MR increased plasma adiponectin by 2.5-fold (Fig. 4A) and reduced fasting insulin by 3-fold (Fig. 4B). Plasma adiponectin in WT and ob/ob mice on the control diet did not differ, but in contrast to WT mice, MR failed to increase adiponectin in the ob/ob group. In animals on the control diet, fasting insulin was 5-fold higher in ob/ob mice than WT mice, indicative of the significant insulin resistance that develops in ob/ob mice after weaning (23). And in contrast to WT mice, dietary MR had no discernible effect on fasting insulin in the ob/ob group (Fig. 4B). These findings indicate that in ob/ob mice, MR was unable to increase circulating levels of the insulin-sensitizing hormone, adiponectin, or reduce the elevated fasting insulin levels.
Figure 4.

MR modulates serum adiponectin (A) and insulin (B) concentrations in WT but not in ob/ob mice. Data are presented as mean ±SEM (N=8), and means annotated with different letters differ at P<0.05.
To explore the role of adiponectin as a potential mediator of the insulin-sensitizing effects of dietary MR, surrogate measures of insulin sensitivity were evaluated in mice lacking the gene for adiponectin. MR inhibited weight gain in both WT and AdipoQ−/− mice (Fig. 5A). Fig. 5B shows that the ability of dietary MR to reduce fasting insulin was not compromised in AdipoQ−/− mice. If anything, the reduction in fasting insulin by MR was somewhat larger in AdipoQ−/− mice than WT mice. There were slight differences in glucose tolerance between WT and AdipoQ−/− mice on the control diet as previously reported (20), but in both genotypes, dietary MR produced a significant and comparable increase in glucose tolerance (Fig. 5C). Considered together, the data make a compelling case that adiponectin is not required and is not a mediator of the increase in insulin sensitivity produced by dietary MR.
Figure 5.
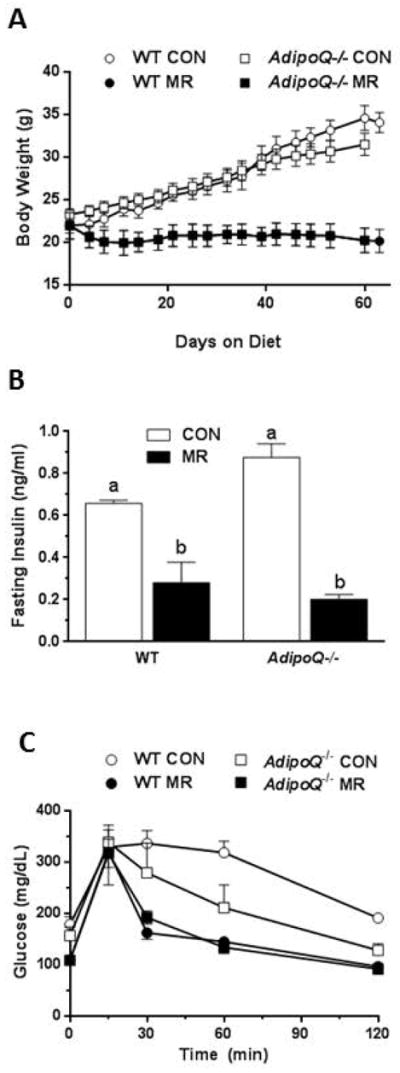
Adiponectin does not play a role in MR’s effect on body weight and serum insulin. WT mice and mice lacking adiponectin (AdipoQ−/− mice) were fed MR diet for 8 weeks. Body weights (A), serum insulin (B), and glucose tolerance (C) were measured in WT and AdipoQ−/− mice on either control or MR diet. Data are presented as mean ±SEM, and means annotated with different letters differ at P<0.05.
Discussion
Dietary MR induces a coordinated series of transcriptional programs in peripheral tissues that are ultimately translated into effects on energy balance and improved overall insulin sensitivity (1, 2, 6, 7). In the present study, MR-induced changes in food intake, adiposity, insulin, adiponectin, and transcriptional effects in WAT were absent in ob/ob mice, whereas changes in the expression of hepatic lipogenic genes were preserved. Thus the goal of the present work is to gain a better understanding of how MR produces its effects by understanding why some of its effects were compromised in these mice. Ob/ob mice become hyperphagic and obese after weaning, but they also develop a number of endocrine and signaling defects that are secondary to the absence of leptin (14, 24, 25). The higher metabolic efficiency, defective thermoregulatory thermogenesis, and compromised induction of Ucp1 in BAT of ob/ob mice (11, 26) was originally attributed to lower norepinephrine turnover in BAT (27). However, more recent studies found normal norepinephrine turnover in BAT of ob/ob mice (28, 29), suggesting instead that compromised expression of β-adrenergic receptors (17, 18, 30) would limit the efficacy of SNS input in both BAT and WAT. Given that dietary MR regulates thermogenic gene expression by activating the SNS (6, 7), it is not surprising that induction of Ucp1in adipose tissue from ob/ob mice was muted. The significance of this finding should not be underestimated, as recent work from our lab has shown that dietary MR is unable to increase energy expenditure and limit fat deposition in mice lacking Ucp1 (31). Together, we interpret the inability of dietary MR to increase Ucp1 in BAT and WAT of ob/ob mice as being a significant contributor to the inability of the diet to limit adipose tissue expansion in these mice.
An important unresolved question is whether refractoriness to SNS input is the only cause for failure of MR to increase Ucp1 expression. Perhaps activation of the SNS by MR was also muted. The mechanisms underlying SNS activation by MR are unknown at present, but recent work showing that FGF21 acts centrally to increase SNS outflow (32) suggests that MR-dependent activation of hepatic transcription and release of FGF21 is a likely mechanism (1, 33). Together these findings support a mechanism where MR-dependent increases in hepatic FGF21 drive SNS stimulation of adipose tissue. FGF21 also acts directly on white adipocytes to induce browning (34) and enhance insulin-dependent glucose uptake (1). Thus, although MR failed to significantly increase hepatic Fgf21 mRNA in ob/ob mice in the current study, their high basal expression suggests that FGF21 was not a limiting factor. Together, our data support a model in which low expression of β-adrenergic receptors in adipose tissue is important for the failure of MR to increase thermogenic genes in ob/ob mice.
Compromised activation of β-adrenergic receptors and downstream PKA-dependent targets also has the potential to affect genes in addition to those with cAMP response elements in their promoters. For example, work from Granneman’s lab (8, 9, 35) has shown that PKA-dependent activation of hormone-sensitive lipase and ATGL serve the dual function of mobilizing fatty acids for oxidation and generating ligands that activate PPARα and PPARδ. The activated PPARs transactivate additional programs that remodel the capacity of adipocytes to both synthesize and oxidize lipids (9). Analysis of the transcriptional responses to MR in IWAT identified a coordinately upregulated set of genes linked to activation of PPARα (2). Therefore, we suggest that the failure of MR to upregulate a subset of these lipogenic genes in IWAT of ob/ob mice may also be tied back to defective processing of β-adrenergic signals in these cells.
The major transcriptional effect of MR in liver is to coordinately downregulate the lipogenic capacity of the tissue (2, 4, 36). Using an upstream regulator algorithm designed to identify transcription factor involvement in observed patterns of gene expression, the algorithm identified an inhibitory network in the liver (2). The biological processes being down-regulated by this network were fatty acid and triglyceride synthesis, and surprisingly, despite the elevated hepatic triglyceride levels in ob/ob mice, dietary MR corrected their hepatic steatosis and significantly reduced the expression of Scd1, Acaca, and Fasn mRNA. Our previous work identified Srebf1, Srebf2, and Mlxipl as the transcription factors being negatively regulated by MR (2), but did not address the mechanism of their regulation. A likely possibility is essential amino acid signaling, identified in HepG2 cells where culturing in media lacking any single essential amino acid resulted in decreased expression of Fasn (37). Restricting the availability of essential amino acids limits charging of tRNA with its cognate amino acid and activates signaling through general control nondepressible 2 (GCN2) (38). It remains unclear whether GCN2 is the nutrient sensor of MR that is responsible for down regulating lipogenic genes in the liver, but whatever the mechanism, our current data establish that the mechanism is fully intact in ob/ob mice.
Our findings that restricting dietary methionine to 0.17% in the diet modulates expression of hepatic lipogenic genes in ob/ob mice without affecting body weight are novel. Recent work (39) employed a more severe restriction of methionine (e.g., 0.12% methionine) in ob/ob mice and found that it reduced body weight, reversed the severity of hepatic steatosis, and reduced the expression of hepatic lipogenic genes. Adipose tissue accretion in ob/ob mice on the 0.12% methionine diet appears to have continued unimpaired, with the loss of body weight occurring at the expense of lean tissue (39). A second difference from our study is the 50% reduction in serum insulin produced by the 0.12% methionine diet (39) where we saw no reduction in insulin with the lesser degree of MR (0.17% methionine). This difference suggests that the weight loss obtained with the 0.12% methionine diet, despite no accompanying reduction in adiposity, afforded some improvement in overall insulin sensitivity. Since we saw equivalent reduction in hepatic lipids as Malloy et al. (39) without a reduction in fasting insulin, we conclude that the reduction in hepatic lipids obtained with both diets had little effect on overall insulin sensitivity.
Given the established insulin-sensitizing properties of adiponectin (20), the failure of dietary MR to increase serum adiponectin in ob/ob mice suggests the possibility that adiponectin may mediate the insulin-sensitizing effects of dietary MR. However, in mice lacking adiponectin, dietary MR produced an equivalent reduction in fasting insulin and improvement in glucose tolerance. Together, these findings establish that adiponectin does not mediate the improvements in insulin sensitivity produced by MR.
What is already known about this subject?
Methionine restriction improves insulin sensitivity and hepatic lipid profile, and reduces adiposity.
Methionine restriction results in weight maintenance despite increased food intake.
The methionine restriction-induced increase in energy expenditure may be the result of increased β-adrenergic input into adipose tissue.
What does your study add?
Methionine restriction improves the hepatic lipid profile independent of insulin sensitivity, weight, and adiposity in ob/ob mice.
Impaired β-adrenergic input in ob/ob mice correlates with a lack of adipose tissue response to methionine restriction.
Adiponectin does not play a role in mediating the insulin-sensitizing effects of methionine restriction.
Acknowledgments
This work was supported in part by ADA 1-12-BS-58 (TWG), NIH DK-096311 (TWG). This work also made use of the Genomics Core Facility supported by NIH P20-GM103528 (TWG) and NIH 2P30 DK072476. This research project used the Transgenic and Animal Phenotyping core facilities that are supported in part by the NORC (NIH 2P30 DK072476) center grant from the NIH (RLM). DW is supported by NIH NRSA 1 F32 DK098918.
Footnotes
Disclosure: The authors have no conflicts of interest to disclose.
Reference List
- 1.Stone KP, Wanders D, Orgeron M, Cortez CC, Gettys TW. Mechanisms of Increased in Vivo Insulin Sensitivity by Dietary Methionine Restriction in Mice. Diabetes. 2014;63:3721–33. doi: 10.2337/db14-0464. [DOI] [PMC free article] [PubMed] [Google Scholar]
- 2.Hasek BE, Boudreau A, Shin J, et al. Remodeling the integration of lipid metabolism between liver and adipose tissue by dietary methionine restriction in rats. Diabetes. 2013;62:3362–72. doi: 10.2337/db13-0501. [DOI] [PMC free article] [PubMed] [Google Scholar]
- 3.Perrone CE, Mattocks DA, Hristopoulos G, Plummer JD, Krajcik RA, Orentreich N. Methionine restriction effects on 11-HSD1 activity and lipogenic/lipolytic balance in F344 rat adipose tissue. J Lipid Res. 2008;49(1):12–23. doi: 10.1194/jlr.M700194-JLR200. [DOI] [PubMed] [Google Scholar]
- 4.Perrone CE, Mattocks DA, Jarvis-Morar M, Plummer JD, Orentreich N. Methionine restriction effects on mitochondrial biogenesis and aerobic capacity in white adipose tissue, liver, and skeletal muscle of F344 rats. Metabolism. 2009;59:1000–11. doi: 10.1016/j.metabol.2009.10.023. [DOI] [PubMed] [Google Scholar]
- 5.Perrone CE, Mattocks DA, Plummer JD, et al. Genomic and Metabolic Responses to Methionine-Restricted and Methionine-Restricted, Cysteine-Supplemented Diets in Fischer 344 Rat Inguinal Adipose Tissue, Liver and Quadriceps Muscle. J Nutrigenet Nutrigenomics. 2012;5(3):132–57. doi: 10.1159/000339347. [DOI] [PubMed] [Google Scholar]
- 6.Hasek BE, Stewart LK, Henagan TM, et al. Dietary methionine restriction enhances metabolic flexibility and increases uncoupled respiration in both fed and fasted states. Am J Physiol Regul Integr Comp Physiol. 2010;299:R728–R739. doi: 10.1152/ajpregu.00837.2009. [DOI] [PMC free article] [PubMed] [Google Scholar]
- 7.Plaisance EP, Henagan TM, Echlin H, et al. Role of β-adrenergic receptors in the hyperphagic and hypermetabolic responses to dietary methionine restriction. Am J Physiol Regul Integr Comp Physiol. 2010;299:R740–R750. doi: 10.1152/ajpregu.00838.2009. [DOI] [PMC free article] [PubMed] [Google Scholar]
- 8.Mottillo EP, Bloch AE, Leff T, Granneman JG. Lipolytic products activate peroxisome proliferator-activated receptor (PPAR) alpha and delta in brown adipocytes to match fatty acid oxidation with supply. J Biol Chem. 2012;287(30):25038–48. doi: 10.1074/jbc.M112.374041. [DOI] [PMC free article] [PubMed] [Google Scholar]
- 9.Mottillo EP, Balasubramanian P, Lee YH, Weng C, Kershaw EE, Granneman JG. Coupling of lipolysis and de novo lipogenesis in brown, beige, and white adipose tissues during chronic beta3-adrenergic receptor activation. J Lipid Res. 2014;55(11):2276–86. doi: 10.1194/jlr.M050005. [DOI] [PMC free article] [PubMed] [Google Scholar]
- 10.Thurlby PL, Trayhurn P. The development of obesity in preweanling obob mice. Br J Nutr. 1978;39:397–402. doi: 10.1079/bjn19780050. [DOI] [PubMed] [Google Scholar]
- 11.Thurlby PL, Trayhurn P. The role of thermoregulatory thermogenesis in the development of obesity in genetically-obese (ob/ob) mice pair-fed with lean siblings. Br J Nutr. 1979;42(3):377–85. doi: 10.1079/bjn19790127. [DOI] [PubMed] [Google Scholar]
- 12.Swoap SJ, Weinshenker D. Norepinephrine controls both torpor initiation and emergence via distinct mechanisms in the mouse. PLoS ONE. 2008;3(12):e4038. doi: 10.1371/journal.pone.0004038. [DOI] [PMC free article] [PubMed] [Google Scholar]
- 13.Himms-Hagen J. Food restriction increases torpor and improves brown adipose tissue thermogenesis in ob/ob mice. Am J Physiol. 1985;248(5 Pt 1):E531–E539. doi: 10.1152/ajpendo.1985.248.5.E531. [DOI] [PubMed] [Google Scholar]
- 14.Zhang Y, Proenca R, Maffei M, Barone M, Leopold L, Friedman JM. Positional cloning of the mouse obese gene and its human homologue. Nature. 1994;372:425–32. doi: 10.1038/372425a0. [DOI] [PubMed] [Google Scholar]
- 15.Marshall NB, Engel FL. The influence of epinephrine and fasting on adipose tissue content and release of free fatty acids in obese-hyperglycemic and lean mice. J Lipid Res. 1960;1:339–42. [Google Scholar]
- 16.Begin-Heick N, Heick HM. Increased response of adipose tissue of the ob/ob mouse to the action of adrenaline after treatment with thyroxin. Can J Physiol Pharmacol. 1977;55:1320–9. doi: 10.1139/y77-177. [DOI] [PubMed] [Google Scholar]
- 17.Collins S, Daniel KW, Rohlfs EM, Ramkumar V, Taylor IL, Gettys TW. Impaired expression and functional activity of the β-3 and β-1 adrenergic receptor in adipose tissue of congenitally obese (C57BLJ6-ob/ob) mice. Mol Endocrinol. 1994;8:518–27. doi: 10.1210/mend.8.4.7914350. [DOI] [PubMed] [Google Scholar]
- 18.Gettys TW, Watson PM, Seger L, Padgett M, Taylor IL. Adrenalectomy after weaning restores β3-adrenergic receptor expression in white adipocytes from C57BL/6J mice. Endocrinology. 1997;138:2697–704. doi: 10.1210/endo.138.7.5283. [DOI] [PubMed] [Google Scholar]
- 19.Gettys TW, Ramkumar V, Uhing RJ, Seger L, Taylor IL. Alterations in mRNA levels, expression, and function of GTP-binding regulatory proteins in adipocytes from obese mice (C57BL/6J-ob/ob) J Biol Chem. 1991;266:15949–55. [PubMed] [Google Scholar]
- 20.Nawrocki AR, Rajala MW, Tomas E, et al. Mice lacking adiponectin show decreased hepatic insulin sensitivity and reduced responsiveness to peroxisome proliferator-activated receptor gamma agonists. J Biol Chem. 2006;281(5):2654–60. doi: 10.1074/jbc.M505311200. [DOI] [PubMed] [Google Scholar]
- 21.Bucolo G, David H. Quantitative determination of serum triglycerides by the use of enzymes. Clin Chem. 1973;19(5):476–82. [PubMed] [Google Scholar]
- 22.Malloy VL, Krajcik RA, Bailey SJ, Hristopoulos G, Plummer JD, Orentreich N. Methionine restriction decreases visceral fat mass and preserves insulin action in aging male Fischer 344 rats independent of energy restriction. Aging Cell. 2006;5(4):305–14. doi: 10.1111/j.1474-9726.2006.00220.x. [DOI] [PubMed] [Google Scholar]
- 23.Dubuc PU. The development of obesity, hyperinsulinemia, and hyperglycemia in ob/ob mice. Metabolism. 1976;25:1567–74. doi: 10.1016/0026-0495(76)90109-8. [DOI] [PubMed] [Google Scholar]
- 24.Bray GA, York DA. Genetically transmitted obesity in rodents. Physiol Rev. 1979;51:598–646. doi: 10.1152/physrev.1971.51.3.598. [DOI] [PubMed] [Google Scholar]
- 25.Dubuc PU. Thyroid hormone responses to feeding in ob/ob mice. Horm Metab Res. 1989;21:546–9. doi: 10.1055/s-2007-1009284. [DOI] [PubMed] [Google Scholar]
- 26.Reichling S, Patel HV, Freeman KB, Kates A-L, Himms-Hagen J. Attenuated cold-induced increase in mRNA for uncoupling protein in brown adipose tissue of obese (ob/ob) mice. Biochem Cell Biol. 1988;66:193–8. doi: 10.1139/o88-026. [DOI] [PubMed] [Google Scholar]
- 27.Thurlby PL, Trayhurn P, James WP. An explanation for the elevated efficiency of the genetically obese (obob) mouse. Proc Nutr Soc. 1978;37:55A. [PubMed] [Google Scholar]
- 28.Knehans AW, Romsos DR. Norepinephrine turnover in obese (ob/ob) mice: effects of age, fasting, and acute cold. Am J Physiol. 1983;244:E567–74. doi: 10.1152/ajpendo.1983.244.6.E567. [DOI] [PubMed] [Google Scholar]
- 29.Zaror-Behrens G, Himms-Hagen J. Cold-stimulated sympathetic activity in brown adipose tissue of obese (ob/ob) mice. Am J Physiol. 1983;244:E361–E366. doi: 10.1152/ajpendo.1983.244.4.E361. [DOI] [PubMed] [Google Scholar]
- 30.Gettys TW, Watson PM, Taylor IL, Collins S. RU-486 (Mifepristone) ameliorates diabetes but does not correct deficient β-adrenergic signaling in adipocytes from mature C57BL/6J-ob/ob mice. Int J Obesity. 1997;21:865–73. doi: 10.1038/sj.ijo.0800479. [DOI] [PubMed] [Google Scholar]
- 31.Wanders D, Burk DH, Cortez CC, et al. UCP1 is an essential mediator of the effects of methionine restrictin on energy balance but not insulin sensitivity. FASEB Journal. 2015;29(June 2015):1–13. doi: 10.1096/fj.14-270348. [DOI] [PMC free article] [PubMed] [Google Scholar]
- 32.Owen BM, Ding X, Morgan DA, et al. FGF21 Acts Centrally to Induce Sympathetic Nerve Activity, Energy Expenditure, and Weight Loss. Cell Metab. 2014;20:670–7. doi: 10.1016/j.cmet.2014.07.012. [DOI] [PMC free article] [PubMed] [Google Scholar]
- 33.Ables GP, Perrone CE, Orentreich D, Orentreich N. Methionine-Restricted C57BL/6J Mice Are Resistant to Diet-Induced Obesity and Insulin Resistance but Have Low Bone Density. PLoS ONE. 2012;7(12):e51357. doi: 10.1371/journal.pone.0051357. [DOI] [PMC free article] [PubMed] [Google Scholar]
- 34.Fisher FM, Kleiner S, Douris N, et al. FGF21 regulates PGC-1alpha and browning of white adipose tissues in adaptive thermogenesis. Genes Dev. 2012;26(3):271–81. doi: 10.1101/gad.177857.111. [DOI] [PMC free article] [PubMed] [Google Scholar]
- 35.Mottillo EP, Shen XJ, Granneman JG. Role of hormone-sensitive lipase in beta-adrenergic remodeling of white adipose tissue. Am J Physiol Endocrinol Metab. 2007;293(5):E1188–E1197. doi: 10.1152/ajpendo.00051.2007. [DOI] [PubMed] [Google Scholar]
- 36.Ghosh S, Wanders D, Stone KP, Van NT, Cortez CC, Gettys TW. A systems biology analysis of the unique and overlapping transcriptional responses to caloric restriction and dietary methionine restriction in rats. FASEB J. 2014;28:2577–90. doi: 10.1096/fj.14-249458. [DOI] [PMC free article] [PubMed] [Google Scholar]
- 37.Dudek SM, Semenkovich CF. Essential amino acids regulate fatty acid synthase expression through an uncharged transfer RNA-dependent mechanism. J Biol Chem. 1995;270(49):29323–9. doi: 10.1074/jbc.270.49.29323. [DOI] [PubMed] [Google Scholar]
- 38.Anthony TG, McDaniel BJ, Byerley RL, et al. Preservation of liver protein synthesis during dietary leucine deprivation occurs at the expense of skeletal muscle mass in mice deleted for eIF2 kinase GCN2. J Biol Chem. 2004;279(35):36553–61. doi: 10.1074/jbc.M404559200. [DOI] [PubMed] [Google Scholar]
- 39.Malloy VL, Perrone CE, Mattocks DA, et al. Methionine restriction prevents the progression of hepatic steatosis in leptin-deficient obese mice. Metabolism. 2013;(13):10. doi: 10.1016/j.metabol.2013.06.012. [DOI] [PubMed] [Google Scholar]