

Abstract
Background
The findings of epidemiologic studies on the association between fiber intake and prostate cancer risk remain conflicting. We aimed to examine this association by conducting a meta-analysis of epidemiological studies.
Methods
Relevant studies were identified by PubMed (1966 to March 2015) and Embase (1974 to March 2015) database search through March 2015. We included epidemiological studies that reported relative risks (RRs) or odds ratios (ORs) with 95 % confidence intervals (CIs) for the association between dietary fiber intake and prostate cancer risk. Random effects models were used to calculate the summary risk estimates.
Results
For the highest compared with the lowest dietary fiber intake, a significantly decreased risk with prostate cancer was observed in case-control studies (OR = 0.82; 95 % CI, 0.68–0.96), but not in cohort studies (RR = 0.94; 95 % CI, 0.77–1.11). The combined risk estimate of all studies was 0.89 (95 % CI, 0.77, 1.01). A significant heterogeneity was observed across studies (p = 0.005). There was no evidence of significant publication bias based on Begg’s funnel plot (p = 0.753) or Egger’s test (p = 0.946).
Conclusions
This meta-analysis suggests the absence of evidence for association between dietary fiber intake and prostate cancer risk.
Keywords: Prostatic neoplasms, Dietary fiber, Meta-analysis, Epidemiology
Background
Prostate cancer is the second most common cancer among men in the world, with 1.1 million new cases diagnosed in 2012 worldwide, accounting for about 7.9 % of all cases of cancer [1]. The high prevalence and incidence of prostate cancer have resulted in a large public health burden. Age and family history are well-established and strong risk factors for prostate cancer [2]. Environmental factors such as diet are believed to play an important role in the prevention of prostate cancer because of the wide international variation in incidence [3].
Although dietary factors have long been suspected to be implicated in the development of prostate cancer, no major modifiable risk factor has been established. During the last few years, increased intake of dietary fibers has been associated with decreased risk of several cancers, such as colorectal, breast, ovarian, and upper aerodigestive tract cancers [4–7]. However, results from epidemiological studies regarding prostate cancer are sparse and inconsistent. The 2007 World Cancer Research Fund (WCRF) Second Expert Report concluded that the data were too inconsistent to draw a conclusion on the association between dietary fiber intake and prostate cancer risk [8]. Since that report was released, five prospective studies have been published on this association [9–13]. To quantitatively assess the accumulated evidence for a role of dietary fiber consumption on prostate cancer risk, we carried out a systematic review and meta-analysis of published epidemiological studies.
Methods
Selection of studies
Two authors performed a computerized blinded search of MEDLINE (1966 to March 2015) and Embase (1974 to March 2015) databases for relevant epidemiologic studies of dietary fiber consumption in relation to the risk of prostate cancer published in English. Additional publications identified by hand-searching of references of retrieved articles were also included. For computer searches, we used the following words in any field: “fiber” or “fibre” combined with “prostate carcinoma” or “prostatic cancer” or “prostate cancer” or “prostatic carcinoma”. Studies were included in the meta-analyses if they presented estimates of the odds ratio (OR) or relative risk (RR) and the corresponding confidence interval (CI) from a case-control or cohort study on the association between fiber intake and incidence of prostate cancer. When multiple reports were published on the same study population, we included the study with the largest number of cases.
Figure 1 gives the flowchart for selection of articles. The primary literature search identified 505 records. After screening the titles and abstracts, 486 articles were excluded because they were either duplicates, review articles, or irrelevant to the current study. Nineteen full-text papers were retrieved. In addition, we included ten studies after reviewing reference lists of retrieved articles or preceding reviews. Twelve studies [14–25] were excluded mostly because of insufficient information to compute its RR or OR and 95 % CI. Finally, we identified 5 prospective studies [9–13] and 12 case-control studies [26–37] with data that were eligible for inclusion in the meta-analysis.
Fig. 1.
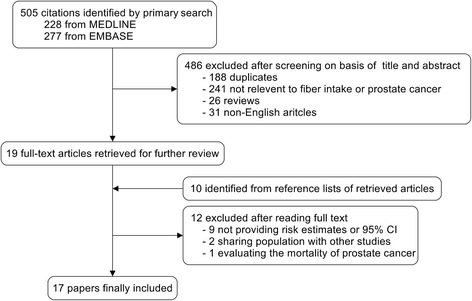
Flowchart of study selection
Data extraction and classification
The following pieces of information were extracted from published studies: the name of the first author, the year of publication, the country in which the study was conducted, study design, year of follow-up (cohort studies), year of data collection (case-control studies), sample size, evaluation of exposures, the RR or OR and its 95 % CIs, exposure assessment and range of exposure, and adjusted covariates. Data extraction was conducted independently by two authors, with disagreements resolved by consensus. Considering that prostate cancer is a relatively rare disease, the RR was assumed approximately the same as OR, and the OR was used as the study outcome. If a study provided several ORs, we extracted the ORs reflecting the greatest degree of control for potential confounders. Oishi et al. [26] presented two ORs for benign prostatic hyperplasia (BPH) and hospital controls, respectively. We chose the risk estimate comparing prostate cancer with hospital controls instead of BPH because it may increase the chance of diagnosing an incidental prostate cancer [38].
Quality assessment
The study quality was assessed using the nine-star Newcastle-Ottawa Scale (The Newcastle-Ottawa Scale for assessing the quality of nonrandomized studies in meta-analyses. Ottawa, Canada: Dept of Epidemiology and Community Medicine, University of Ottawa. http://www.ohri.ca/programs/clinical_epidemiology/oxford.htm). NOS is an eight-item instrument that allows for the assessment of the patient selection, study comparability, and exposure (for case-control study) or outcome (for cohort study). The range of possible scores is 0–9. The study with score more than 6 was considered of high quality.
Statistical analysis
We used random effects models to calculate summary ORs and 95 % CIs for the highest vs. the lowest levels of dietary fiber because it used a combination of within-study variance and between-study variance for computing weights. We evaluated the heterogeneity among studies with the Cochrane Q test [39] and I2 score [40]. We also estimated the 95 % prediction interval, which further accounts for between-study heterogeneity and evaluates the uncertainty for the effect that would be expected in a new study addressing that same association [41]. To explore the sources of heterogeneity across studies, subgroup analyses were conducted according to study design, study quality, geographic region, and method of dietary assessment. Because adjustments for confounding factors were not consistent between the studies, we also conducted the subgroup analysis according to whether the risk estimates had been adjusted for family history of prostate cancer, body mass index (BMI), and total energy intake. In addition, we further performed a sensitivity analysis to explore sources of heterogeneity. Each study was omitted at a time to assess robustness of the results. In addition to those methods, the Galbraith plot was also used to detect the possible sources of heterogeneity, and a re-analysis was conducted with exclusion of the studies possibly causing the heterogeneity. Meta-regression was also applied to measure the subgroup interaction. The p value for interaction between two groups is the comparison of subgroup vs. the other. We used p < 0.10 as the indicator of significant interaction. Publication bias was assessed by Begg’s [42] and Egger’s [43] test. All analyses were performed by using STATA version 11.0 (StataCorp). A p value < 0.05 was considered significant.
Results
The characteristics of these studies and the variables evaluated are listed in Table 1. Six studies were conducted in North America [10, 31, 33, 34, 36, 37], seven in Europe [9, 11, 12, 28, 30, 32, 35], two in Japan [13, 26], one in South Africa [27], and one in Uruguay [29]. Overall, this meta-analysis included more than 8000 cases of prostate cancer. Information on fiber intake was obtained by interview or self-administered questionnaire using food frequency questionnaires (FFQ) except one using 24-h dietary record [12]. All of the included studies adjusted for age, and 14 of them included adjustment for energy intake [6, 9–13, 28–31, 33–36], 8 adjusted for family history [6, 10, 12, 29–31, 36, 37], and 8 adjusted for BMI [10, 12, 13, 29, 30, 33, 36, 37].
Table 1.
Study characteristics of published cohort and case-control studies on dietary fiber intake and prostate cancer
| Authors and publication year | Study design | Country | Study period | Cases/subjects | Exposure range | RR (95 % CI) | Variables of adjustment | Study qualitya | Other variables evaluated | Assessment |
|---|---|---|---|---|---|---|---|---|---|---|
| Oishi et al. 1988 [26] | HCC | Japan | 1981–1984 | 100/200 | Ever vs. none | 0.78 (0.45–1.37) | Age | 5 | None | Interview FFQ (31 items) |
| Walker et al. 1992 [27] | PCC | South Africa | 1998–1990 | 166/332 | ≥15 vs. <15 g/day | 0.6 (0.4–1.0) | Age | 6 | None | Interview FFQ (unknown items) |
| Andersson et al. [35] | PCC | Sweden | 1989–1994 | 526/1062 | The highest quartile (≥25.9 g/day) vs. the lowest (<15.9 g/day) | 0.82 (0.58–1.15) | Age, energy | 6 | Advanced prostate cancer | Interview and self-administered questionnaire FFQ (68 items) |
| Vlajinac et al. 1997 [28] | HCC | Serbia | 1990–1994 | 101/303 | The highest tertile vs. the lowest | 4.02 (1.38–11.73) | Age, residence, energy, protein, fat total, saturated fatty acids, carbohydrate, total sugar, retinol, retinol equivalent, a-tocopherol, folic acid, vitamin B12, sodium, potassium, calcium, phosphorus, magnesium, and iron | 6 | None | Interview FFQ (150 items) |
| Deneo-Pellegrini et al. 1999 [29] | HCC | Uruguay | 1993–1997 | 175/408 | The highest quartile (≥27.2 g/day) vs. the lowest (<18.2 g/day) | 1.5 (0.8–2.6) | Age, residence, urban/rural status, education, family history of prostate cancer, BMI, and total energy intake | 6 | None | Interview FFQ (64 items) |
| Ramon et al. 2000 [30] | HCC | Spain | 1994–1998 | 270/704 | The highest quartile (≥39.5 g/day) vs. the lowest (<13.1 g/day) | 1.0 (0.7–1.5) | Age, residence, family history of prostate cancer, BMI, and energy intake | 8 | None | Interview FFQ (141 items) |
| Lu et al. 2001 [31] | PCC | USA | 1993–1997 | 65/197 | The highest quartile (≥13.7 g/day) vs. the lowest (<7.9 g/day) | 1.81 (0.55–5.96) | Age, race, education, alcohol drinking, pack-years of smoking, family history of prostate cancer, and total dietary caloric intake | 8 | None | Interview FFQ (98 items) |
| Pelucchi et al. 2004 [32] | HCC | Italy | 1991–2002 | 1294/1745 | The highest quintile (≥21.1 g/day) vs. the lowest (<12.3 g/day) | 0.93 (0.71–1.22) | Age, study center, education, family history of prostate cancer, smoking habit, alcohol consumption and total energy intake | 7 | Insoluble fiber, cellulose, vegetable fiber, fruit fiber, grain fiber. | Interview FFQ (78 items) |
| McCann et al. 2005 [33] | PCC | USA | 1986–1991 | 433/971 | The highest quartile (>38 g/day) vs. the lowest ≤15 g/day | 1.21 (0.73–2.01) | Age, education, BMI, cigarette smoking status, and total energy | 7 | None | Interview FFQ (172 items) |
| Walker et al. 2005 [34] | HCC | Canada | 1997–1999 | 80/414 | The highest tertile vs. the lowest | 1.10 (0.58–2.07) | Age, alcohol, energy, fat, carbohydrate, calcium, protein, and cholesterol intake | 6 | None | Interview FFQ (66 items) |
| Lewis et al. 2009 [36] | HCC | USA | 1998–2004 | 478/860 | The highest tertile (≥20.7 g/day) vs. the lowest (<13.7 g/day) | 0.56 (0.35–0.89) | Age, education, BMI, smoking history, family history of prostate cancer in first-degree relatives, and total caloric intake | 6 | None | Self-administered questionnaire FFQ (100 items) |
| Suzuki et al. 2009 [9] | Cohort | Europe | 1993–2007 | 2747/142,590 | The highest quintile (≥30.4 g/day) vs. the lowest (<17.8 g/day) | 1.02 (0.87–1.19) | Age, energy intake, height, weight, smoking, education, and marital status | 8 | Vegetables fiber, fruit fiber, cereal fiber Local, advanced, low-grade, and high-grade prostate cancer |
|
| Nimptsch et al. 2011 [10] | Cohort | USA | 1986–2002 | 5112/49,934 | The highest quintile (≥26 g/day) vs. the lowest (≤15.4 g/day) | 1.01 (0.92–1.12) | Age, BMI, height, history of diabetes, family history of prostate cancer, race, smoking, vigorous physical activity, energy intake, alcohol intake, calcium intake, alphalinolenic acid, and tomato sauce | 7 | Local, advanced, low-grade and high-grade prostate cancer | Self-administered questionnaire FFQ (131 items) |
| Drake et al. 2012 [11] | Cohort | Sweden | 1991–2009 | 817/8128 | The highest quintile (≥23.7 g/day) vs. (17.6 g/day) the lowest | 1.15 (0.89–1.49) | Age, year of study entry, season of data collection, energy intake, height, waist, physical activity, smoking, educational level, birth in Sweden, alcohol, calcium, selenium | 9 | Low-risk, high-risk, and symptomatic prostate cancer | Interview FFQ (168 items) |
| Deschasaux et al. 2014 [12] | Cohort | France | 1994–2007 | 139/3313 | The highest quartile vs. the lowest | 0.47 (0.27–0.81) | Age, energy intake without alcohol, intervention group, number of 24-h dietary records, smoking status, educational level, physical activity, height, BMI, alcohol intake, family history of prostate cancer, prostate-specific antigen, calcium intake, processed meat intake, tomato product intake, vitamin E intake, and blood selenium | 7 | Soluble fiber, insoluble fiber, cereal fiber, vegetable fiber, fruit fiber, legume fiber | 24-h dietary record |
| Vidal et al. 2015 [37] | HCC | USA | 2007–2012 | 156/430 | The highest tertile vs. the lowest | 0.79 (0.31–1.97) | Age, race, family history, caloric intake, carbohydrate intake, BMI, diabetes, physical activity, alcohol, and smoking status | 6 | Low-grade and high-grade prostate cancer | Interview FFQ (61 items) |
| Sawada et al. 2015 [13] | Cohort | Japan | 1995–2009 | 825/43,435 | The highest quartile vs. the lowest | 1.00 (0.77, 1.29) | Age, public health center area, smoking status, drinking frequency, marital status, BMI, and intakes of green tea, genistein, SFAs, and carbohydrate | 7 | Soluble fiber, insoluble fiber, local and advanced prostate cancer | Self-administered questionnaire FFQ (138 items) |
PCC population-based case-control studies, HCC hospital-based case-control studies, FFQ food-frequency questionnaire, BMI body mass index
aEvaluated by nine-star Newcastle-Ottawa Scale
As shown in Fig. 2, a statistically significant protective effect of dietary fiber intake on prostate was observed in case-control studies (OR = 0.82; 95 % CI, 0.68–0.96), while no such effect was observed in cohort studies (RR = 0.94; 95 % CI, 0.77–1.11). There was no evidence of heterogeneity among case-control (p = 0.277, I2 = 17 %), but significant heterogeneity among cohort studies (p = 0.004, I2 = 74.3 %). When all these studies were analyzed together, no association was observed between fiber intake and risk of prostate cancer (summary OR = 0.89; 95 % CI, 0.77–1.01), with significant heterogeneity among studies (p = 0.005, I2 = 53.6 %). The wide 95 % prediction interval also included the null value and reflected the significant heterogeneity (0.59, 1.52). In a sensitivity analysis excluding one study at a time, the summary OR for prostate cancer ranged from 0.87 (0.75 to 0.99) when the study by Drake et al. [11] was excluded to 0.93 (0.83 to 1.03) when the study by Deschasaux et al. [12] was excluded. Through the Galbraith plot, four studies were identified as the major sources of heterogeneity (Fig. 3). After excluding these four studies, there was no study heterogeneity (p = 0.915, I2 = 0), and the overall association turned out to be null (OR 1.00, 95 % CI 0.93–1.07). There was no evidence of significant publication bias either with the Egger’s test (p = 0.946) or Begg’s funnel plot (p = 0.753) (Fig. 4).
Fig. 2.
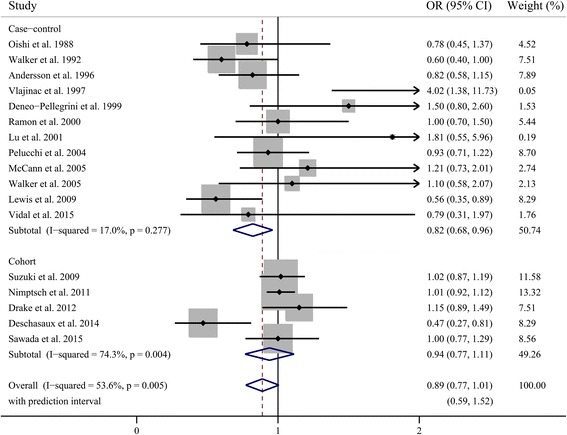
Pooled results for 12 case-control and 5 cohort studies of dietary fiber intake and prostate cancer risk
Fig. 3.
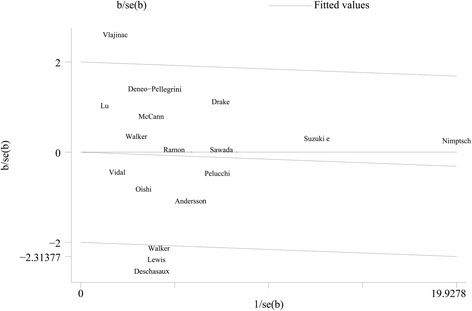
Galbraith plot analysis indicated that four studies were the potential source of heterogeneity
Fig. 4.
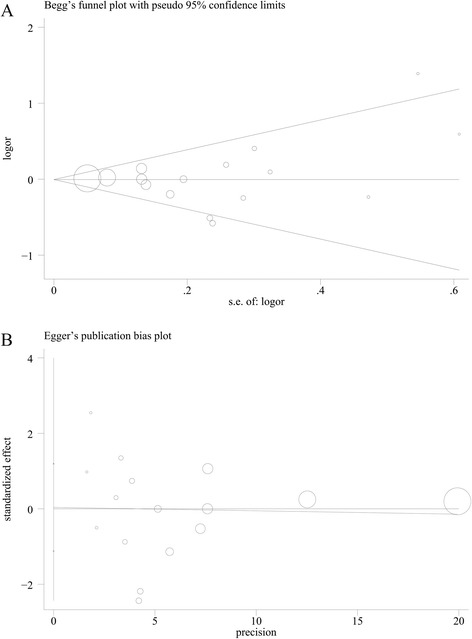
Publication bias which was estimated by Begg’s test (a) and Egger’s test (b)
Next, we performed subgroup analyses by study quality, geographical region, and the method of exposure assessment (Table 2). When we stratified by study quality, more significant association was observed in studies of low-quality (OR 0.73, 95 % CI 0.56–0.90) compared with studies of high-quality (OR 0.96, 95 % CI 0.83–1.08). Considering the geographic area, the pooled OR was 0.90 (95 % CI, 0.65–1.16) in European studies, 0.90 (95 % CI 0.64–1.06) in North American studies, and 0.95 (95 % CI, 0.72–1.17) in Japanese studies. When separately analyzed by exposure assessment, the ORs were 0.93 (95 % CI 0.76–1.09) for studies that used an interview and 0.94 (0.76–1.10) for with a self-administered questionnaire, respectively.
Table 2.
Subgroup analyses of odds ratios for the association between fiber intake and risk of prostate cancer
| Outcome of interest | No. of studies | OR (95 % CI) | p heterogenity | I 2 (%) | p for interaction |
|---|---|---|---|---|---|
| Total dietary fiber | 17 | 0.89 (0.77, 1.01) | 0.005 | 53.6 | |
| Study design | |||||
| Cohort | 5 | 0.94 (0.77, 1.11) | 0.004 | 74.3 | 0.202 |
| Case-control | 12 | 0.82 (0.68, 0.96) | 0.277 | 17.0 | |
| Study quality | |||||
| Low | 8 | 0.73 (0.56, 0.90) | 0.335 | 12.2 | 0.033 |
| High | 9 | 0.96 (0.83, 1.08) | 0.04 | 51.7 | |
| Geographical region | |||||
| Europe | 7 | 0.90 (0.71, 1.09) | 0.01 | 63.5 | 0.937 |
| North America | 6 | 0.90 (0.64, 1.16) | 0.059 | 53.1 | |
| Japan | 2 | 0.95 (0.72, 1.17) | 0.41 | 0 | |
| Assessment | |||||
| Interview | 11 | 0.94 (0.79, 1.10) | 0.313 | 13.8 | 0.931 |
| Questionnaire | 4 | 0.93 (0.76, 1.09) | 0.02 | 69.7 | |
| Family history | |||||
| Yes | 8 | 0.84 (0.62, 1.05) | 0.002 | 69.4 | 0.44 |
| No | 9 | 0.94 (0.81, 1.08) | 0.187 | 29.0 | |
| BMI | |||||
| Yes | 8 | 0.87 (0.66, 1.08) | 0.001 | 70.3 | 0.695 |
| No | 9 | 0.92 (0.79, 1.06) | 0.21 | 26.4 | |
| Energy intake | |||||
| Yes | 14 | 0.91 (0.78, 1.04) | 0.007 | 55.1 | 0.507 |
| No | 3 | 0.81 (0.54, 1.07) | 0.14 | 49.2 | |
| Multiple confoundersa | |||||
| Yes | 6 | 0.82 (0.54, 1.09) | 0.306 | 14.4 | 0.387 |
| No | 11 | 0.95 (0.84, 1.05) | <0.001 | 77.7 | |
| Tumor stage | |||||
| Local | 3 | 0.98 (0.89, 1.08) | 0.24 | 30.5 | 0.562 |
| Advanced | 4 | 0.93 (0.79, 1.07) | 0.24 | 29.3 | |
| Source of intake | |||||
| Cereal fiber | 3 | 1.05 (0.94, 1.16) | 0.52 | 0 | 0.02 |
| Fruit fiber | 3 | 0.92 (0.81, 1.03) | 0.55 | 0 | |
| Vegetable fiber | 3 | 0.87 (0.53, 1.21) | 0.001 | 84.8 | |
| Legume fiber | 1 | 0.55 (0.32, 0.95) | NA | NA | |
| Solubility | |||||
| Soluble fiber | 2 | 0.87 (0.52, 1.22) | 0.13 | 57.2 | 0.777 |
| Insoluble fiber | 3 | 0.80 (0.46, 1.13) | 0.005 | 81.0 | |
aMultiple confounders refer to effect estimates adjusted for at least family history, BMI, and energy intake
We also investigated the impact of some confounding factors on the estimates of ORs (Table 2). Family history is the established risk factor for prostate cancer; BMI and energy are potential confounders of the relationship between fiber intake and the risk of prostate cancer. We found that the non-significant relationships between prostate cancer and fiber intake were consistent in all subgroups, whether controlled for family history, BMI, and energy intake or not. Moreover, six studies in our analysis adjusted for these three confounders simultaneously. Therefore, we examined whether more thoroughly adjusting for potential confounders affected the pooled OR. The effect estimates for studies that adjusted for these three confounders or not were ORs of 0.82 (95 % CI 0.54–1.09) and 0.95 (0.84–1.05), respectively.
In addition, after stratification according to food source and solubility, none of the subtypes could lower the incidence of prostate cancer significantly, except for legume fiber, though it is based on only one cohort study [12]. We also pooled the ORs by clinical characteristics of prostate cancer. The summary ORs did not indicate that high fiber intake had a significant protective association with low- or high-stage disease (Table 2).
Discussion
This is the first meta-analysis for clarification of the association between fiber intake and risk of prostate cancer. Twelve case-control studies and 5 prospective studies involving more than 8000 cases were included in our study. The results suggested no significant association between dietary fiber intake and prostate cancer incidence.
Although the pooled analysis from the case-control studies suggested a significant reduction in risk, the results from the cohort studies were non-significant, suggesting that our conclusion depend mainly on the cohort studies. It is generally thought that cohort studies provide stronger evidence regarding an association than case-control studies because they are less prone to differential recall of dietary habits or selection bias. Therefore, the evidence from case-control studies should be viewed with caution, particularly considering that the combined risk estimates from all studies suggested no association. In the subgroup analysis separated by study quality, we observed that fiber intake was associated with decreased risk of prostate cancer in low-quality studies, but no significant association in high-quality studies. This may account partly for the discrepancy between cohort and case-control studies, since all 5 cohort studies were high-quality studies published after 2009, while 8 of 12 case-control studies were low-quality ones. Moreover, the non-significant relationships were similar independent of study design, geographical region, method of dietary assessment, and adjustment for several essential confounders or not, further strengthening the stability of our findings.
We observed a significant heterogeneity among studies, which was partly explained by the fact that levels in the lowest and highest categories and the range of intake were various and quite heterogeneous across studies. In addition, accurate assessment of fiber intake is a challenge. A previous meta-analysis suggested that the different definition of dietary fiber between included studies may contribute to heterogeneity in the results [44]. However, only one study used the Englyst method for the definition of fiber [32]. Also, the extent to which confounding factors were controlled differed among studies, which may bring heterogeneity and resulted in inaccurate pooled estimates. For the two established risk factors, all studies included in this meta-analysis provided risk estimates adjusted for age, while 8 of 17 studies controlled for a family history of prostate cancer in their analyses [6, 10, 12, 29–31, 36, 37]. However, it is unlikely that a family history of prostate cancer is a strong confounder because it is not strongly related to fiber intake. In the subgroup analysis, results that did and did not adjust for family history did not differ in the meta-regression. The summary OR represents the combination of different types of fiber, such as soluble and insoluble fiber, and fiber from different food sources, which may have different effects on prostate cancer, though the pooled estimates of subtypes suggested no association, except for the legume fiber. Intakes of different types of fiber vary across countries, thus providing another explanation for the heterogeneity across studies. We also performed Galbraith plot analysis and identified four studies reporting extreme ORs as the potential sources of heterogeneity [12, 27, 28, 36]. No heterogeneity existed after excluding these four studies.
It has been suggested that dietary fiber may reduce prostate cancer risk possibly by increasing circulating levels of sex hormone-binding globulin [45] and improving insulin sensitivity [46]. Fiber may reduce insulin resistance through a decrease in carbohydrate absorption rate [47]. Insulin resistance and hyperinsulinemia, by decreasing insulin-like growth factor (IGF) binding proteins and increasing IGF concentrations, may stimulate prostate carcinogenesis [46]. Foods rich in dietary fiber also contain dietary lignans, which are postulated to be associated with a decreased risk of prostate cancer [48]. New evidence showed that inositol hexaphosphate (IP6), a major component of high-fiber diet, could control the progression of prostate cancer in mice due to its anti-angiogenic effects [49]. The inconsistency between experimental and epidemiology studies may be partly explained by the low bioavailability of these active ingredients in human plasma, and the drug accumulation could not achieve high levels in prostate. It was noted that most of the included studies were conducted in western countries, and the western diet is typically described as being high fat and low fiber compared with Asian diet [50], probably leading to relatively low blood levels of active ingredients in the subjects, thus the non-significant findings in the meta-analysis.
Our study has several important limitations. First, fiber intake was generally not the main focus of the included studies. Although analysis of total fiber on prostate cancer incidence was based on many studies, results for fiber subtypes and secondary outcomes of local and advanced stage disease were limited. As such, the pooled estimates were more susceptible to the influence from individual studies and should be interpreted with caution. Second, we were unable to conduct dose-responses because some studies did not provide the value of fiber intake in each category, and the number of cases and noncases by stratum were often missing in studies. Third, although most studies included in our analysis had performed adjustment for a wide range of confounders, we could not rule out the possibility that other unidentified or unmeasured factors could affect the association. Fourth, we did not sought to include unpublished data or papers in other languages, yet little evidence of publication bias was observed.
Conclusions
In conclusion, this meta-analysis of epidemiological studies provides evidence that diets with high intake of plant-based foods rich in fiber may have no impact in the prevention of prostate cancer. Additional studies, especially large prospective cohort studies, are warranted to confirm these findings and address the effects of different fiber subtypes and secondary outcomes.
Abbreviations
- BMI
body mass index
- CI
confidence interval
- FFQ
Food frequency questionnaire
- IGF
insulin-like growth factor
- OR
odds ratio
- RR
relative risk
Footnotes
Competing interests
The authors declare that they have no competing interests.
Authors’ contributions
TS wrote the manuscript. TS and TM analyzed the data. TS and TM performed the statistical analysis. RS and HS revised the manuscript. All authors read and approved the final manuscript.
Contributor Information
Tao Sheng, Email: shengt78@sina.com.
Rui-lin Shen, Email: urosrl@126.com.
Huan Shao, Email: shaohuan55@163.com.
Tian-hong Ma, Email: doctormth@126.com.
References
- 1.Torre LA, Bray F, Siegel RL, Ferlay J, Lortet-Tieulent J, Jemal A. Global cancer statistics, 2012. CA Cancer J Clin. 2015;65:87–108. doi: 10.3322/caac.21262. [DOI] [PubMed] [Google Scholar]
- 2.Chan JM, Jou RM, Carroll PR. The relative impact and future burden of prostate cancer in the United States. J Urol. 2004;172:S13–16. doi: 10.1097/01.ju.0000142068.66876.53. [DOI] [PubMed] [Google Scholar]
- 3.Shimizu H, Ross RK, Bernstein L, Yatani R, Henderson BE, Mack TM. Cancers of the prostate and breast among Japanese and white immigrants in Los Angeles County. Br J Cancer. 1991;63:963–966. doi: 10.1038/bjc.1991.210. [DOI] [PMC free article] [PubMed] [Google Scholar]
- 4.Bingham SA, Day NE, Luben R, Ferrari P, Slimani N, Norat T, Clavel-Chapelon F, Kesse E, Nieters A, Boeing H, et al. Dietary fibre in food and protection against colorectal cancer in the European Prospective Investigation into Cancer and Nutrition (EPIC): an observational study. Lancet. 2003;361:1496–1501. doi: 10.1016/S0140-6736(03)13174-1. [DOI] [PubMed] [Google Scholar]
- 5.Baghurst PA, Rohan TE. High-fiber diets and reduced risk of breast cancer. Int J Cancer. 1994;56:173–176. doi: 10.1002/ijc.2910560204. [DOI] [PubMed] [Google Scholar]
- 6.Pelucchi C, La Vecchia C, Chatenoud L, Negri E, Conti E, Montella M, Calza S, Dal Maso L, Franceschi S. Dietary fibres and ovarian cancer risk. Eur J Cancer. 2001;37:2235–2239. doi: 10.1016/S0959-8049(01)00291-X. [DOI] [PubMed] [Google Scholar]
- 7.Soler M, Bosetti C, Franceschi S, Negri E, Zambon P, Talamini R, Conti E, La Vecchia C. Fiber intake and the risk of oral, pharyngeal and esophageal cancer. Int J Cancer. 2001;91:283–287. doi: 10.1002/1097-0215(200002)9999:9999<::AID-IJC1047>3.0.CO;2-I. [DOI] [PubMed] [Google Scholar]
- 8.Wiseman M. The second World Cancer Research Fund/American Institute for Cancer Research expert report. Food, nutrition, physical activity, and the prevention of cancer: a global perspective. Proc Nutr Soc. 2008;67:253–256. doi: 10.1017/S002966510800712X. [DOI] [PubMed] [Google Scholar]
- 9.Suzuki R, Allen NE, Key TJ, Appleby PN, Tjonneland A, Johnsen NF, Jensen MK, Overvad K, Boeing H, Pischon T, et al. A prospective analysis of the association between dietary fiber intake and prostate cancer risk in EPIC. Int J Cancer. 2009;124:245–249. doi: 10.1002/ijc.23908. [DOI] [PubMed] [Google Scholar]
- 10.Nimptsch K, Kenfield S, Jensen MK, Stampfer MJ, Franz M, Sampson L, Brand-Miller JC, Willett WC, Giovannucci E. Dietary glycemic index, glycemic load, insulin index, fiber and whole-grain intake in relation to risk of prostate cancer. Cancer Causes Control. 2011;22:51–61. doi: 10.1007/s10552-010-9671-x. [DOI] [PMC free article] [PubMed] [Google Scholar]
- 11.Drake I, Sonestedt E, Gullberg B, Ahlgren G, Bjartell A, Wallstrom P, Wirfalt E. Dietary intakes of carbohydrates in relation to prostate cancer risk: a prospective study in the Malmo Diet and Cancer cohort. Am J Clin Nutr. 2012;96:1409–1418. doi: 10.3945/ajcn.112.039438. [DOI] [PubMed] [Google Scholar]
- 12.Deschasaux M, Pouchieu C, His M, Hercberg S, Latino-Martel P, Touvier M. Dietary total and insoluble fiber intakes are inversely associated with prostate cancer risk. J Nutr. 2014;144:504–510. doi: 10.3945/jn.113.189670. [DOI] [PubMed] [Google Scholar]
- 13.Sawada N, Iwasaki M, Yamaji T, Shimazu T, Sasazuki S, Inoue M, Tsugane S. Fiber intake and risk of subsequent prostate cancer in Japanese men. Am J Clin Nutr. 2015;101:118–125. doi: 10.3945/ajcn.114.089581. [DOI] [PubMed] [Google Scholar]
- 14.Fincham SM, Hill GB, Hanson J, Wijayasinghe C. Epidemiology of prostatic cancer: a case-control study. Prostate. 1990;17:189–206. doi: 10.1002/pros.2990170303. [DOI] [PubMed] [Google Scholar]
- 15.Augustin LS, Galeone C, Dal Maso L, Pelucchi C, Ramazzotti V, Jenkins DJ, Montella M, Talamini R, Negri E, Franceschi S, La Vecchia C. Glycemic index, glycemic load and risk of prostate cancer. Int J Cancer. 2004;112:446–450. doi: 10.1002/ijc.20416. [DOI] [PubMed] [Google Scholar]
- 16.Bradbury KE, Appleby PN, Key TJ. Fruit, vegetable, and fiber intake in relation to cancer risk: findings from the European Prospective Investigation into Cancer and Nutrition (EPIC) Am J Clin Nutr. 2014;100(Suppl 1):394S–398S. doi: 10.3945/ajcn.113.071357. [DOI] [PubMed] [Google Scholar]
- 17.Westerlund A, Steineck G, Balter K, Stattin P, Gronberg H, Hedelin M. Dietary supplement use patterns in men with prostate cancer: the Cancer Prostate Sweden study. Ann Oncol. 2011;22:967–972. doi: 10.1093/annonc/mdq456. [DOI] [PubMed] [Google Scholar]
- 18.Schuurman AG, Goldbohm RA, Dorant E, van den Brandt PA. Vegetable and fruit consumption and prostate cancer risk: a cohort study in The Netherlands. Cancer Epidemiol Biomarkers Prev. 1998;7:673–680. [PubMed] [Google Scholar]
- 19.Key TJ, Silcocks PB, Davey GK, Appleby PN, Bishop DT. A case-control study of diet and prostate cancer. Br J Cancer. 1997;76:678–687. doi: 10.1038/bjc.1997.445. [DOI] [PMC free article] [PubMed] [Google Scholar]
- 20.Lee MM, Wang RT, Hsing AW, Gu FL, Wang T, Spitz M. Case-control study of diet and prostate cancer in China. Cancer Causes Control. 1998;9:545–552. doi: 10.1023/A:1008840105531. [DOI] [PubMed] [Google Scholar]
- 21.Hebert JR, Hurley TG, Olendzki BC, Teas J, Ma Y, Hampl JS. Nutritional and socioeconomic factors in relation to prostate cancer mortality: a cross-national study. J Natl Cancer Inst. 1998;90:1637–1647. doi: 10.1093/jnci/90.21.1637. [DOI] [PubMed] [Google Scholar]
- 22.Rosato V, Edefonti V, Bravi F, Bosetti C, Bertuccio P, Talamini R, Dal Maso L, Montella M, Ferraroni M, La Vecchia C, Decarli A. Nutrient-based dietary patterns and prostate cancer risk: a case-control study from Italy. Cancer Causes Control. 2014;25:525–532. doi: 10.1007/s10552-014-0356-8. [DOI] [PubMed] [Google Scholar]
- 23.Egeberg R, Olsen A, Christensen J, Johnsen NF, Loft S, Overvad K, Tjonneland A. Intake of whole-grain products and risk of prostate cancer among men in the Danish Diet, Cancer and Health cohort study. Cancer Causes Control. 2011;22:1133–1139. doi: 10.1007/s10552-011-9789-5. [DOI] [PubMed] [Google Scholar]
- 24.Chhim AS, Fassier P, Latino-Martel P, Druesne-Pecollo N, Zelek L, Duverger L, Hercberg S, Galan P, Deschasaux M, Touvier M. Prospective association between alcohol intake and hormone-dependent cancer risk: modulation by dietary fiber intake. Am J Clin Nutr. 2015;102:182–189. doi: 10.3945/ajcn.114.098418. [DOI] [PubMed] [Google Scholar]
- 25.Rohan TE, Howe GR, Burch JD, Jain M. Dietary factors and risk of prostate cancer: a case-control study in Ontario, Canada. Cancer Causes Control. 1995;6:145–154. doi: 10.1007/BF00052775. [DOI] [PubMed] [Google Scholar]
- 26.Oishi K, Okada K, Yoshida O, Yamabe H, Ohno Y, Hayes RB, Schroeder FH. A case-control study of prostatic cancer with reference to dietary habits. Prostate. 1988;12:179–190. doi: 10.1002/pros.2990120208. [DOI] [PubMed] [Google Scholar]
- 27.Walker AR, Walker BF, Tsotetsi NG, Sebitso C, Siwedi D, Walker AJ. Case-control study of prostate cancer in black patients in Soweto, South Africa. Br J Cancer. 1992;65:438–441. doi: 10.1038/bjc.1992.89. [DOI] [PMC free article] [PubMed] [Google Scholar]
- 28.Vlajinac HD, Marinkovic JM, Ilic MD, Kocev NI. Diet and prostate cancer: a case-control study. Eur J Cancer. 1997;33:101–107. doi: 10.1016/S0959-8049(96)00373-5. [DOI] [PubMed] [Google Scholar]
- 29.Deneo-Pellegrini H, De Stefani E, Ronco A, Mendilaharsu M. Foods, nutrients and prostate cancer: a case-control study in Uruguay. Br J Cancer. 1999;80:591–597. doi: 10.1038/sj.bjc.6690396. [DOI] [PMC free article] [PubMed] [Google Scholar]
- 30.Ramon JM, Bou R, Romea S, Alkiza ME, Jacas M, Ribes J, Oromi J. Dietary fat intake and prostate cancer risk: a case-control study in Spain. Cancer Causes Control. 2000;11:679–685. doi: 10.1023/A:1008924116552. [DOI] [PubMed] [Google Scholar]
- 31.Lu QY, Hung JC, Heber D, Go VL, Reuter VE, Cordon-Cardo C, Scher HI, Marshall JR, Zhang ZF. Inverse associations between plasma lycopene and other carotenoids and prostate cancer. Cancer Epidemiol Biomarkers Prev. 2001;10:749–756. [PubMed] [Google Scholar]
- 32.Pelucchi C, Talamini R, Galeone C, Negri E, Franceschi S, Dal Maso L, Montella M, Conti E, La Vecchia C. Fibre intake and prostate cancer risk. Int J Cancer. 2004;109:278–280. doi: 10.1002/ijc.11688. [DOI] [PubMed] [Google Scholar]
- 33.McCann SE, Ambrosone CB, Moysich KB, Brasure J, Marshall JR, Freudenheim JL, Wilkinson GS, Graham S. Intakes of selected nutrients, foods, and phytochemicals and prostate cancer risk in western New York. Nutr Cancer. 2005;53:33–41. doi: 10.1207/s15327914nc5301_4. [DOI] [PubMed] [Google Scholar]
- 34.Walker M, Aronson KJ, King W, Wilson JW, Fan W, Heaton JP, MacNeily A, Nickel JC, Morales A. Dietary patterns and risk of prostate cancer in Ontario, Canada. Int J Cancer. 2005;116:592–598. doi: 10.1002/ijc.21112. [DOI] [PubMed] [Google Scholar]
- 35.Andersson SO, Wolk A, Bergstrom R, Giovannucci E, Lindgren C, Baron J, Adami HO. Energy, nutrient intake and prostate cancer risk: a population-based case-control study in Sweden. Int J Cancer. 1996;68:716–722. doi: 10.1002/(SICI)1097-0215(19961211)68:6<716::AID-IJC4>3.0.CO;2-6. [DOI] [PubMed] [Google Scholar]
- 36.Lewis JE, Soler-Vila H, Clark PE, Kresty LA, Allen GO, Hu JJ. Intake of plant foods and associated nutrients in prostate cancer risk. Nutr Cancer. 2009;61:216–224. doi: 10.1080/01635580802419756. [DOI] [PubMed] [Google Scholar]
- 37.Vidal AC, Williams CD, Allott EH, Howard LE, Grant DJ, McPhail M, Sourbeer KN, Hwa LP, Boffetta P, Hoyo C, Freedland SJ. Carbohydrate intake, glycemic index and prostate cancer risk. Prostate. 2015;75:430–439. doi: 10.1002/pros.22929. [DOI] [PMC free article] [PubMed] [Google Scholar]
- 38.Chang RT, Kirby R, Challacombe BJ. Is there a link between BPH and prostate cancer? Practitioner. 2012;256:13–16. [PubMed] [Google Scholar]
- 39.DerSimonian R, Laird N. Meta-analysis in clinical trials. Control Clin Trials. 1986;7:177–188. doi: 10.1016/0197-2456(86)90046-2. [DOI] [PubMed] [Google Scholar]
- 40.Higgins JP, Thompson SG, Deeks JJ, Altman DG. Measuring inconsistency in meta-analyses. BMJ. 2003;327:557–560. doi: 10.1136/bmj.327.7414.557. [DOI] [PMC free article] [PubMed] [Google Scholar]
- 41.Higgins JP, Thompson SG, Spiegelhalter DJ. A re-evaluation of random-effects meta-analysis. J R Stat Soc Ser A Stat Soc. 2009;172:137–159. doi: 10.1111/j.1467-985X.2008.00552.x. [DOI] [PMC free article] [PubMed] [Google Scholar]
- 42.Begg CB, Mazumdar M. Operating characteristics of a rank correlation test for publication bias. Biometrics. 1994;50:1088–1101. doi: 10.2307/2533446. [DOI] [PubMed] [Google Scholar]
- 43.Egger M, Davey Smith G, Schneider M, Minder C. Bias in meta-analysis detected by a simple, graphical test. BMJ. 1997;315:629–634. doi: 10.1136/bmj.315.7109.629. [DOI] [PMC free article] [PubMed] [Google Scholar]
- 44.Aune D, Chan DS, Lau R, Vieira R, Greenwood DC, Kampman E, Norat T. Dietary fibre, whole grains, and risk of colorectal cancer: systematic review and dose-response meta-analysis of prospective studies. BMJ. 2011;343:d6617. doi: 10.1136/bmj.d6617. [DOI] [PMC free article] [PubMed] [Google Scholar]
- 45.Roddam AW, Allen NE, Appleby P, Key TJ. Endogenous sex hormones and prostate cancer: a collaborative analysis of 18 prospective studies. J Natl Cancer Inst. 2008;100:170–183. doi: 10.1093/jnci/djm323. [DOI] [PMC free article] [PubMed] [Google Scholar]
- 46.Hsing AW, Gao YT, Chua S, Jr, Deng J, Stanczyk FZ. Insulin resistance and prostate cancer risk. J Natl Cancer Inst. 2003;95:67–71. doi: 10.1093/jnci/95.1.67. [DOI] [PubMed] [Google Scholar]
- 47.Higgins JA. Whole grains, legumes, and the subsequent meal effect: implications for blood glucose control and the role of fermentation. J Nutr Metab. 2012;2012:829238. doi: 10.1155/2012/829238. [DOI] [PMC free article] [PubMed] [Google Scholar]
- 48.Adlercreutz H. Phyto-oestrogens and cancer. Lancet Oncol. 2002;3:364–373. doi: 10.1016/S1470-2045(02)00777-5. [DOI] [PubMed] [Google Scholar]
- 49.Gu M, Roy S, Raina K, Agarwal C, Agarwal R. Inositol hexaphosphate suppresses growth and induces apoptosis in prostate carcinoma cells in culture and nude mouse xenograft: PI3K-Akt pathway as potential target. Cancer Res. 2009;69:9465–9472. doi: 10.1158/0008-5472.CAN-09-2805. [DOI] [PMC free article] [PubMed] [Google Scholar]
- 50.Zhou BF, Stamler J, Dennis B, Moag-Stahlberg A, Okuda N, Robertson C, Zhao L, Chan Q, Elliott P. Nutrient intakes of middle-aged men and women in China, Japan, United Kingdom, and United States in the late 1990s: the INTERMAP study. J Hum Hypertens. 2003;17:623–630. doi: 10.1038/sj.jhh.1001605. [DOI] [PMC free article] [PubMed] [Google Scholar]