

Abstract
Mammalian development begins with the segregation of embryonic and extra-embryonic lineages in the blastocyst. Recent studies revealed cell-to-cell gene expression heterogeneity and dynamic cell rearrangements during mouse blastocyst formation. Thus, mechanistic understanding of lineage specification requires quantitative description of gene expression dynamics at a single-cell resolution in living embryos. However, only a few fluorescent gene expression reporter mice are available and quantitative live image analysis is limited so far. Here, we carried out a fluorescence gene-trap screen and established reporter mice expressing Venus specifically in the first lineages. Lineage tracking, quantitative gene expression and cell position analyses allowed us to build a comprehensive lineage map of mouse pre-implantation development. Our systematic analysis revealed that, contrary to the available models, the timing and mechanism of lineage specification may be distinct between the trophectoderm and the inner cell mass. While expression of our trophectoderm-specific lineage marker is upregulated in outside cells upon asymmetric divisions at 8- and 16-cell stages, the inside-specific upregulation of the inner-cell-mass marker only becomes evident at the 64-cell stage. This study thus provides a framework toward systems-level understanding of embryogenesis marked by high dynamicity and stochastic variability.
Keywords: gene trap, lineage map, live imaging, mouse, pre-implantation development
Introduction
Mammalian development is characterized by the pre-implantation stage during which the blastocyst forms with a single-layer epithelium, the trophectoderm (TE), surrounding a fluid-filled cavity and an eccentric inner cell mass (ICM). Upon implantation, TE will give rise to extra-embryonic tissues, whereas the epiblast cells within ICM will form the embryo proper. Two models have been proposed for the mechanism underlying the first lineage segregation between TE and ICM in the mouse embryo. The inside–outside model suggests that cell position in the morula regulates cell fate 1; the inside cells with circumferential cell contacts contribute to the ICM, whereas cells facing the outside surface of the embryo form TE. The cell polarity model proposes that the apico-basal polarity of the blastomeres underlies cell fate differentiation 2. Depending on the cleavage plane orientation relative to the apico-basal polarity, the 8- to 16- and 16- to 32-cell divisions generate either symmetric (two TE) or asymmetric (ICM and TE) descendants. Notably, in both models, the ICM vs. TE cell fate decision is binary and acquisition of molecular lineage-identity was considered to be regulated in a reciprocal manner 3. Recent studies, however, revealed overlapping mosaic expression of the transcription factors that confer molecular identity to the first lineages 4-6. In particular, the inside cells of the early blastocyst exhibit stochastic cell-to-cell variability in gene expression 7,8. These data are incompatible with the above-mentioned models, and thus, the mechanism underlying the first lineage specification remains to be further investigated.
Recent developments in live imaging of the early mouse development revealed unprecedented dynamics during early mouse embryogenesis 9-11,12,13. Live imaging analysis was enhanced by imaging transgenic embryos expressing fluorescence-labeled nuclei, which allowed tracking of all cells during pre-implantation development and generating lineage trees 14,15. Given the dynamicity and stochastic molecular heterogeneity, mechanistic understanding of the first lineage specification requires quantitative description of the gene expression dynamics in living embryos during morpho-genesis at single-cell resolution 16. However, to date, only a limited number of fluorescence gene expression reporter mice suitable for live imaging are available 5-18,19, quantitative analysis of gene expression dynamics has begun only recently 19, and it has not been systematically integrated with cell lineage segregation pattern.
To analyze endogenous gene and protein expression dynamics, targeted knock-in of fluorescence-fusion reporters is often ideal 20. However, this can result in transgenic embryos expressing low-level fluorescence signal, which is unsuitable for live imaging and subsequent image analysis. On the other hand, gene trap introduces random integration of a fluorescence reporter into the genome and the transgenic embryos suitable for live imaging can be selected by microscopic screenings. Gene-trap screenings have been carried out in various model organisms 21-23 and have generated valuable resources for live imaging embryonic development. However, mouse gene traps have thus far been primarily designed for genetic loss-of-function studies and expression analysis in fixed (e.g., by LacZ reporter), but not in live, tissues 24,25. This may partly be because in mouse, embryonic development can be observed through live imaging only for a limited period of time. However, recent development of live imaging systems for various stages of mouse development and for different tissues 26-28,29-31,32 raised an interest in fluorescent reporters that quantitatively reflect the endo-genous expression of lineage-specific genes.
In this study, we have carried out an in vivo fluorescence gene-trap screen, to our knowledge for the first time in the mouse embryo, using lentiviral transgenesis and generated reporter mice that express Venus specifically in one of the first lineages to be established during mammalian development. These newly established resources, when combined with live imaging microscopy, allowed us to directly connect gene expression dynamics with morphogenetic cellular processes. Taking advantage of this, we present a pipeline to integrate quantitative four-dimensional image analysis into an enhanced lineage map, which allowed us to identify lineage-specific gene regulation. This will lay the foundation for an integrative analysis of mouse embryonic development.
Results
Gene-trap screen generated fluorescence reporter mice for lineage-specific gene expression
We wished to establish an experimental system for monitoring expression dynamics of lineage-specific genes during early mouse embryogenesis. In order to acquire transgenic mice expressing a fluorescent gene expression reporter that allows quantitative expression analysis integrating morphogenetic information, we carried out a fluorescence gene-trap screen in the early mouse embryo using lentiviral transgenesis. One of the goals of this pilot study was to generate fluorescence reporter mice for each of the cell lineages in the blastocyst, specifically TE and ICM that includes epiblast and primitive endoderm.
A lentiviral gene-trap vector was designed with a promoter-less Venus reporter (thus the screen was named as Venus trap) so that upon integration into the transcribed region of an active gene, Venus would be expressed under the control of the promoter and enhancers of this gene (Fig1A). Furthermore, Venus is tagged with a nuclear localization signal (NLS) to concentrate the fluorescent signal. To achieve efficient viral transduction while minimizing the degree of mosaicism, we transduced 2-cell stage embryos with the resulting vector (see Materials and Methods for details).
Figure 1.
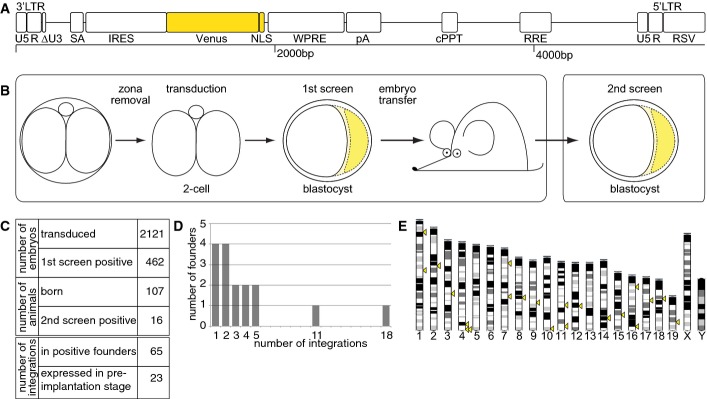
Design and outcome of the fluorescence gene-trap screen
- Design of the fluorescence gene-trap vector. The gene-trap cassette consists of a splice acceptor (SA) followed by stop codons in all three reading frames and an internal ribosomal entry site (IRES). Venus is tagged with a nuclear localization signal (NLS). The essential virus-specific elements include self-inactivating long terminal repeat (LTR) consisting of U5, R and truncated U3 element (ΔU3); woodchuck hepatitis post-transcriptional regulatory element (WPRE); central poly-purine tract (cPPT); Rev-responsive element (RRE); and Rous sarcoma virus promoter (RSV).
- Design of the screenings. Denuded 2-cell stage embryos were transduced with the self-inactivating virus for 6–8 h. Blastocysts were first screened for fluorescence, indicating successful trapping of a gene after 3 days of in vitro culture. Positive embryos were then transferred to foster mothers to give rise to adult founders. Germline transmission of fluorescent signal-positive proviral integrants was tested in a fluorescence-based 2nd screen of expanded blastocysts of subsequent generations.
- Efficiency of the Venus-trap screen.
- Number of integrations identified in the founders positive in the 2nd screen.
- Distribution of integration sites among mouse chromosomes. Yellow triangles mark identified integration sites positive for Venus expression at the blastocyst stage (n = 22 of 23).
The screen was performed in two steps (Fig1B). First, expression of the Venus fluorescent reporter was examined in the blastocyst at embryonic day 4.5 (E4.5), that is, 3 days after lentiviral transduction. Blastocysts yielding a positive signal upon brief microscopic inspection (21.8%; n = 462 blastocysts of n = 2,121 transduced 2-cell embryos; Fig1C) were then transferred to the uterus of the foster mothers. This resulted in the generation of a total of n = 107 founder mice (F0) named VET or fVET after Venus trap for male or female founders, respectively. In a second screen, blastocysts of F1 generation for VET, or of F2 generation for fVET, were screened for fluorescence patterns. This screen identified 16 founder mice carrying at least one gene-trap integrant that, after germline transmission, express detectable levels of Venus in the blastocyst.
Southern blot analyses revealed that the 16 founder mice carry a total of 65 integrations with an average of 4.1 integrations per founder (Fig1C and D). Integrations derived from one founder were labeled alphabetically in ascending order with “A” ascribed to the largest fragment. Integration sites, distributed over the entire chromosomes (Fig1E), were cloned using ligation-mediated (LM)-PCR or TAIL-PCR, and trapped transcripts were cloned by 5′RACE (Table EV1). Cloned sequences were annotated using UCSC BLAT and Ensembl 33,34. When single-integrant VET lines were derived by breedings with wild-type (wt) mice over generations, 23 of 65 integrations (35.4%) turned out to express the Venus reporter at a detectable level in the blastocyst (Fig1C; Table EV1).
To characterize the overall change in expression during pre-implantation development, we imaged live embryos of each of the 23 transgene-expressing single-integrant lines at E1.5, 2.5, 3.5 and 4.5 (Fig2A). The images revealed distinct patterns of Venus expression among the active traps, indicating that the trapped genes are under specific spatio-temporal control during embryonic development. Importantly, specific expression patterns were maintained over more than 10 generations. They can be classified as follows: (i) ubiquitous, with similar fluorescence levels in all lineages (n = 15), (ii) specific to TE (n = 3), (iii) specific to ICM (n = 2), (iv) restricted to TE and primitive endoderm (PrE; n = 2) or (v) overall heterogeneous, with reporter expression only in a subset of blastomeres but without specificity for any particular lineage (n = 1). Altogether, we were able to establish nine of 23 gene-trap mouse lines (39.1%) in which the Venus reporter is expressed in a lineage-specific manner at the blastocyst stage, for example, Tmem50bGt(Venus)fVET17B (hereafter written as Tmem50bGt) specific to TE (Fig2B; Appendix Fig S1A; Movie EV1) and 2610305D13RikGt(Venus)VET53A (hereafter written as 2610305D13RikGt) specific to ICM (Fig2C; Appendix Fig S1B; Movie EV2; see FigEV1 and Materials and Methods for more information on the identity of the gene trapped in VET53A, and FigEV2 for additional lines with non-ubiquitous expression patterns). Lineage-specific expression of two of the trapped genes (Tmem50bGt and 2610305D13RikGt) was also confirmed by qRT–PCR (Appendix Fig S2). In four of those lines, reporter expression transiently exhibited a heterogeneous pattern before being confined to specific lineages (see the image of the E3.5 blastocyst for 2610305D13RikGt in Fig2C, for Cd2apGt in Fig EV2B, for Rbfox2Gt in FigEV2F and for Cers6Gt in FigEV2G), with one exception (VET53C) having heterogeneous expression throughout the pre-implantation phase (see FigEV2D).
Figure 2.

Spatio-temporal characterization of gene-trap mouse embryos
- A The trapped gene and the Venus expression pattern of the established VET mouse lines, summarized as a result of n ≥ 3 independent experiments for each line. *The trapped gene for VET53A is tentatively assigned as 2610305D13Rik (see Materials and Methods for details).
- B, C Brightfield and confocal live images of the developing embryos at E2.5 (8- to 16-cell stage morula), E3.5 and blastocyst cultured beyond E4.5 derived from the (B) TE-specific line Tmem50bGt and (C) ICM-specific line 2610305D13RikGt. Scale bars are 50 μm. All fluorescent images are single confocal sections, representative for n ≥ 3 independent experiments.
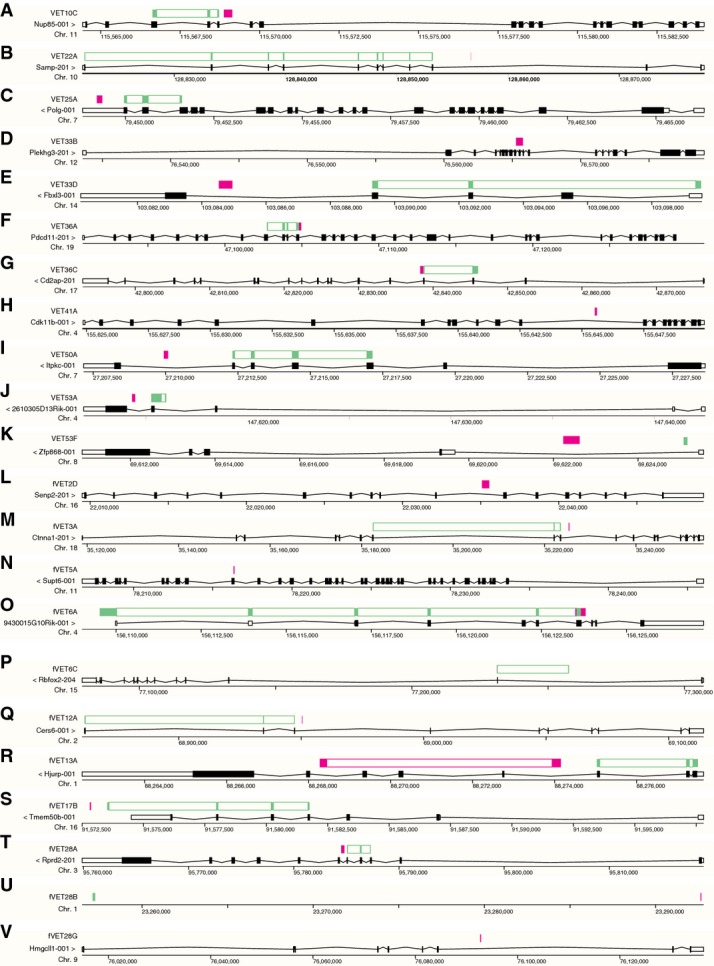
The maps of the proviral integration sites of the VET mouse lines
- A–V Maps showing the genomic structures of the trapped genes (black), the sequence identified by LM- or TAIL-PCR representing the proviral integration site (red) and the sequence identified by 5′RACE representing the trapped exons (green). The maps were established using Ensembl BLAT/BLASTN search against the mouse (Mus musculus) DNA databases of the GRCm38.p3 assembly (release 78) with standard settings. LM- and TAIL-PCR sequences were BLAT-searched against genomic sequences, and 5′RACE sequences were BLASTN- and BLAT-searched against cDNAs (transcripts/splice variants) or genomic sequences, respectively. Gene structures show a representative splice variant of the Ensembl/Havana merge transcripts or Havana transcripts.

Venus expression pattern of the established VET mouse lines
- A–G VET lines with non-ubiquitous Venus expression during the pre-implantation stage. Brightfield and confocal live images of the developing embryos at E1.5 (2- to 4-cell stage), E2.5 (8- to 16-cell stage morula), E3.5 and E4.5 blastocyst derived from (A) PolgGt(Venus)VET25A, (B) Cd2apGt(Venus)VET36C, (C) ItpkcGt(Venus)VET50A, (D) VET53C line, (E) Ctnna1Gt(Venus)fVET3A, (F) Rbfox2Gt(Venus)fVET6C and (G) Cers6Gt(Venus)fVET12A. Arrowheads mark cells of the presumptive PrE positive for fluorescent marker expression. Scale bars are 50 μm. All fluorescent images are representative single confocal sections from n ≥ 3 embryos (n ≥ 2 experiments).
Depending on the locus of genomic integration, a homozygous gene trap may result in a loss-of-function mutation 35,36. This was observed with Ctnna1Gt/Gt, for which the blastocyst cavity failed to expand (n = 15 embryos, n = 6 experiments; FigEV3A1 and B1), a phenotype observed in an earlier gene-trap study 37. We noted that fluorescent intensities are correlated with and could be used to determine the genotype of live VET embryos (FigEV3A1 and A2, Kruskal–Wallis H-test, P = 3 × 10⁻⁵; FigEV3A3 and A4, Kruskal–Wallis H-test, P = 2 × 10⁻⁶). Interestingly, Supt6Gt/Gt homozygotes died during pre-implantation development (n = 15 embryos, n = 4 independent experiments; FigEV3A3 and B3). Loss of protein expression was confirmed by immunostaining (FigEV3B1 and B2, Kruskal–Wallis H-test, P = 10−5; FigEV3B3 and B4, Kruskal–Wallis H-test, P = 0.003) and genotyping PCR of single embryos. These data demonstrate that VET insertions can produce functional KO by disrupting protein formation of the trapped gene. Furthermore, the Venus-trap screen allowed us to identify a new gene, Supt6, required for mouse pre-implantation development.
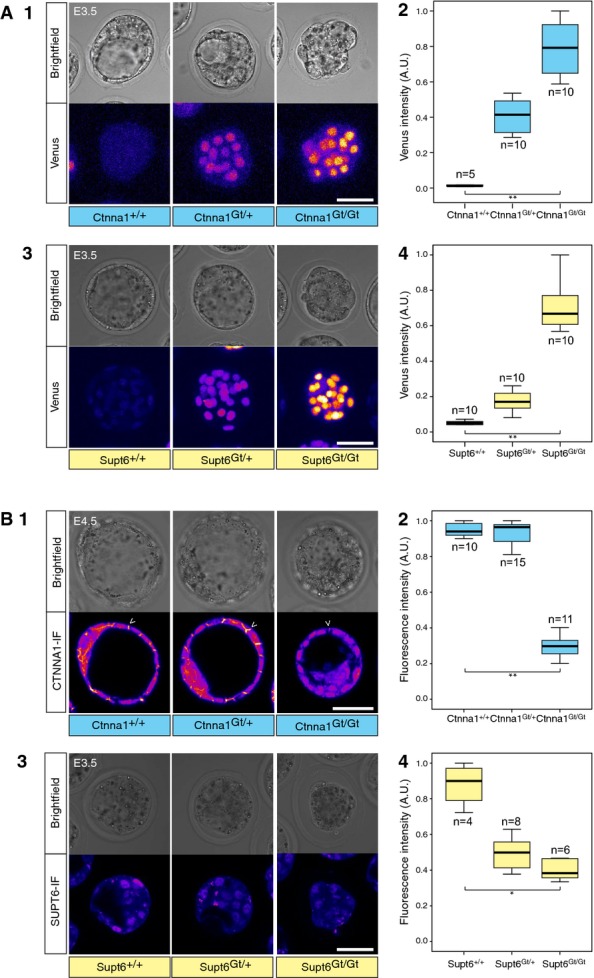
Venus-trap screen identified a novel gene essential for the pre-implantation development
- Fluorescence intensity is correlated with the genotype of VET embryos. (1) Ctnna1+/+ (n = 6 embryos), Ctnna1Gt/+ (n = 10 embryos) and Ctnna1Gt/Gt embryos (n = 7 embryos) at E3.5 shown as brightfield images (upper row panels) and for Venus expression (lower panels) (n = 2 experiments). (2) Box plots depicting Venus fluorescence intensity in individual nuclei of Ctnna1+/+ (n = 5 nuclei from n = 1 embryo), Ctnna1Gt/+ (n = 10 nuclei from n = 3 embryos) and Ctnna1Gt/Gt (n = 10 nuclei from n = 2 embryos) embryos (n = 2 experiments). Kruskal–Wallis H-test, P = 3 × 10⁻⁵. (3) Supt6+/+ (n = 11 embryos), Supt6Gt/+ (n = 29 embryos) and Supt6Gt/Gt embryos (n = 15 embryos) at E3.5 shown as brightfield images (upper panels) and Venus expression (lower panels) (n = 4 experiments). (4) Box plots depicting Venus fluorescence intensity in individual nuclei of Supt6+/+(n = 10 nuclei from n = 3 embryos), Supt6Gt/+ (n = 10 nuclei from n = 2 embryos) and Supt6Gt/Gt (n = 10 nuclei from n = 2 embryos) embryos. Kruskal–Wallis H-test, P = 2 × 10⁻⁶.
- Venus-trap insertions disrupt the formation and function of the protein of the trapped gene. (1) Immunostaining of CTNNA1 protein in Ctnna1+/+ (n = 20 embryos), Ctnna1Gt/+ (n = 17 embryos) and Ctnna1Gt/Gt (n = 8 embryos) embryos at the E4.5 blastocyst stage (n = 4 experiments). White arrowheads indicate accumulation of the CTNNA1 signal on cell–cell adhesions that was lost in Ctnna1Gt/Gt embryos. (2) Box plots indicating the fluorescence intensity at cell–cell contacts of Ctnna1+/+ (n = 10 cell–cell contacts from n = 2 embryos), Ctnna1Gt/+ (n = 15 contacts from n = 3 embryos) and Ctnna1Gt/Gt embryos (n = 11 contacts from n = 3 embryos). Kruskal–Wallis H-test, P = 1 × 10⁻⁵. (3) SUPT6 distribution in Supt6+/+ (n = 4 embryos), Supt6Gt/+ (n = 10 embryos) and Supt6Gt/Gt (n = 2 embryos) embryos at E3.5 (n = 1 experiment). (4) Box plots indicating the fluorescence intensity in individual nuclei of Supt6+/+ (n = 4 nuclei from n = 1 embryo), Supt6Gt/+ (n = 8 nuclei from n = 1 embryo) and Supt6Gt/Gt (n = 6 nuclei from n = 1 embryo) embryos at E3.5. Kruskal–Wallis H-test, P = 0.003.
Data information: Venus expression images in (A) are sum intensity projections and in (B) are single confocal sections. Venus expression level is shown using a fire lookup table (LUT). Scale bars are 50 μm. Fluorescence intensities in A2, A4, B2 and B4 are normalized to the highest level of fluorescence. Statistical significance is indicated as * (P < 0.05) or ** (P < 0.001).
ICM and TE reporter expression is controlled under the lineage-specific genes
We examined the potential regulation of the newly identified lineage reporters through key factors of the emerging regulatory networks 38 by analyzing Venus expression of Tmem50bGt or 2610305D13RikGt embryos in Cdx2−/− or Tead4−/− backgrounds. Tead4 and Cdx2 are required to maintain the TE lineage and its gene regulatory network 39-41. Expression of the TE reporter Tmem50bGt was reduced in a Tead4−/− background (Fig3A). Quantification of the mean fluorescence intensity of the Tmem50bGt reporter in individual nuclei of outer cells of Tead4+/+ (n = 4 embryos, n = 16 nuclei), Tead4+/− (n = 4 embryos, n = 16 nuclei) and Tead4−/− embryos (n = 5 embryos, n = 19 nuclei) revealed that the TE reporter Tmem50bGt is positively regulated by Tead4 (Fig3B; Kruskal–Wallis H-test, P = 10−8). Similarly, quantification of the Tmem50bGt mean fluorescence intensity in individual nuclei of outer cells of Cdx2+/+ (n = 2 embryos, n = 9 nuclei), Cdx2+/− (n = 2 embryos, n = 10 nuclei) and Cdx2−/− embryos (n = 4 embryos, n = 22 nuclei) revealed a positive regulation of Tmem50bGt by Cdx2 (Fig3C and D; Kruskal–Wallis H-test, P = 2 × 10⁻⁶). In contrast, the ICM marker 2610305D13RikGt was negatively regulated by Tead4 and Cdx2 as measured in individual nuclei of outer cells in Tead4+/+ (n = 3 embryos, n = 17 nuclei), Tead4+/− (n = 4 embryos, n = 15 nuclei) and Tead4−/− embryos (n = 5 embryos, n = 16 nuclei) (Fig3E and F; Kruskal–Wallis H-test, P = 5 × 10⁻⁵); and in Cdx2+/+ (n = 4 embryos, n = 15 nuclei), Cdx2+/− (n = 4 embryos, n = 16 nuclei) and Cdx2−/− embryos (n = 4 embryos, n = 14 nuclei, Fig3G and H; Kruskal–Wallis H-test, P = 0.01).
Figure 3.

ICM and TE reporter expressions are controlled under the emerging lineage-specific genes
- Brightfield and confocal live images of Venus expression in Tmem50bGt in Tead4+/+ or Tead4−/− background at E3.5 (n = 109 embryos in n = 3 experiments).
- Box plots depicting Tmem50bGt Venus fluorescence intensities in individual nuclei of Tead4+/+ (n = 16 nuclei from n = 4 embryos), Tead4+/− (n = 16 nuclei from n = 4 embryos) or Tead4−/− embryos (n = 19 nuclei from n = 5 embryos; Kruskal–Wallis H-test, P = 10−8).
- Brightfield and confocal live images of Venus expression in individual nuclei of Tmem50bGt in a Cdx2+/+ or Cdx2−/− background at E3.5 (n = 57 embryos in n = 5 experiments).
- Box plots depicting Tmem50bGt Venus intensities in individual nuclei of Cdx2+/+ (n = 9 nuclei from n = 2 embryos), Cdx2+/− (n = 10 nuclei from n = 2 embryos) or Cdx2−/− embryos (n = 22 nuclei from n = 4 embryos; Kruskal–Wallis H-test, P = 2 × 10⁻⁶).
- Brightfield and confocal live images of Venus expression in 2610305D13RikGt in a Tead4+/+ or Tead4−/− background at E3.5 (n = 68 embryos in n = 3 experiments).
- Box plots depicting 2610305D13RikGt Venus intensities in individual nuclei of TE cells in Tead4+/+ (n = 17 nuclei from n = 3 embryos), Tead4+/− (n = 15 nuclei from n = 4 embryos) or Tead4−/− embryos (n = 16 nuclei from n = 5 embryos; Kruskal–Wallis H-test, P = 5 × 10⁻⁵).
- Brightfield and confocal live images of Venus expression in 2610305D13RikGt in a Cdx2+/+ or Cdx2−/− background at E3.5 (n = 95 embryos in n = 4 experiments).
- Box plots depicting 2610305D13RikGt Venus intensities in individual nuclei of TE cells in Cdx2+/+ (n = 15 nuclei from n = 4 embryos), Cdx2+/− (n = 16 nuclei from n = 4 embryos) or Cdx2−/− embryos (n = 14 nuclei from n = 4 embryos; Kruskal–Wallis H-test, P = 0.01).
Data information: Venus intensities in (B, D, F, H) are normalized to the highest level of expression. Statistical significance is indicated as * (P < 0.05) or ** (P < 0.001). Scale bars are 50 μm. Venus expression images are sum intensity projections with a fire LUT. A fire LUT from 0 to 255 gray scales is shown in (A).
Altogether, these data place the newly identified genes, Tmem50b and 2610305D13Rik, under the control of the gene regulatory network establishing the TE and ICM cell fates in the pre-implantation mouse embryo.
Establishment of the lineage segregation map of mouse pre-implantation development
To establish a map of lineage segregation between ICM and TE in association with gene expression dynamics, we time-lapse imaged one representative VET line for each lineage, Tmem50bGt for TE and 2610305D13RikGt for ICM, and followed gene expression dynamics in embryos developing from the 4-cell to expanding blastocyst stage (64-cell). Under the established imaging condition, 98.1% of the live-imaged embryos (n = 53/54 embryos, n = 6 independent experiments) successfully developed to the expanded blastocyst stage, suggesting that the established lineage map would reflect the physiological situation in vivo.
Combining our gene-trap lines with a transgenic mouse line ubiquitously expressing histone H2B tagged with mCherry (R26-H2B-mCherry 42), we normalized the Venus signal to the mCherry signal, thereby correcting for systematic error arising from nuclear position within the embryo. Furthermore, to rightly assign a given cell position and fate 32, we used mTmG to obtain membrane signal (hereafter written as mT in this study 43). A cell is defined as outside or TE if some part of the cell membrane is exposed to the outside, whereas inside or ICM cells are entirely surrounded by cell–cell contacts 4. Cell membrane signal also helped identifying individual nuclei when the distance between them becomes small. Altogether, we prepared a triple transgenic embryo for quantitative gene expression analysis: a VET line combined with R26-H2B-mCherry and mT.
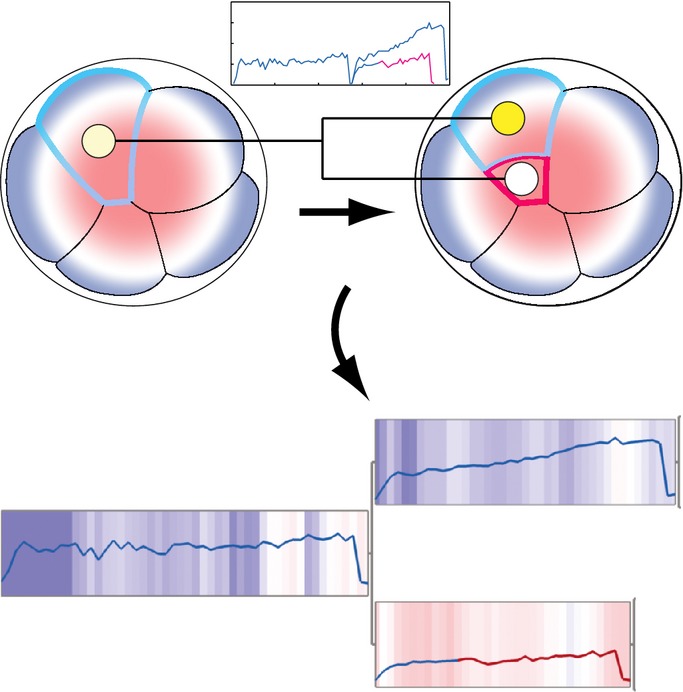
A representative image of the Tmem50bGt-Venus x R26-H2B-mCherry x mT embryo developing from the 8- to 64-cell stage is shown in Fig4A. The Tmem50bGt reporter expression became detectable at 8- to 16-cell stage in all blastomeres. Subsequently, expression was specifically upregulated in the outside cells at around the E3.5 (> 32-cell) stage and, ultimately in the E4.5 blastocyst (≥ 64-cell), was restricted to the outside TE cells (Fig4A; Movie EV3). On the other hand, 2610305D13RikGt-Venus × R26-H2B-mCherry × mT embryos exhibited heterogeneous Venus expression pattern from 8- to 16-cell until E3.5 blastocyst, irrespective of any specific position of the cell within the embryo (Fig4B; Movie EV4). The ICM-specific expression became restricted only at late E4.5 (≥ 128-cell) blastocyst.
Figure 4.
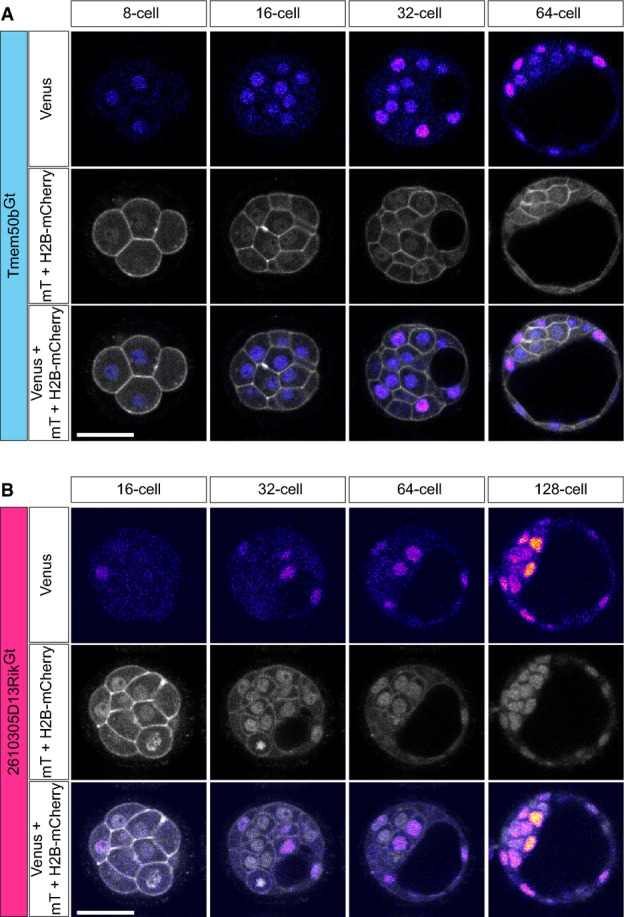
Four-dimensional live imaging of the pre-implantation development of ICM and TE lineage reporter mice
- Representative images of a Tmem50bGt-Venus × R26-H2B-mCherry × mT embryo developing from the 8- to 64-cell stage (n = 27 embryos in n = 3 experiments). Upper row panels show Venus expression, middle panels mT and H2B-mCherry expression, and lower panels all fluorescent channels merged.
- Representative images of a 2610305D13RikGt-Venus × R26-H2B-mCherry × mT embryo developing from the 16- to 128-cell stage (n = 27 embryos in n = 3 experiments). Upper panels show Venus expression, middle panels mT and H2B-mCherry expression, and lower panels all fluorescent channels merged.
Data information: Scale bars are 50 μm. All images are single confocal sections and representative for n ≥ 3 independent experiments. Venus expression images are shown using a fire LUT, and mT and mCherry are shown using a gray scale LUT.
To quantitatively characterize the expression dynamics of the VET reporters for Tmem50b and 2610305D13Rik genes during blastocyst development, we segmented the nuclei, tracked their trajectories through divisions, measured the signal intensity for Venus and normalized it against that of H2B-mCherry. This allowed us to fully track and quantify the dynamic change in expression of Tmem50bGt (n = 3 embryos) and 2610305D13RikGt (n = 3 embryos) throughout 4 cell cycles over a 3-day period. A representative set of Venus expression data after tracking of all 8 blastomeres and its descendants in a single embryo is shown for Tmem50bGt (FigEV4A) and 2610305D13RikGt (FigEV4B). Using the mT membrane signal, a binary information on cell position was assigned at each time point as either “inside” (red line), when entirely surrounded by other cells, or “outside” (blue line), when part of the cell surface is exposed to the outside. In many cases, blastomeres did not stop in their position immediately after mitosis but progressively moved toward their final position during interphase (see tracks changing from “blue” to “red” during interphase in Figs5 and EV4; Appendix Figs S3 and S4), in agreement with recent live imaging studies 32-45,46.

The expression dynamics of lineage markers
- A representative track for the expression dynamics of Tmem50bGt-Venus expression based on live imaging of a Tmem50bGt-Venus × R26-H2B-mCherry × mT embryo. Note that these data are integrated in the lineage map shown in Fig5A.
- A representative track for the expression dynamics of 2610305D13RikGt Venus expression based on live imaging of a 2610305D13RikGt-Venus × R26-H2B-mCherry × mT embryo. Note that these data are integrated in the lineage map shown in Fig5B. Blue and red lines indicate outside and inside cells, respectively. Venus expression is normalized to mCherry signal.
Figure 5.

A lineage map of mouse pre-implantation development
- A, B Lineage segregation maps of all cells of two embryos indicating cell position and a lineage reporter expression. (A) Lineages from the 8- to 32-cell stage based on live imaging a Tmem50bGt-Venus × R26-H2B-mCherry × mT embryo. Venus expression intensity is normalized first to mCherry and subsequently to the maximum expression intensity of all cells in the same cell cycle stage of an embryo. Each box in the lineage tree ranges from 0 to 1 in normalized expression. Blue and red lines indicate outside and inside cells, respectively. Blue–white–red scale indicates relative distance of nuclei to the surface of the embryo. Dagger marks cells undergoing apoptosis, and cell lineages lost during imaging are labeled with an “L”. (B) Lineages from the 8- to 64-cell stage based on live imaging of a 2610305D13RikGt-Venus × R26-H2B-mCherry × mT embryo. Arrows highlight representative descendant pairs as a result of asymmetric divisions (white: essentially no difference in the expression level; yellow: higher expression in the outside cell than in the inside cell).
Finally, all the extracted lineage relationships, gene expression dynamics and binary (inside or outside) cell-positional information were integrated into a comprehensive lineage map starting from the beginning of 8-cell until the late 32- or late 64-cell stage (FigEV5). To supplement the binary cell-positional information, a relative position of nuclei along the embryonic radial axis was included in the map. The extracted nuclear position is effectively in agreement with the manually annotated binary cellular position. Altogether, we have established a complete lineage map of early mouse development in which lineage tracks are integrated with gene expression dynamics, absolute cell position and relative nuclei position (Fig5, one representative map is shown for each lineage reporter, for which the expression dynamics are presented in Fig EV4; two more maps for each lineage are presented in Appendix Fig S3 for Tmem50bGt and in Appendix Fig S4 for 2610305D13RikGt).
Establishment of an enhanced lineage map of mouse pre-implantation development
Lineage maps are generated by tracking all nuclei of an embryo over several divisions. Binary cellular position, that is, inside (red) or outside (blue) position, as judged by the membrane contacts, and relative nuclear position, scaled by blue–white–red gradient, were combined with fluorescence intensity of the VET reporter measured in nuclei and incorporated into the lineage map.
Quantitative expression analysis reveals distinct mechanisms underlying ICM and TE lineage specification
Using the established lineage maps, we wished to better understand the potential mechanism underlying ICM and TE lineage specification. For each lineage marker, we sought for the cue in the map that would allow us to predict the lineage, ICM or TE, at the earliest possible time in embryonic development.
First, we investigated the potential contribution of the division pattern to the regulation of lineage-specific gene expression. The orientation of the 8- to 16-cell division in relation to the cellular apico-basal axis was proposed to play a key role in the ICM vs. TE lineage segregation 2. Indeed, we noted that many asymmetric divisions, defined in this study as a division generating one inside- and one outside-positioned descendant, are followed by an upregulation of Tmem50bGt in the outer descendant. Out of 48 divisions from 8- to 16-cell stage for all 6 embryos analyzed (3 each for Tmem50bGt and 2610305D13RikGt), we identified 31 asymmetric divisions (64.6%), and out of 96 divisions from 16- to 32-cell stage, we identified 18 asymmetric divisions (18.8%). To examine the relationship between division pattern and gene expression, we have assembled the trajectories for all asymmetric divisions (n = 16 for 8- to 16-cell stage and n = 7 for 16- to 32-cell stage for Tmem50bGt, and n = 15 for 8- to 16-cell stage and n = 11 for 16- to 32-cell stage for 2610305D13RikGt) and collectively compared the change in gene expression upon 8- to 16-cell and 16- to 32-cell divisions between the outer and inner descendants (Fig6A–C). This sister cell analysis indicated that the Tmem50bGt expression is upregulated upon asymmetric division and becomes significantly higher in the outer cell as compared to the inner sister for both—8- to 16-cell and 16- to 32-cell—divisions (Fig6A and C; P = 0.0011 and P = 0.0019 for 8- to 16- and 16- to 32-cell divisions, respectively, by two-sided Wilcoxon rank-sum test). In contrast, no such temporal change could be observed for 2610305D13RikGt expression in the inside cells upon asymmetric division (Fig6B and C; P = 0.0158 and P = 0.0943 for 8- to 16- and 16- to 32-cell divisions, respectively). The expression of 2610305D13RikGt in outside cells becomes higher upon asymmetric 8- to 16-cell divisions; however, the overall level of expression remains low during 8- to 32-cell stages (see Fig EV4B), and the biological significance of this temporal change remains to be investigated. Taken together, these data suggest that asymmetric division drives the upregulation of a TE lineage marker expression specifically in the outer descendants, but it does not drive a reciprocal upregulation of an ICM lineage marker in the inner descendant.
Figure 6.

Quantitative analyses of the expression dynamics of TE and ICM lineage markers
- Venus expression dynamics, normalized to mCherry signal, in cells of Tmem50bGt-Venus × R26-H2B-mCherry × mT embryos dividing asymmetrically from 8- to 16-cell (n = 16 divisions in n = 3 embryos) and 16- to 32-cell stage (n = 7 divisions in n = 3 embryos; see text and Materials and Methods for details). Blue and red lines indicate outside and inside cells, respectively. Time point of division is set at t = 0 h.
- Venus expression, normalized to mCherry signal, in cells of 2610305D13RikGt-Venus × R26-H2B-mCherry × mT embryos dividing asymmetrically from 8- to 16-cell (n = 15 divisions in n = 3 embryos) and 16- to 32-cell stage (n = 11 divisions in n = 3 embryos).
- A pairwise difference of cumulative Venus expression between the descendants of asymmetric divisions (outside cell minus inside cell) at the 16- and 32-cell stages in Tmem50bGt (blue box plots; expression dynamics depicted in A; two-sided Wilcoxon rank-sum test; P (16-cell) = 0.0011; P (32-cell) = 0.0019) and 2610305D13RikGt embryos (red box plots; depicted in B). Inset depicts an example taken from (A) in which the measured value is highlighted in gray.
- Mean rate of change of the normalized Venus intensity from t = 0 to 6 h after division in outside and inside cells for 16- (n = 32 and n = 16) and 32- (n = 56 and n = 40) cell stage in Tmem50bGt (left; Wilcoxon rank-sum test, P (32-cell) = 2 × 10⁻⁵) and for 16- (n = 33 and n = 15), 32- (n = 53 and n = 41) and 64- (n = 106 and n = 84) cell stages in 2610305D13RikGt (right; Wilcoxon rank-sum test, P (64-cell) = 0.025) embryos. Blue and red median bars mark outside and inside cells, respectively. Statistical significance is indicated as * (P < 0.05) or ** (P < 0.001).
Since the asymmetric 8- to 16-cell or 16- to 32-cell divisions did not upregulate the ICM reporter expression in the inside cells, we sought for other possible cues that would correlate with differential expression of the ICM reporter. From our VET reporter, the dynamics of gene expression could be more faithfully reflected in their increase than in their decrease, because dynamics of degradation of Venus-NLS protein may be different than those of the endogenous protein. As anticipated, live imaging of maternal Venus protein decay in wt embryos derived from a gene-trap line (Ctnna1Gt/+) gave an estimate for the relevant half-life of 17 ± 3 h (n = 16, Appendix Fig S5). Thus, instead of the total level, we analyzed the average rate of the expression change for the Tmem50bGt reporter in outside and inside cells during 16- (n = 32 and n = 16) and 32-cell stages (n = 56 and n = 40), and for the 2610305D13RikGt reporter in outside and inside cells during 16- (n = 33 and n = 15), 32- (n = 53 and n = 41) and 64-cell stages (n = 106 and n = 84; Fig6D). As an alternative to the orientation of cell division, we investigated the possible role of cell position within the embryo (inside or outside) 1, in the regulation of lineage reporter expression. The data indicate that while the TE reporter Tmem50bGt is upregulated more strongly in outside cells than inside cells as early as at the 32-cell stage (P = 2 × 10⁻⁵), higher expression of the ICM reporter 2610305D13RikGt in inside cells as compared to outside cells becomes evident only at the 64-cell stage (P = 0.025). Furthermore, in many cells that change position within the embryo from outside to inside, the expression of TE reporter remains low, whereas their sibling cells that remain outside upregulate the expression (Fig5A, examples marked with yellow arrows). Therefore, cell position within the embryo indeed correlates with differential expression of our lineage reporters. Together, our lineage map allows us to faithfully allocate outer cell fate earlier than inner cell fate, in agreement with a recent study 32.
Discussion
In this study, we successfully generated novel lineage-specific fluorescent reporters by a fluorescence gene-trap screen in the mouse pre-implantation embryo. The screen was primarily designed to identify fluorescent reporter lines suitable for live imaging of pre-implantation development, while the possibility of examining the functional requirement of the trapped genes was subsidiary to the main goal. Generally, it would be ideal to generate a knock-in fluorescence-fusion reporter that would reflect the endogenous dynamics and function 18. However, the successful use of such lines will crucially depend on the endogenous expression level of the gene and on the sensitivity of live imaging microscopy, precisely the signal detection efficiency relative to the laser illumination, since the mammalian embryo is particularly sensitive to light exposure 47. In the present study, we adjusted the spatio-temporal resolution to enable manual tracking, positional annotation and segmentation of nuclei for signal quantitation while ensuring efficient development of the embryo. More advanced microscopy, for example, selective-plane illumination microscope (SPIM) 48,49, will allow live imaging of knock-in fluorescence-fusion reporters and with higher resolution for automated tracking and segmentation in the future. Using an unbiased approach, we aimed at discovering new markers for the first lineages in the early mouse embryo and fully characterized the expression dynamics of two genes with previously unknown specificity to ICM or TE lineage. This will be helpful to further study the gene network regulating lineage specification in the blastocyst.
We also present here advanced image analysis tools and strategies to include the increasing amount of information into lineage tracks to facilitate an integrative understanding of embryonic development and lineage segregation 16. We developed a pipeline to establish a lineage map of embryonic development by live imaging the newly established VET lines and integrating gene expression dynamics and cell-positional information into lineage trees. These maps allowed us to analyze comprehensively and quantitatively gene expression dynamics as the first lineages are progressively segregated during mouse blastocyst development. Thus, our image analysis revealed gene expression dynamics in relation to particular morphogenetic processes. In light of the available models 1,2, we focused our analysis to the possible link between the cell division pattern or cell position, and upregulation of lineage-specific gene expression. The systematic analyses presented here suggest that the expression of TE and ICM lineage markers is not initiated in a reciprocal and antagonistic manner as suggested earlier 2,3 but rather with different timings and through distinct mechanisms (Fig7); namely, the upregulation of a TE lineage marker begins earlier and may be largely driven by asymmetric division, while that for the ICM marker may not be following the same mechanism. The mechanism regulating the ICM marker expression remains elusive, and the initiation of expression appears stochastic in the morula and early blastocyst stages without obvious correlation with position and the future lineage 4,8. This finding is in line with our recent single-cell gene expression profiling study demonstrating genome-wide stochastic gene expression in the inner cells of the 32-cell stage blastocyst 7.
Figure 7.
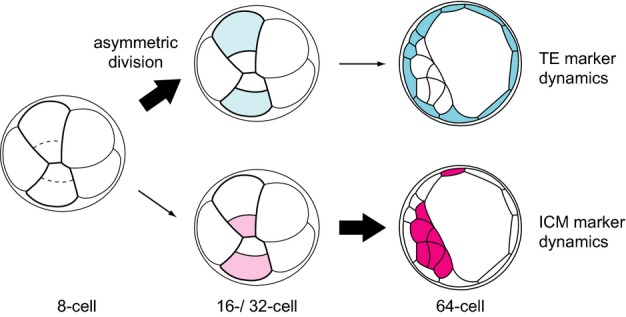
A new model for TE and ICM lineage segregation
Distinct mechanisms for the acquisition of the TE or ICM molecular identity. TE or ICM molecular identity is acquired in a non-binary fashion and at different developmental times. The specific expression of a TE fate marker (blue) is established through asymmetric divisions from 8- to 16-cell and 16- to 32-cell stage, as quantified by our reporter mice. The ICM-specific gene (red) expression is non-reciprocal to the TE marker and only becomes ICM specific at the late 64-cell stage.
While in the current study image analysis was mostly performed manually, future development of automatic image processing will allow more comprehensive analysis with a large amount of image sets. This might help seeing through the apparently stochastic expression of the ICM markers. The fluorescent signals in a live embryo and its live imaging analysis will also allow to isolate a cell specifically expressing one, or eventually multiple, lineage marker(s) at a particular stage, and perform single-cell transcriptome analysis 7 to acquire comprehensive information of gene expression 16.
This study represents the first step in such an integrative approach, and its fu rther development will enable us to understand the mechanisms underlying the early lineage segregation in the mammalian embryo.
Materials and Methods
Animal works, embryo recovery and culture
All animal works were performed in the animal facility at the Max Planck Institute for Molecular Biomedicine or at the European Molecular Biology Laboratory, according to the permission from the Landesamt für Natur, Umwelt und Verbraucherschutz NRW, Germany (projects #9.93.2.10.36.07.168 and #87-51.04.2010.A223) or to the permission by the institutional veterinarian overseeing the operation (ARC number TH11 00 11), respectively. The animal facilities are operating according to international animal welfare rules (Federation for Laboratory Animal Science Associations guidelines and recommendations). No statistical method was used to estimate the sample size for animal experiments.
Isolation and culturing of embryos was performed as described previously 4. Embryos were isolated from superovulated (C57BL/6xC3H) F1 female mice mated with (C57BL/6xC3H) F1 male mice. Superovulation was induced by intraperitoneal (ip) injection of 5 international units (IU) pregnant mare’s serum gonadotropin (PMSG, Intervet Intergonan), followed by ip injection of 5 IU human chorionic gonadotropin (hCG, Intervet Ovogest 1500) 44–48 h later. Embryos were washed with FHM (Millipore, MR-024-D) several times and cultured in a 10 μl microdrop of KSOM (Millipore, MR-121-D) covered with mineral oil (Sigma, M8410 or Acros Organics) in 5% CO2 atmosphere at 37°C.
Zygotes were recovered from oviduct ampullae 18–22 h after hCG injection. Cumulus cells were removed by briefly washing in 300 μg/ml hyaluronidase (Sigma, Typ IV-S, H4272) in FHM. Two-cell embryos to morulae were flushed from oviducts on day 1.5 to 2.5 after hCG injection with a fine canule (Acufirm, 1400 LL 23). Blastocysts were flushed from uteri on day 3.5 or 4.5 with a wide canule (Acufirm, 1400 LL 18). Embryos were handled using an aspirator tube (Sigma, A5177-5EA) or a hand pipette holder (Vitrolife, Sweden) equipped with a glass pipette pulled from Pasteur pipettes.
For the analysis shown in Fig3, expression of Venus in Cdx2 backgrounds was analyzed at E4.5. At E4.5, embryos reached the transition from 7th to 8th cell cycle (containing 65 to 128 cells to 129 to 256 cells). Cdx2+/+ embryos had 122.0 ± 23.3 cells (n = 4), Cdx2+/− embryos had 136.0 ± 13.9 cells (n = 4), and Cdx2−/− embryos had 118.5 ± 21.8 cells (n = 4) (average ± s.d.). Expression of Venus in Tead4 embryos was analyzed at E3.5, because many cells of Tead4−/− embryos began to show signs of apoptosis at E3.5 with fragmented chromosomes and could not be analyzed later. At E3.5, embryos reached the beginning of the 7th cell cycle (65 to 128 cells). Tead4+/+ embryos had n = 72.2 ± 7.8 cells (n = 5), Tead4+/− embryos had n = 65.4 ± 11.4 cells (n = 6), and Tead4−/− embryos had 66.7 ± 3.1 cells (n = 6) (average ± s.d.).
Lentiviral transgenesis
Delivery of the gene-trap cassette into the mouse genome was achieved using self-inactivating lentiviruses (sinLVs 50). The pRRL-based lentiviral vector carries a gene-trap cassette with Venus as a fluorescent reporter (sinLV-pRRL-K; Fig1A). To enhance the signal, Venus is coupled to the 39 nucleotides SV40-T-antigen nuclear localization signal (NLS) domain 51, followed by the woodchuck hepatitis post-transcriptional regulatory element (WPRE 52) and the bovine growth hormone gene polyadenylation signal (pA 53). The gene-trap cassette utilizes a 3′ splice consensus sequence from the type II adenovirus major late transcript intron 1/exon 2 (splice acceptor, SA 54) to trap 5′ splice consensus sequences (splice donors) from endogenous transcripts. Stop codons in all three reading frames prevent formation of a fusion protein, and the encephalomyocarditis virus (EMCV) internal ribosomal entry site (IRES 55) guides translation of Venus-NLS. Additional elements non-essential for the gene-trap cassette are FRT sites 56 flanking the gene-trap cassette, as well as a LOXP2272 57 and an AttB element 58 5′ of the pA.
Lentiviruses were produced and harvested according to the published procedure 52 and were concentrated by ultracentrifugation to titers of 1 to 5.4 × 10⁹ viral genomes per ml. Preliminary transduction of the mouse zygote using sinLV-pRRL-K was inefficient in producing embryos with detectable signal at the late blastocyst stage (n = 1/54 in three independent trials), whereas efficient transduction was achieved with the embryos infected at the 2-cell stage.
Two-cell embryos were prepared for transgenesis by removal of the zona pellucida through incubation in pronase (0.5% w/v Protease; Sigma, P8811) for 2–3 min. The denuded embryos were co-cultured with concentrated virus (2 × 10⁸ to 1 × 10⁹ HeLa-transducing units/ml) in FHM for 6–8 h. After three washes in FHM, the embryos were transferred to KSOM and cultured for 3 days. To prevent aggregation of embryos, individual denuded embryos were placed in microwells prepared with an aggregation needle (BLS) directly inside the microdrops of medium.
Identification of proviral integrations and the trapped genes
Genomic DNA was isolated from tail tissue, as described by The Jackson Laboratory (http://jaxmice.jax.org/support/genotyping/tail_phenol.html), by digestion with proteinase K (Sigma, P2308, 0.5 mg/ml in 50 mM Tris–HCl (pH 8.0), 100 mM EDTA (pH 8.0), 100 mM NaCl, 1% SDS) at 55°C followed by purification with phenol–chloroform–isoamylalcohol (25:24:1, Roth, A156.1). The aqueous phase was separated from the organic phase using phase lock gels (5 Prime, VWR International, 713-2534). The gDNA was then precipitated with 100% ethanol (Roth, 9065.3), washed in 70% ice-cold ethanol and resuspended in 100 μl buffer TE (Invitrogen, 12090-015).
Proviral integration sites were detected by Southern blot. Southern blots were performed with a α-32P-dCTP-labeled probe against Venus (711 bp NcoI/BsrGI fragment). Ten micrograms of gDNA was digested with 250 U EcoRI (NEB, R0101M) for 12 h and subsequently loaded in 10 × 1 mm pockets on a 20 × 25 cm 0.8% agarose gel (Lonza). After 6–7 h at 120 V, the DNA in the gel was depurinated in 0.25 N HCl for 20 min and denatured in 0.5 M NaOH and 1.5 M NaCl for two times 15 min, before blotting the DNA onto a nylon membrane (GE Healthcare, Nylon Hybond N, RPN203N). The membrane was neutralized in 0.05 M Na2HPO4·2H2O at pH 6.5 for 30 min and then slightly dried between blotting papers (Schleicher & Schuell, GB005). The gDNA was then cross-linked to the membrane two times at 0.125 Joule. The cross-linked gDNA was pre-hybridized for 2 h at 65°C in pre-hybe buffer (5× SSC, 5× Denhardt’s solution, 0.025 M NaH2PO4·H2O at pH 6.5, 0.1% SDS, 0.1 mg/ml fish ssDNA in ddH2O). This solution was then replaced with hybe buffer (pre-hybe buffer supplemented with 10% dextran sulfate Na salt) and α-32P-dCTP-labeled Venus and incubated overnight. To radioactively label Venus, 75 ng DNA per 45 μl TE was processed with 2.5 μl α-32P-dCTP (10 mCi/ml, Perkin-Elmer, Redivue) using the Rediprime II kit (GE Healthcare, RPN 1633) and purified using the ProbeQuant G-50 microcolumn (GE Healthcare, 28-9034-08) according to the manufacturer’s protocol. Membranes were then washed two times for 15 min at room temperature in 2× SSC with 0.1% SDS and two times for 15 min at 65°C in 0.5× SSC with 0.1% SDS. Membranes were then exposed to calcium tungstate intensifying screens (Hyperscreen, GE Healthcare, RPN1663) at room temperature and analyzed on a phosphorimager (FLA-7000, Fujifilm). Additionally, membranes were exposed to films (Amersham Hyperfilm ECL, GE Healthcare, 28906837) at −80°C and developed (Agfa Curix 60).
Proviral integration sites were identified by ligation-mediated (LM)-PCR (modified from 59). One microgram genomic DNA was MseI (60 U, NEB R0525L)-digested and purified (Promega Wizard SV A 2360). Mse-linker oligos (Mse linker+: 5′-GTAATACGACTCACTATAGGGCTCCGCTTAAGGGAC-3′, Mse linker−: 5′-PO4-TAGTCCCTTAAGCGGAG-NH4 (C7)-3′, 20 μM each) were hybridized by heating to 90°C and then decreasing the temperature to 1°C every 3 min to a final temperature of 20°C. In a total reaction volume of 20 μl, 3.5 μl of 20 μM MseI linker was ligated with 400 U T4 ligase (NEB, M0202S) to 13.5 μl MseI-digested gDNA. To remove bacterial contamination and intra-proviral fragments, the ligation was digested with 40 U DpnI (NEB, R0176) and 40 U SacI (R0156) in 50 μl total volume for 4 h. A first PCR was performed in 25 μl total reaction volume using 5 μl processed gDNA, 0.3 μM of primers MKL-3 (5′-CTTAAGCCTCAATAAAGCTTGCCTTGAG-3′) and MseL1 (5′-GTAATACGACTCACTATAGGGC-3′) each, 0.2 mM dNTP mix, 0.5 μl Taq polymerase (Advantage 2, TaKaRa 639207) and 1× buffer. The thermal cycler settings were 1 min at 94°C (hot start), seven rounds of 2 s at 94°C and 1 min at 72°C, followed by 37 rounds of 2 s at 94°C and 1 min at 67°C and a final elongation step of 4 min at 72°C. Nested PCR was performed on 1 μl of a 1:200 dilution of the first PCR, 0.3 μM of primers MseL2 (5′-AGGGCTCCGCTTAAGGGAC-3′) and MKL-5 (5′-TGACTCTGGTAACTAGAGATCCCTCAG-3′) each, 0.2 mM dNTP mix, 0.5 μl Taq polymerase (Advantage 2) and 1× buffer. The thermal cycler settings for the nested PCR were 1 min at 94°C (hot start), five rounds of 2 s at 94°C and 1 min at 75°C, followed by 20 rounds of 2 s at 94°C and 1 min at 72°C and a final elongation step of 4 min at 72°C. The nested PCR product was run on a 0.8% agarose gel and purified (Qiagen, 28706). The isolated fragment was TOPO-TA cloned into pCR4 and transformed into TOP-Ten or DH5α E. coli and the bacteria plated according to the manufacturer’s instructions (Invitrogen, TOPO-TA, K4575J10). Colonies were picked the following day and grown in LB medium with 50 μg/ml ampicillin overnight at 37°C. Plasmids were purified using the QIAprep Spin system (Qiagen, 27106) and subsequently sequenced using M13 reverse primer.
Alternatively, integration sites were identified using thermal asymmetric interlaced (TAIL)-PCR 60,61 performed as described by 62, using the arbitrary degenerate primers and cycling conditions proposed there. Gene-specific primers were designed to identify either the region adjacent to the 3′-end of the integration (ISP-provirK-31 (5′-CTTTCCCCCTGGCCTTAACCGAATTT-3′), ISP-provirK-32 (5′-TTTTCCCATCGCGATCTAATTCTCCC-3′), ISP-provirK-33 (5′-GCTTAATACTGACGCTCTCGCACCCA-3′)) or the region adjacent to the 5′-end of the integration (ISP-provirK-51 (5′-GGGGATCAATTCGAGCTCGGTACGA-3′), ISP-provirK-52 (5′-GGAACTTCACCGGTATTTGGGGGATC-3′), ISP-provirK-53 (5′-GGGATCAATTCGAGCTCGGTACCTTT-3′)).
The primary PCR was conducted using 3 μl gDNA in a total reaction volume of 20 μl (1× buffer, 1.5 mM MgCl2, 0.2 mM dNTP (each), 0.15 μM ISP 1.3 μM AD primer, 1 U Taq DNA polymerase). Two microliters of a 1:20 dilution of this PCR was used as template in the secondary PCR with a total volume of 20 μl (1× buffer, 1.5 mM MgCl2, 0.2 mM dNTP (each), 0.2 μM ISP 2, 2 μM AD primer, 1 U Taq DNA polymerase). Of this secondary PCR, 10 μl of a 1:10 dilution was used as template in the tertiary PCR with a total volume of 100 μl (1× buffer, 1.5 mM MgCl2, 0.2 mM dNTP (each), 0.2 μM ISP 3.2 μM AD primer, 1 U Taq DNA polymerase). DNA fragments from tertiary reactions were purified, subcloned and amplified like DNA fragments from LM-PCR, using the pGEM®-T Easy Vector System (Promega, Fitchburg, USA) instead of the TOPO-TA system.
The cloned sequences were cleaned from vector, primer and proviral sequences to perform a BLAT search against genomic sequences of the GRCm38/mm10 (December 2011) or GRCm38.p3 (release 78; December 2014) assembly of the mouse (Mus musculus) genome (FigEV1). In a few cases, it was difficult to unequivocally identify the integration site: The integration site for VET53A includes highly repetitive sequences that have an equally high homology to 2610305D13Rik, Rex2, Zfp600, Gm13145, Gm13242 and Gm13152. RT–PCRs, however, showed that only 2610305D13Rik exhibits the expression specific to ICM cells in E4.5 blastocysts but not in E3.5 blastocysts, in a manner consistent with the Venus expression pattern (Appendix Fig S2A); thus, the trapped gene was tentatively assigned as 2610305D13Rik (marked by an asterisk in Fig2A). The integration site for VET53C is assigned as “X” (hidden) and the Venus signal was always detected in males, suggesting that the integration site is on Y chromosome for which the available sequence information is limited. The integration sites were mapped to karyotype ideograms (Fig1E) using the Ensembl Karyoview. Trapped transcripts were detected by 5′RACE as described below and searched against cDNAs (transcripts/splice variants; BLASTN) or genomic sequences (BLAT) of the GRCm38.p3 (release 78; December 2014) assembly of the mouse genome (Fig EV1).
For genotyping VET mice, proviral integrants were detected by PCR on genomic DNA using a pair of primers specific for Venus (5′-TGAACCGCATCGAGCTGAAG-3′) and WPRE (5′-GCAATGCCCCAACCAGT-3′) yielding a 671-bp fragment. Known integration sites were exponentially amplified by multiplex integration-site-specific PCR using a set of three primers, one inside the provirus (5′-GGACTACTGCGCCCTACAGA-3′) and two specific for genomic sequences flanking the provirus. Specific primers are listed in Table EV1. Reactions were performed in a total volume of 20 μl containing 50 to 100 ng gDNA, 0.7× to 1.0× PCR buffer (+KCl/−MgCl2), 1.5 mM to 2.5 mM MgCl2, 0.2 mM dNTP mix (Fermentas, R0192), 0.4 μM of each primer and 0.5 U Taq polymerase (Fermentas, EP0402). The reaction was initiated at 94°C for 4 min, followed by 35 rounds of 1 min at 94°C, 1 min at 52°C to 62°C and 1 min at 72°C (see Table EV1 for details). An additional final elongation was performed for 7 min at 72°C.
5′ Rapid amplification of cDNA ends (RACE)
First-strand cDNA was synthesized from purified total RNA using 400 U reverse transcriptase (SuperScript III, Invitrogen, 18080), 5 mM DTT, 1× buffer, 2 pmol specific primer IRES-2 (5′-AACTCACAACGTGGCACTGG-3′), 30 U RNase inhibitor (Qiagen, 129918) and 0.5 mM dNTPs (Fermentas, R0192) in a total volume of 20 μl. RNA was then degraded using ribonuclease H (Fermentas, EN0201) and subsequently purified using the Qiaex II gel extraction kit (Qiagen, 20021) following the manufacturers’ protocols. First-strand cDNA was tailed using 30 U TdT (Invitrogen, 10533-065) in 1× buffer and 0.2 mM dATP (Invitrogen, 10216-018) in a total volume of 20 μl. First PCR was performed on 2 μl tailed cDNA using primers QA (5′-CCAGTGAGCAGAGTGACGAGGAC-3′) and IRES-(−) (5′-CCTCACATTGCCAAAAGACGGC-3′) at 0.4 μM and QT (5′-CCAGTGAGCAGAGTGACGAGGACTCGAGCTCAAGCTTTTTTTTTTTTTTTTT-3′) at 0.02 μM in the PCR master mix (Genaxxon, M3014) in a total volume of 50 μl. Second PCR was performed on 1 μl of a 1: 50 dilution of the first PCR product using primers QB (5′-GACGAGGACTCGAGCTCAAGC-3′) and O-IRES-1b-(−) (5′-CAAACGCACACCGGCCTTATTC-3′) at 0.4 μM and QT at 0.02 μM in the PCR Mastermix (Genaxxon, M0314). The second PCR product was purified from 1% agarose gel and TOPO-TA cloned before sequencing as described above.
Genotyping of single embryos
After live imaging Tmem50bGt or 2610305D13RikGt embryos in Tead4−/− or Cdx2−/− backgrounds, embryo genotypes were assessed by genomic PCR of single embryos. Embryos were transferred to lysis buffer containing proteinase K (0.2 μg/μl) and 1× PCR buffer (with KCl, Fermentas, EP0402) in H2O. Lysis was performed at 55°C for 1 h and 96°C for 10 min. For PCR, 2 to 5 μl of the lysate was used. Cdx2 < tm1Fbe > (MGI: 1857928) and Tead4 < IRES-lacZ > (RIKEN accession number: CDB0409K) embryos were genotyped as described elsewhere 41,63, whereas 2610305D13RikGt, Tmem50bGt, Ctnna1Gt and Supt6Gt were genotyped as described above.
Total RNA isolation from placenta
For homogenization, placentas were washed in PBS, snap-frozen in the vapor phase of liquid nitrogen and after addition of 600 μl lysis buffer RLT (Qiagen, RNeasy Mini Kit, 74104) treated with a Precellys 24 using 1.4-mm ceramic beads at 5,000 rpm for 15 s. Total RNA was isolated using the RNeasy Mini Kit (Qiagen, 74104) using the manufacturer’s protocol.
Isolation of trophectoderm cells by manual bisection of the blastocyst
TE cell samples were collected from E4.5 embryos after they hatched from the zona pellucida. E4.5–E4.75 blastocysts were manually bisected at the ICM-blastocyst cavity boundary by cutting with a 30Gx1/2 needle (BD, 305771) and removing polar TE cells and the ICM cells. The remaining mural TE cells were immediately transferred to 100 μl TRI reagent (Ambion, AM9738) at 4°C and stored at −20°C until RNA extraction.
RNA isolation from trophectoderm cells and reverse transcription
To extract RNA, 20% v/v of trichloromethane was added to TE samples in TRI reagent, followed by 15 min centrifugation at 4°C at 12,000 rpm. The supernatant was transferred into a fresh tube together with 50% v/v 2-propanol and 3 μl glycogen (Ambion, AM9510). Samples were incubated for 15 min on ice and centrifuged for 30 min at 4°C at 12,000 rpm, and the supernatant was discarded. The pellet was washed with 80% ethanol and dried. Reverse transcription was performed using SuperScript® III First-Strand Synthesis System for RT–PCR (Life Technologies, 18080-051) according to the manufacturer’s instructions, using oligo(dT)20 priming method. The cDNA synthesis was performed for 1 h.
qRT–PCR
Single-cell cDNA samples for qRT–PCR were prepared by Y. Onishi, and inside–outside position was determined as described in 7. qRT–PCR was performed using SYBR® Green PCR Master Mix (Life Technologies, 4309155) on ABI StepOne devices (Life Technologies, 4376357, Ser. No. 272006386) according to the manufacturer’s instruction with 5 μM primer concentration in 10 μl final sample volume, run for 40 cycles. Each sample was run in duplicates with a negative control and Gapdh as a housekeeping gene control, all in the same experiment. ES cell cDNA samples were added to each experiment in two dilutions to ensure normalized amplification between experiments. The primers sequences were as follows: Cdx2 (5′-ATTGTTTGCTGCTGTTCGAGTC-3′, 5′-CGACTTCCCTTCACCATACAAC-3′), Gapdh (5′-ATGAATACGGCTACAGCAACAGG-3′, 5′-CTCTTGCTCAGTGTCCTTGCTG-3′), Gm13145 (5′-TGGACTTCTCATCGGAGGAA-3′, 5′-TGTTCCACGACCTTCTCCTT-3′), Gm13152 (5′-TAATCCGGGCAACAAGAATG-3′, 5′-GCACAATGACCTCTGAGCAA-3′), Gm13242 (5′-CTGCCAGATCAGAGGTCTCC-3′, 5′-TGGTGAGGAGCAAACATTCA-3′), Oct4 (5′-GGCTCCTGATCAACAGCATCAC-3′, 5′-GATGCTGTGAGCCAAGGCAAG-3′), Rex2 (5′-TGCTCAGTCAACTCTCCGTAA-3′, 5′-TGGTGAGGAGCAAACATTCA-3′), Sox2 (5′-CATGAGAGCAAGTACTGGCAAG-3′, 5′-CCAACGATATCAACCTGCATGG-3′), Tmem50b (5′-GCGGTGGCTTCTCTATTCAT-3′, 5′-AAGAGAACCGTGTGCATTTT-3′), Zfp600 (5′-CATGGATGTGATGTTGGAGAA-3′, 5′-TGTGCTGTGTTTCTTGTTCCA-3′) and 2610305D13Rik (5′-TGAATGTTTGCTCCTCACCA-3′, 5′-TGAGACATTCCCATTCCTCTG-3′). Raw data were processed using StepOne Software (Life Technologies, version 2.3). A threshold for determining Ct values was set in the linear phase of amplification, at an equal value for the same gene in different experiments. The baseline was selected automatically and controlled manually for any software algorithm-induced mistakes.
After confirming sample and experiment quality by assessing negative control, ES cell cDNA amplification and melt curves, average values of the technical replicates were calculated for each gene. No replicates had to be excluded from the calculation. The ΔCt value was calculated by subtracting the average Ct value of Gapdh from the average Ct value of the gene of interest for the same sample within the same experiment. Within a category (EPI, PE or TE cells), ΔCt values for a single gene were used to calculate the average and standard deviation, as described in Appendix Fig S2. In negative controls and samples where cDNA for the gene in question was not present, the Ct value of one or both duplicates could not be determined by the StepOne Software algorithm. The average Ct value in such samples was set to the maximum experiment cycle number and used to calculate average and standard deviation for Appendix Fig S2A. Where melt curve analysis indicated a shift of the product melting temperature (Tm) to a different value (such as for 2610305D13Rik), the samples resulting from qRT–PCR reaction were additionally run on an agarose gel to identify the size of the product. The samples in which the product size did not correspond to that of control samples were marked by an asterisk in Appendix Fig S4, and the Ct values were not used to calculate average and standard deviation. For Appendix Fig S2B, ΔCt value of samples marked with asterisk was set to a maximum value on the plot for representation purposes and does not reflect an actual ΔCt as explained above. No statistical analysis of data distribution could be performed for samples in Appendix Fig S2 as no numerical value is available for several cells.
Immunohistochemistry
Embryos were fixed in 2% (for Supt6 and Ctnna1) or 4% (for other stainings) paraformaldehyde (Sigma, P6148) in PBS for 10 to 15 min. For stainings with anti-GFP antibody, the embryos were sorted into Venus positive and negative groups prior to fixation and remained separated throughout the procedure. After fixation, the embryos were washed with 0.1% Tween-20 (Sigma, P7949) in PBS (PBS-T) and permeabilized in 0.25% (for Supt6 and Ctnna1) or 0.5% (for other stainings) Triton X-100 (Sigma, T8787) in PBS for 30 min. Subsequently, the embryos were washed in PBS-T, blocked with 3% BSA in PBS-T (blocking solution) and incubated with the following primary antibodies in blocking solution at 4°C overnight: rabbit polyclonal anti-Spt6 (Abcam, ab32820, 1:2,000 dilution), rabbit monoclonal anti-Ctnna1 (Abcam, ab51032, 1:100 dilution), rabbit polyclonal anti-GFP (MBL, Code No. 598, 1:500 dilution) and goat polyclonal anti-Sox2 (Y-17, sc-17320, Santa Cruz Biotechnology, 1:100 dilution) or mouse monoclonal anti-Cdx2 (Biogenex, MU392-UC, 1:200 dilution). After washing in blocking solution, embryos were incubated with secondary antibodies as follows: for Supt6 and Ctnna1, 1 h with Alexa Fluor 546 donkey anti-rabbit (Life Technologies, A10040, 1:100 dilution) and Alexa Fluor 647 donkey anti-rabbit (Life Technologies, A31573, 1:100 dilution), respectively; for others, 2 h at room temperature with Alexa Fluor 488 donkey anti-goat (Life Technologies, A11055, 1:200 dilution) or Alexa Fluor 488 donkey anti-mouse (Life Technologies, A21202, 1:200 dilution) in addition to Alexa Flour 546 donkey anti-rabbit (Life Technologies, A10040, 1:200 dilution) and Phalloidin 633 (Life Technologies, A22284, 1:50 dilution), all in blocking solution. When nuclear staining was required, the embryos were washed with PBS-T containing DAPI (Life Technologies, D3571, 1:2,000 dilution) and imaged immediately in the same solution. All incubation, washing and imaging steps were performed at room temperature unless stated otherwise. The stained embryos were imaged with LSM780 (Zeiss) equipped with a 40× water-immersion C-Apochromat 1.2 NA objective lens (Zeiss), using Zen 2010 software (Zeiss). The images were processed using Fiji running ImageJ (NIH, USA).
Live imaging microscopy
For microscopic analysis and live imaging, embryos were cultured in 5 μl drops prepared on a 0.17-mm glass-bottom dish (ZOG3, Elekon Science or MatTek, P35G-1.5-20C) in a 5% CO2 chamber (PeCon). Temperature was maintained by a Tempcontrol 37–2 digital (Zeiss) at 37.5°C in a plastic chamber incubator XL (Zeiss) and a heatable mounting frame M-H (Zeiss), attached to a Zeiss Axiovert 200 M with Narishige manipulators. Fluorescence was detected with a Zeiss Axio Observer equipped with a 25×/0.8 LCI Plan Neofluar water-immersion objective lens (Zeiss). The light source was either a Colibri LED at 505 nm combined with a 60 HE filter set or a HXP lamp with a 46 HE filter set (Zeiss). For four-dimensional imaging, LSM780 (Zeiss) was used with a 40× water-immersion C-Apochromat 1.2 NA objective lens (Zeiss). Triple transgenic embryos carrying H2B-mCherry and membrane-tdTomato in addition to a Venus-trap reporter were prepared and imaged from 2- to 4-cell up to 128-cell stage (about 72 h). Venus was excited using a 514-nm argon laser, while mCherry and tdTomato were excited using a 561-nm DPSS laser. Z-stacks were recorded every 20 min and reconstructed from up to 55 images at 2 μm distance at 8-bit and 512 × 512 pixel resolution. Zen 2010 software (Zeiss) was used for the acquisition of images.
Half-life of the Venus-NLS protein was determined as decay of maternal Venus-NLS in wt embryos derived from mating heterozygous Ctnna1Gt mice (see FigEV4). Four-cell stage blastomeres were dissociated in calcium- and magnesium-free KSOM medium (1/4-cell), as described previously 4 and imaged until 4/16-cell stage.
Image analysis
Image analysis was performed using AxioVision (Zeiss), Imaris (Bitplane), Fiji running ImageJ (USA) or Matlab (The MathWorks).
For lineage mapping (Figs5 and EV4; Appendix Figs S3 and S4), a total of 364 cells were tracked until early 64-cell (n = 3 embryos for Tmem50bGt) or late 64-cell (n = 3 embryos for 2610305D13RikGt; 94.8% of n = 384 cells). Due to blastocyst expansion, 14 cells were lost during tracking. A total of 54 cells (14.8%), in particular 47 of 83 ICM cells (56.6%) during the 64-cell stage, underwent nuclear DNA fragmentation, indicative of apoptosis 5.
Fluorescence signal in Figs3 and EV3 was quantified using Fiji by manually selecting the area to be analyzed and extracting sum intensities from single confocal sections. Fluorescence intensities were normalized to the highest level of expression. Quantitation in Figs5, 6 and EV4; Appendix Figs S3, S4 and S5 was done after four-dimensional lineage tracking. Segmentation was done manually or, if applicable, automatically using Imaris (Bitplane). Spots of 6 to 10 μm diameter were assigned to all nuclei based on Venus and/or H2B-mCherry signal. For Appendix Fig S4, Venus mean fluorescence intensities were normalized with the highest level of expression. For Figs5, 6 and EV4; Appendix Figs S3 and S4, Venus mean fluorescence intensities were normalized using nuclear mCherry mean fluorescence intensities. In the case of lineage maps shown in Fig5; Appendix Figs S3 and S4, fluorescence intensity was further normalized to the maximum expression intensity of all cells in the same cell cycle stage of an embryo. In Figs6 and EV4, the normalized Venus intensity was additionally normalized to the highest level of expression within the displayed set of data.
Binary information of cell position (inside or outside) was determined based on mT signal. Blastomeres with circumferential contacts to cells were defined to be inside, whereas blastomeres lacking circumferential contacts to cells were defined to be outside (see FigEV5). Furthermore, relative position of nuclei was determined for each time point. For that, the approximate surface of the entire embryo was determined by finding the center of mass and the radius of a fitted hollow sphere, whose surface was closest to the convex hull of all nuclear positions. Nuclear positions were manually annotated using Imaris as described above. For each individual nucleus, the distance to the surface was calculated. Distant scales are defined in units of 1.2 times the radius of the calculated convex hull. Blue corresponds to nuclei close to the surface and red to nuclei deep inside the embryo. Nuclei outside the calculated convex hull with surface distances larger than 0.2 times radius were assigned the distance 0 (dark blue) as well. To generate lineage trees, spot-segmented nuclei were manually or, if applicable, automatically connected to tracks.
For the analysis shown in Fig6A and B, the individual cell divisions of the same cell cycle stage were identified separately for all embryos carrying TE and ICM lineage markers. For each stage, the expression of the parent and the two descendant cells was plotted only if parent cells were found to be outside (blue) and one of the descendant cells was found to switch inside (red) within the following cell cycle stage. Time zero indicates the time point of division. The Venus expression intensity was normalized to the maximum intensity of all lineages within an embryo. In Fig6C, for each pair of descendant blastomeres in Fig6A and B, the difference in cumulative expression from 0 to 7 h post-division was measured for those tracks for which the expression data are available for the first 7 h (see inset in Fig6C). For Fig6D, Venus expression intensity was extracted as described for Fig6A, except that expression curves of all descendant cells were included in the analysis. In this analysis, the curves rate of change was measured and averaged between 0 and 6 h for those tracks for which the expression data are available for the first 6 h.
Statistical analysis
Box plot graphs were generated, and statistical analyses were performed using IBM SPSS Statistics (version 22) and Matlab. No statistical methods were used to ensure adequate power to detect a pre-specified effect size. Samples were either chosen randomly for analysis without pre-established criteria or all available data were used. No randomization was applied and outcome assessment was not blinded.
For statistical analysis, data were first analyzed for normality using Shapiro–Wilk’s test. Variance was either assessed using Levene’s test or judged based on box plots. Non-parametric significance tests for independent samples were performed for the analysis in Figs3B, D, F and H, 6C and D, EV3A2, A4, B2 and B4, since many data sets were not normally distributed and variance was not always similar. For the analysis presented in Figs3B, D, F and H and EV3A2, A4, B2 and B4, significance tests were performed pairwise using Kruskal–Wallis H-tests, because more than two groups were compared. For the analysis presented in Fig6C and D, the two-sided Wilcoxon rank-sum test was performed. In Fig6C, the sample distribution tested was derived by calculating a set of pairwise differences in cumulative Venus expression intensity of all descendant cells with all other descendant cells, effectively ignoring family relationships and inside–outside associations. The same test was performed pairwise in Fig6D comparing inside and outside blastomeres.
Acknowledgments
We thank Ramona Bloehs for excellent technical support; Alexander Aulehla, Anne Ephrussi, Darren Gilmour, Francois Spitz and all members of the Hiiragi laboratory for valuable discussions; Marc-Olivier Sauvain and Meylan Sylvain for technical help and discussions; Yasumasa Ishida for discussion on the possible designs for a gene-trap vector; animal facilities at the MPI for Molecular Biomedicine and at EMBL, as well as the advanced light microscopy facility at EMBL for excellent support; Dietmar Vestweber and Marika Meyer zu Brickwedde for sharing technical knowledge and space for Southern blot; and Alexander Aulehla, Ekaterina Korotkevich, Jean-Léon Maître and Ritsuya Niwayama for critical readings. Work in the laboratory of T.H. was supported by EMBL, the Max Planck Society, European Research Council under the European Commission FP7, Stem Cell Network North Rhine Westphalia and German Research Foundation (Deutsche Forschungsgemeinschaft). Work in the laboratory of L.H. was supported by EMBL and the Center of Modeling and Simulation in the Biosciences (BIOMS) of the University of Heidelberg. All mouse lines were deposited to and are available at the RIKEN BioResource Center (Tsukuba, Japan).
Author contributions
J-ED and TH conceived and designed the study; J-ED performed the experiments presented in Figs6 and EV1–5; Appendix Figs S3–S5 with the help of SW, AP and SS; and LP performed the experiments presented in Appendix Figs S1 and S2 with help of SS; SG, J-ED and LH performed image analyses presented in Figs5, 6, EV4 and EV5; Appendix Figs S3 and S4. ACG and DT helped J-ED to generate lentiviral vectors and to analyze the integration sites. TH wrote the paper, except for Materials and Methods and Figure Legends written by J-ED and LP, with inputs from all authors.
Conflict of interest
The authors declare that they have no conflict of interest.
Supporting Information
Appendix
Expanded View Figures PDF
Table EV1
Movie EV1
Movie EV2
Movie EV3
Movie EV4
Movie Legends
Review Process File
References
- Tarkowski AK, Wróblewska J. Development of blastomeres of mouse eggs isolated at the 4- and 8-cell stage. J Embryol Exp Morphol. 1967;18:155–180. [PubMed] [Google Scholar]
- Johnson MH, Ziomek CA. The foundation of two distinct cell lineages within the mouse morula. Cell. 1981;24:71–80. doi: 10.1016/0092-8674(81)90502-x. [DOI] [PubMed] [Google Scholar]
- Niwa H, Toyooka Y, Shimosato D, Strumpf D, Takahashi K, Yagi R, Rossant J. Interaction between Oct3/4 and Cdx2 determines trophectoderm differentiation. Cell. 2005;123:917–929. doi: 10.1016/j.cell.2005.08.040. [DOI] [PubMed] [Google Scholar]
- Dietrich J-E, Hiiragi T. Stochastic patterning in the mouse pre-implantation embryo. Development. 2007;134:4219–4231. doi: 10.1242/dev.003798. [DOI] [PubMed] [Google Scholar]
- Plusa B, Piliszek A, Frankenberg S, Artus J, Hadjantonakis A-K. Distinct sequential cell behaviours direct primitive endoderm formation in the mouse blastocyst. Development. 2008;135:3081–3091. doi: 10.1242/dev.021519. [DOI] [PMC free article] [PubMed] [Google Scholar]
- Ralston A, Rossant J. Cdx2 acts downstream of cell polarization to cell-autonomously promote trophectoderm fate in the early mouse embryo. Dev Biol. 2008;313:614–629. doi: 10.1016/j.ydbio.2007.10.054. [DOI] [PubMed] [Google Scholar]
- Ohnishi Y, Huber W, Tsumura A, Kang M, Xenopoulos P, Kurimoto K, Oleś AK, Araúzo-Bravo MJ, Saitou M, Hadjantonakis A-K, et al. Cell-to-cell expression variability followed by signal reinforcement progressively segregates early mouse lineages. Nat Cell Biol. 2014;16:280–281. doi: 10.1038/ncb2881. [DOI] [PMC free article] [PubMed] [Google Scholar]
- Schrode N, Saiz N, Di Talia S, Hadjantonakis A-K. GATA6 levels modulate primitive endoderm cell fate choice and timing in the mouse blastocyst. Dev Cell. 2014;29:454–467. doi: 10.1016/j.devcel.2014.04.011. [DOI] [PMC free article] [PubMed] [Google Scholar]
- Hiiragi T, Solter D. First cleavage plane of the mouse egg is not predetermined but defined by the topology of the two apposing pronuclei. Nature. 2004;430:360–364. doi: 10.1038/nature02595. [DOI] [PubMed] [Google Scholar]
- Srinivas S, Rodriguez T, Clements M, Smith JC, Beddington RSP. Active cell migration drives the unilateral movements of the anterior visceral endoderm. Development. 2004;131:1157–1164. doi: 10.1242/dev.01005. [DOI] [PubMed] [Google Scholar]
- Hadjantonakis A-K, Papaioannou VE. Dynamic in vivo imaging and cell tracking using a histone fluorescent protein fusion in mice. BMC Biotechnol. 2004;4:33. doi: 10.1186/1472-6750-4-33. [DOI] [PMC free article] [PubMed] [Google Scholar]
- Motosugi N, Bauer T, Polanski Z, Solter D, Hiiragi T. Polarity of the mouse embryo is established at blastocyst and is not prepatterned. Genes Dev. 2005;19:1081–1092. doi: 10.1101/gad.1304805. [DOI] [PMC free article] [PubMed] [Google Scholar]
- Plusa B, Hadjantonakis A-K, Gray D, Piotrowska-Nitsche K, Jedrusik A, Papaioannou VE, Glover DM, Zernicka-Goetz M. The first cleavage of the mouse zygote predicts the blastocyst axis. Nature. 2005;434:391–395. doi: 10.1038/nature03388. [DOI] [PubMed] [Google Scholar]
- Morris SA, Teo RTY, Li H, Robson P, Glover DM, Zernicka-Goetz M. Origin and formation of the first two distinct cell types of the inner cell mass in the mouse embryo. Proc Natl Acad Sci. 2010;107:6364–6369. doi: 10.1073/pnas.0915063107. [DOI] [PMC free article] [PubMed] [Google Scholar]
- Kurotaki Y, Hatta K, Nakao K, Nabeshima Y-I, Fujimori T. Blastocyst axis is specified independently of early cell lineage but aligns with the ZP shape. Science. 2007;316:719–723. doi: 10.1126/science.1138591. [Supporting Online Material] [DOI] [PubMed] [Google Scholar]
- Wennekamp S, Mesecke S, Nédélec F, Hiiragi T. A self-organization framework for symmetry brea king in the mammalian embryo. Nat Rev Mol Cell Biol. 2013;14:454–461. doi: 10.1038/nrm3602. [DOI] [PubMed] [Google Scholar]
- Hamilton TG, Klinghoffer RA, Corrin PD, Soriano P. Evolutionary divergence of platelet-derived growth factor alpha receptor signaling mechanisms. Mol Cell Biol. 2003;23:4013–4025. doi: 10.1128/MCB.23.11.4013-4025.2003. [DOI] [PMC free article] [PubMed] [Google Scholar]
- McDole K, Zheng Y. Generation and live imaging of an endogenous Cdx2 reporter mouse line. Genesis. 2012;50:775–782. doi: 10.1002/dvg.22049. [DOI] [PMC free article] [PubMed] [Google Scholar]
- Xenopoulos P, Kang M, Puliafito A, Di Talia S, Hadjantonakis A-K. Heterogeneities in Nanog expression drive stable commitment to pluripotency in the mouse blastocyst. Cell Rep. 2015;10:1508–1520. doi: 10.1016/j.celrep.2015.02.010. [DOI] [PMC free article] [PubMed] [Google Scholar]
- Filipczyk A, Gkatzis K, Fu J, Hoppe PS, Lickert H, Anastassiadis K, Schroeder T. Biallelic expression of nanog protein in mouse embryonic stem cells. Cell Stem Cell. 2013;13:12–13. doi: 10.1016/j.stem.2013.04.025. [DOI] [PubMed] [Google Scholar]
- Kawakami K, Takeda H, Kawakami N, Kobayashi M, Matsuda N, Mishina M. A transposon-mediated gene trap approach identifies developmentally regulated genes in zebrafish. Dev Cell. 2004;7:133–144. doi: 10.1016/j.devcel.2004.06.005. [DOI] [PubMed] [Google Scholar]
- Larsen C, Franch-Marro X, Hartenstein V, Alexandre C, Vincent J-P. An efficient promoter trap for detection of patterned gene expression and subsequent functional analysis in Drosophila. Proc Natl Acad Sci USA. 2006;103:17813–17817. doi: 10.1073/pnas.0607652103. [DOI] [PMC free article] [PubMed] [Google Scholar]
- Morin X, Daneman R, Zavortink M, Chia W. A protein trap strategy to detect GFP-tagged proteins expressed from their endogenous loci in Drosophila. Proc Natl Acad Sci USA. 2001;98:15050–15055. doi: 10.1073/pnas.261408198. [DOI] [PMC free article] [PubMed] [Google Scholar]
- International Mouse Knockout Consortium. Collins FS, Rossant J, Wurst W. A mouse for all reasons. Cell. 2007;128:9–13. doi: 10.1016/j.cell.2006.12.018. [DOI] [PubMed] [Google Scholar]
- Stanford WL, Cohn JB, Cordes SP. Gene-trap mutagenesis: past, present and beyond. Nat Rev Genet. 2001;2:756–768. doi: 10.1038/35093548. [DOI] [PubMed] [Google Scholar]
- Kwon GS, Viotti M, Hadjantonakis A-K. The endoderm of the mouse embryo arises by dynamic widespread intercalation of embryonic and extraembryonic lineages. Dev Cell. 2008;15:509–520. doi: 10.1016/j.devcel.2008.07.017. [DOI] [PMC free article] [PubMed] [Google Scholar]
- Rompolas P, Deschene ER, Zito G, Gonzalez DG, Saotome I, Haberman AM, Greco V. Live imaging of stem cell and progeny behaviour in physiological hair-follicle regeneration. Nature. 2012;487:496–499. doi: 10.1038/nature11218. [DOI] [PMC free article] [PubMed] [Google Scholar]
- Snippert HJ, Flier LGVD, Sato T, Es JHV, Born MVD, Kroon-Veenboer C, Barker N, Klein AM, Rheenen JV, Simons BD, et al. Intestinal crypt homeostasis results from neutral competition between symmetrically dividing Lgr5 stem cells. Cell. 2010;143:134–144. doi: 10.1016/j.cell.2010.09.016. [DOI] [PubMed] [Google Scholar]
- Srinivas S. Imaging cell movements in egg-cylinder stage mouse embryos. Cold Spring Harb Protoc. 2010;2010 doi: 10.1101/pdb.prot5539. pdb.prot5539. [DOI] [PubMed] [Google Scholar]
- Bedzhov I, Zernicka-Goetz M. Self-organizing properties of mouse pluripotent cells initiate morphogenesis upon implantation. Cell. 2014;156:1032–1044. doi: 10.1016/j.cell.2014.01.023. [DOI] [PMC free article] [PubMed] [Google Scholar]
- Yamanaka Y, Tamplin OJ, Beckers A, Gossler A, Rossant J. Live imaging and genetic analysis of mouse notochord formation reveals regional morphogenetic mechanisms. Dev Cell. 2007;13:884–896. doi: 10.1016/j.devcel.2007.10.016. [DOI] [PubMed] [Google Scholar]
- Watanabe T, Biggins JS, Tannan NB, Srinivas S. Limited predictive value of blastomere angle of division in trophectoderm and inner cell mass specification. Development. 2014;141:2279–2288. doi: 10.1242/dev.103267. [DOI] [PMC free article] [PubMed] [Google Scholar]
- Hubbard T, Andrews D, Caccamo M, Cameron G, Chen Y, Clamp M, Clarke L, Coates G, Cox T, Cunningham F, et al. Ensembl 2005. Nucleic Acids Res. 2005;33:D447–D453. doi: 10.1093/nar/gki138. [DOI] [PMC free article] [PubMed] [Google Scholar]
- Kent WJ, Sugnet CW, Furey TS, Roskin KM, Pringle TH, Zahler AM, Haussler D. The human genome browser at UCSC. Genome Res. 2002;12:996–1006. doi: 10.1101/gr.229102. [DOI] [PMC free article] [PubMed] [Google Scholar]
- O’Kane CJ, Gehring WJ. Detection in situ of genomic regulatory elements in Drosophila. Proc Natl Acad Sci USA. 1987;84:9123–9127. doi: 10.1073/pnas.84.24.9123. [DOI] [PMC free article] [PubMed] [Google Scholar]
- Gossler A, Joyner AL, Rossant J, Skarnes WC. Mouse embryonic stem cells and reporter constructs to detect developmentally regulated genes. Science. 1989;244:463–465. doi: 10.1126/science.2497519. [DOI] [PubMed] [Google Scholar]
- Torres M, Stoykova A, Huber O, Chowdhury K, Bonaldo P, Mansouri A, Butz S, Kemler R, Gruss P. An alpha-E-catenin gene trap mutation defines its function in preimplantation development. Proc Natl Acad Sci USA. 1997;94:901–906. doi: 10.1073/pnas.94.3.901. [DOI] [PMC free article] [PubMed] [Google Scholar]
- Sasaki H. Mechanisms of trophectoderm fate specification in preimplantation mouse development. Dev Growth Differ. 2010;52:263–273. doi: 10.1111/j.1440-169X.2009.01158.x. [DOI] [PubMed] [Google Scholar]
- Yagi R, Kohn MJ, Karavanova I, Kaneko KJ, Vullhorst D, DePamphilis ML, Buonanno A. Transcription factor TEAD4 specifies the trophectoderm lineage at the beginning of mammalian development. Development. 2007;134:3827–3836. doi: 10.1242/dev.010223. [DOI] [PubMed] [Google Scholar]
- Strumpf D, Mao C-A, Yamanaka Y, Ralston A, Chawengsaksophak K, Beck F, Rossant J. Cdx2 is required for correct cell fate specification and differentiation of trophectoderm in the mouse blastocyst. Development. 2005;132:2093–2102. doi: 10.1242/dev.01801. [DOI] [PubMed] [Google Scholar]
- Nishioka N, Yamamoto S, Kiyonari H, Sato H, Sawada A, Ota M, Nakao K, Sasaki H. Tead4 is required for specification of trophectoderm in pre-implantation mouse embryos. Mech Dev. 2008;125:270–283. doi: 10.1016/j.mod.2007.11.002. [DOI] [PubMed] [Google Scholar]
- Abe T, Kiyonari H, Shioi G, Inoue K-I, Nakao K, Aizawa S, Fujimori T. Establishment of conditional reporter mouse lines at ROSA26 locus for live cell imaging. Genesis. 2011;49:579–590. doi: 10.1002/dvg.20753. [DOI] [PubMed] [Google Scholar]
- Muzumdar MD, Tasic B, Miyamichi K, Li L, Luo L. A global double-fluorescent Cre reporter mouse. Genesis. 2007;45:593–605. doi: 10.1002/dvg.20335. [DOI] [PubMed] [Google Scholar]
- Anani S, Bhat S, Honma-Yamanaka N, Krawchuk D, Yamanaka Y. Initiation of Hippo signaling is linked to polarity rather than to cell position in the pre-implantation mouse embryo. Development. 2014;141:2813–2824. doi: 10.1242/dev.107276. [DOI] [PubMed] [Google Scholar]
- McDole K, Xiong Y, Iglesias PA, Zheng Y. Lineage mapping the pre-implantation mouse embryo by two-photon microscopy, new insights into the segregation of cell fates. Dev Biol. 2011;355:239–249. doi: 10.1016/j.ydbio.2011.04.024. [DOI] [PMC free article] [PubMed] [Google Scholar]
- Yamanaka Y, Lanner F, Rossant J. FGF signal-dependent segregation of primitive endoderm and epiblast in the mouse blastocyst. Development. 2010;137:715–724. doi: 10.1242/dev.043471. [DOI] [PubMed] [Google Scholar]
- Takenaka M, Horiuchi T, Yanagimachi R. Effects of light on development of mammalian zygotes. Proc Natl Acad Sci USA. 2007;104:14289–14293. doi: 10.1073/pnas.0706687104. [DOI] [PMC free article] [PubMed] [Google Scholar]
- Krzic U, Gunther S, Saunders TE, Streichan SJ, Hufnagel L. Multiview light-sheet microscope for rapid in toto imaging. Nat Meth. 2012;9:730–733. doi: 10.1038/nmeth.2064. [DOI] [PubMed] [Google Scholar]
- Tomer R, Khairy K, Amat F, Keller PJ. Quantitative high-speed imaging of entire developing embryos with simultaneous multiview light-sheet microscopy. Nat Meth. 2012;9:755–763. doi: 10.1038/nmeth.2062. [DOI] [PubMed] [Google Scholar]
- Dull T, Zufferey R, Kelly M, Mandel RJ, Nguyen M, Trono D, Naldini L. A third-generation lentivirus vector with a conditional packaging system. J Virol. 1998;72:8463–8471. doi: 10.1128/jvi.72.11.8463-8471.1998. [DOI] [PMC free article] [PubMed] [Google Scholar]
- Nagoshi E, Saini C, Bauer C, Laroche T, Naef F, Schibler U. Circadian gene expression in individual fibroblasts: cell-autonomous and self-sustained oscillators pass time to daughter cells. Cell. 2004;119:693–705. doi: 10.1016/j.cell.2004.11.015. [DOI] [PubMed] [Google Scholar]
- Zufferey R, Donello JE, Trono D, Hope TJ. Woodchuck hepatitis virus posttranscriptional regulatory element enhances expression of transgenes delivered by retroviral vectors. J Virol. 1999;73:2886–2892. doi: 10.1128/jvi.73.4.2886-2892.1999. [DOI] [PMC free article] [PubMed] [Google Scholar]
- Soriano P, Montgomery C, Geske R, Bradley A. Targeted disruption of the c-src proto-oncogene leads to osteopetrosis in mice. Cell. 1991;64:693–702. doi: 10.1016/0092-8674(91)90499-o. [DOI] [PubMed] [Google Scholar]
- Friedrich G, Soriano P. Promoter traps in embryonic stem cells: a genetic screen to identify and mutate developmental genes in mice. Genes Dev. 1991;5:1513–1523. doi: 10.1101/gad.5.9.1513. [DOI] [PubMed] [Google Scholar]
- Jang SK, Kräusslich HG, Nicklin MJ, Duke GM, Palmenberg AC, Wimmer E. A segment of the 5′ nontranslated region of encephalomyocarditis virus RNA directs internal entry of ribosomes during in vitro translation. J Virol. 1988;62:2636–2643. doi: 10.1128/jvi.62.8.2636-2643.1988. [DOI] [PMC free article] [PubMed] [Google Scholar]
- Andrews BJ, Proteau GA, Beatty LG, Sadowski PD. The FLP recombinase of the 2 micron circle DNA of yeast: interaction with its target sequences. Cell. 1985;40:795–803. doi: 10.1016/0092-8674(85)90339-3. [DOI] [PubMed] [Google Scholar]
- Lee G, Saito I. Role of nucleotide sequences of loxP spacer region in Cre-mediated recombination. Gene. 1998;216:55–65. doi: 10.1016/s0378-1119(98)00325-4. [DOI] [PubMed] [Google Scholar]
- Landy A, Ross W. Viral integration and excision: structure of the lambda att sites. Science. 1977;197:1147–1160. doi: 10.1126/science.331474. [DOI] [PMC free article] [PubMed] [Google Scholar]
- Schröder ARW, Shinn P, Chen H, Berry C, Ecker JR, Bushman F. HIV-1 integration in the human genome favors active genes and local hotspots. Cell. 2002;110:521–529. doi: 10.1016/s0092-8674(02)00864-4. [DOI] [PubMed] [Google Scholar]
- Liu YG, Mitsukawa N, Oosumi T, Whittier RF. Efficient isolation and mapping of Arabidopsis thaliana T-DNA insert junctions by thermal asymmetric interlaced PCR. Plant J. 1995;8:457–463. doi: 10.1046/j.1365-313x.1995.08030457.x. [DOI] [PubMed] [Google Scholar]
- Liu YG, Whittier RF. Thermal asymmetric interlaced PCR: automatable amplification and sequencing of insert end fragments from P1 and YAC clones for chromosome walking. Genomics. 1995;25:674–681. doi: 10.1016/0888-7543(95)80010-j. [DOI] [PubMed] [Google Scholar]
- Pillai MM, Venkataraman GM, Kosak S, Torok-Storb B. Integration site analysis in transgenic mice by thermal asymmetric interlaced (TAIL)-PCR: segregating multiple-integrant founder lines and determining zygosity. Transgenic Res. 2008;17:749–754. doi: 10.1007/s11248-007-9161-4. [DOI] [PubMed] [Google Scholar]
- Chawengsaksophak K, James R, Hammond VE, Köntgen F, Beck F. Homeosis and intestinal tumours in Cdx2 mutant mice. Nature. 1997;386:84–87. doi: 10.1038/386084a0. [DOI] [PubMed] [Google Scholar]
Associated Data
This section collects any data citations, data availability statements, or supplementary materials included in this article.
Supplementary Materials
Appendix
Expanded View Figures PDF
Table EV1
Movie EV1
Movie EV2
Movie EV3
Movie EV4
Movie Legends
Review Process File