Abstract
Although the two catalytic subunits of the SWI/SNF chromatin-remodeling complex—Brahma (Brm) and Brg1—are almost invariably co-expressed, their mutually exclusive incorporation into distinct SWI/SNF complexes predicts that Brg1- and Brm-based SWI/SNF complexes execute specific functions. Here, we show that Brg1 and Brm have distinct functions at discrete stages of muscle differentiation. While Brg1 is required for the activation of muscle gene transcription at early stages of differentiation, Brm is required for Ccnd1 repression and cell cycle arrest prior to the activation of muscle genes. Ccnd1 knockdown rescues the ability to exit the cell cycle in Brm-deficient myoblasts, but does not recover terminal differentiation, revealing a previously unrecognized role of Brm in the activation of late muscle gene expression independent from the control of cell cycle. Consistently, Brm null mice displayed impaired muscle regeneration after injury, with aberrant proliferation of satellite cells and delayed formation of new myofibers. These data reveal stage-specific roles of Brm during skeletal myogenesis, via formation of repressive and activatory SWI/SNF complexes.
Keywords: Brahma, cyclin D1, skeletal myogenesis, SNF/SWI, transcription
Introduction
Developmental and adult skeletal myogenesis are activated by the basic helix-loop-helix (bHLH) family of myogenic regulatory factors (MRFs), MyoD, Myf5, MRF4, and myogenin, which share the ability to promote transcription from E-box sequences (CANNTG) found in the regulatory region of many muscle-specific genes 1-3. MRF competence to promote transcription of muscle genes relies on the interaction with the SWI/SNF chromatin-remodeling complex 4,5. SWI/SNF complex appears to mediate the unique ability of MyoD and Myf5 to remodel the chromatin and activate transcription at previously silent muscle loci 6,7, but is also required for the maintenance of muscle gene expression at later stages of skeletal myogenesis 8. SWI/SNF complexes are composed of two mutually exclusive enzymatic subunits (the ATPases Brahma (Brm) and Brm-related gene 1 (Brg1)) and a number of structural subunits, collectively referred to as Brg1/Brm-associated factors (BAFs) 9,10. Because of the variable, cell type-specific assembly of distinct subunits and their alternative variants, SWI/SNF complexes are heterogeneous in their composition and function 11-13. This structural and functional heterogeneity suggests that distinct SWI/SNF complexes might simultaneously exist in the same cell type to perform specialized functions depending on the cell context and differentiation stage. One major determinant of SWI/SNF variability is conferred by the mutually exclusive incorporation of the catalytic ATPase, Brg1 and Brm. Several studies have shown the importance of Brg1- and Brm-based complexes in the control of gene expression, cell proliferation, differentiation and transformation 14,15. Both Brg1 and Brm are also known to interact with and stimulate the activity of several transcription factors, including the glucocorticoid receptor and C/EBP 16,17. Other studies have suggested a functional redundancy between Brm and Brg1 18-20,21.
Collectively, the information reported above seems in apparent conflict with the mutually exclusive presence of Brg1 and Brm in individual SWI/SNF complex and prompted an interest toward elucidating specific functions of these two proteins in various cellular processes. Previous attempts to address the individual role of Brg1 and Brm during skeletal myogenesis, by using dominant negative mutants, revealed an essential role for both proteins in the activation of the myogenic program 6-23. However, the conclusions from these studies were limited by the use of an experimental system in which the myogenic program was activated in fibroblasts by tetracycline-inducible MyoD, and Brg1 and Brm were functionally inactivated by enzymatically defective dominant negative mutants 22 or neutralizing antibodies 23. Moreover, while these seminal studies clearly indicated the importance of both Brg1 and Brm in the activation of the myogenic program, the individual role of each subunit in the control of discrete transcriptional networks could not be established. More recently, Imbalzano’s laboratory has exploited RNAi to knock down the levels of Brg1, showing that Brg1 controls muscle genes and muscle-specific microRNAs (myomiRs) expression in skeletal muscle cells 24. Likewise, we have shown by RNAi-mediated knockdown the essential role of Brg1/BAF60C-based SWI/SNF complex in the activation of the myogenic program in C2C12 muscle cells 25. Still, the specific function of Brm in skeletal myogenesis remains obscure to date.
Gene knockout studies in mice have demonstrated that inactivating mutations in Brg1 are embryonic lethal, whereas Brm-inactivated mice are viable and fertile, suggesting that Brg1 may functionally replace Brm within the SWI/SNF complexes during development 26-28. However, Brm−/− mice show increased body weight and alteration of cellular growth control 26,28, indicating the requirement of Brm in the control of tissue growth, differentiation, and homeostasis. Despite the high degree of homology between the two subunits and their partial overlapping role, different expression profiles were reported by Muchardt et al 29 showing that Brg1 is expressed constitutively, whereas Brm levels fluctuate with increased expression in G0-arrested cells and in cells induced to differentiate; furthermore, the expression of Brm, but not Brg1, was negatively regulated upon mitogenic stimulation as well as in ras-transformed cells 29. Moreover, Brm and Brg1 appear to direct distinct cellular pathways, by recruitment to specific promoters through preferential interaction with certain classes of transcription factors. Brg1 binds to zinc finger protein through a unique N-terminal domain not present in Brm, while Brm interacts with two ankyrin-repeats proteins that are crucial in the Notch signal transduction 30. More recently, studies have investigated the individual roles of Brg1 and Brm in various cellular processes, revealing again individual, cooperating, and redundant activities of these two proteins depending on the cell type and the specific context 18-20,21.
In the present study, we have used an integrated genome wide analysis of gene expression and gene knockdown with in vitro and in vivo studies to systematically address the role of Brg1 and Brm during skeletal myogenesis.
Results
Differential expression profiles and function of Brg1 and Brm during C2C12 skeletal muscle differentiation
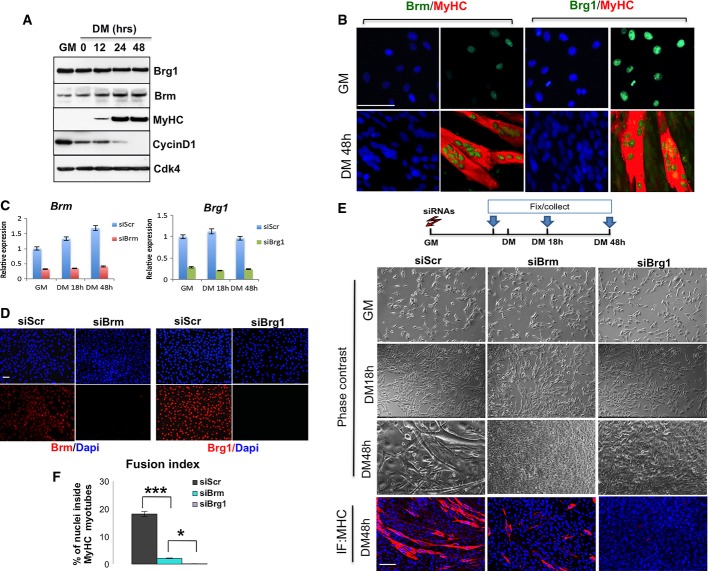
We compared the expression levels of Brg1 and Brm in C2C12 myoblasts during proliferation (growth medium, GM) and differentiation into myotubes (differentiation medium, DM). This transition is well illustrated by the relative expression levels of cyclin D1 (detected in proliferating myoblasts and downregulated during differentiation) and myosin heavy chain (MyHC), which is specifically induced during C2C12 differentiation (Fig1). While the same levels of expression of Brg1 protein were detected in proliferating myoblasts and during the whole differentiation process, Brm protein and RNA levels were progressively upregulated during C2C12 differentiation (Fig1A and C). Consistently, immunofluorescence analysis revealed nuclear expression of Brm detectable in few undifferentiated myoblasts, while a higher signal was detected in all the nuclei of MyHC-expressing myotubes (Fig1B). By contrast, Brg1 showed a uniform nuclear expression in both undifferentiated myoblasts and differentiated myotubes (Fig1B). These data indicate that Brg1 and Brm are differentially regulated during skeletal muscle differentiation.
Figure 1.
Brm and Brg1 show specific profiles of expression and activities during skeletal muscle differentiation
- Time course of protein expression during terminal differentiation of C2C12 myoblasts representative of three independent experiments. Myoblasts were cultured in growth medium (GM) until they reached confluence, and then shifted to differentiate in differentiation medium (DM) for 48 h. Cellular extracts were analyzed by Western blot with antibodies against BRG1, Brm, myosin heavy chain (MyHC), and cyclin D1. Cdk4 probing was used to check for equal loading of the samples.
- Immunofluorescence analysis of Brm and Brg1 expression in C2C12 cells cultured in GM or DM conditions. Scale bar, 50 μm.
- Efficiency of BRM and BRG1 knockdown at 48 h post-transfection performed in C2C12 cells using siRNAs (control interference is a scrambled sequence and referred as siScr) was monitored by qRT–PCR. Data are presented as average ± SEM (n > 3).
- Immunofluorescence for Brm or Brg1 performed in proliferating myoblasts upon siRNA against Brg1 (siBrg1), Brm (siBrm) or scrambled (siScr) to check for efficient depletion of the proteins. Scale bar, 50 μm.
- Brightfield images and MyHC staining were performed at various time points of differentiation in C2C12 cells in which siRNAs were delivered in GM as depicted in the scheme above. Scale bar, 50 μm.
- Quantification of fusion index of three independent experiments calculated as percentage of nuclei within MyHC-expressing myotubes. Data are presented as average ± SEM (n > 3). *P < 0.05; ***P < 0.001 (unpaired Student’s t-test).
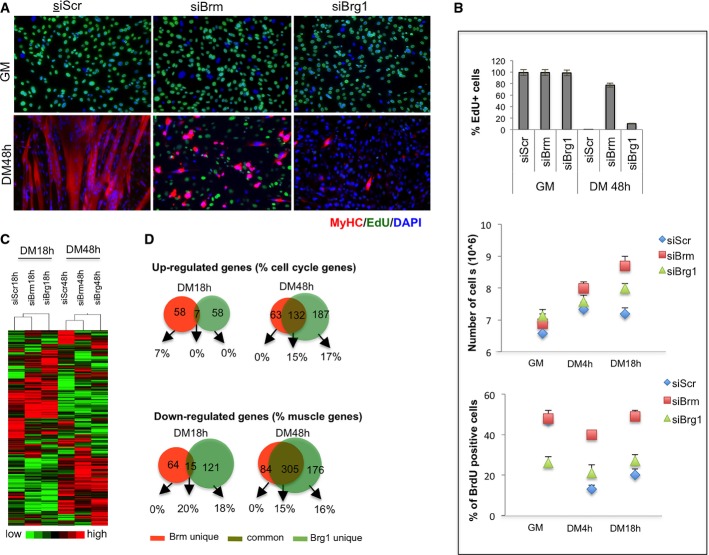
To gain further insight into the specific role of Brg1 and Brm at discrete stages of skeletal myogenesis, we individually downregulated their expression by small interfering RNA (siRNA)-mediated knockdown in undifferentiated myoblasts, followed by a phenotypic analysis of the derived populations of myoblasts. Knockdown of each protein resulted in a uniform and persistent depletion of Brg1 or Brm in C2C12 myoblasts, with at least 70% reduction in both transcripts and protein levels after 48 h of DM, as compared to scramble (siScr) controls (Fig1C and D; see also Fig3C). Interestingly, two distinct phenotypes were observed in Brm- or Brg1-downregulated muscle cells, as compared to the control cells. Both phase contrast and immunofluorescence images (Fig1E) documented that while Brg1-depleted cultures showed a complete absence of myotubes, Brm-depleted cells displayed a severe impairment in the formation of myotubes, which appeared reduced in number and size, with a lower fusion index as compared to control (siScr) cells (Fig1E and F). During these experiments, we consistently observed a higher number of myoblasts in siBrm-treated myoblasts following induction of differentiation, as compared to siBrg1 and control samples, suggesting an increased proliferative activity possibly derived from an impaired cell cycle arrest that typically precedes the activation of the differentiation program upon mitogen withdrawal. Indeed, EdU incorporation experiments revealed that the large majority (∼80%) of siBrm myoblasts continued to proliferate after 48 h, as compared to control samples and siBrg1 myoblasts (Fig2A and B, top panel). The effect of Brm on cell proliferation was further monitored by manual cell counting at several time points after differentiation (Fig2B, middle panel) and by FACS-assisted count of EdU-positive cells (Fig2B, bottom panel). All these analyses demonstrated that siBrm C2C12 cells retained proliferative activity in DM, while siScr and siBrg1 C2C12 cells ceased dividing (Fig2B). Of note, a small fraction of siBrm myoblasts could differentiate, but failed to form multinucleated myotubes with the size that is typically observed in control cells (Fig2A). This evidence indicates the presence of two populations in siBrm myoblasts exposed to differentiation conditions: one large population that escaped the differentiation-induced G0/G1 cell cycle arrest and continued to proliferate instead of differentiating, and another, smaller population, which could exit the cell cycle, but failed to complete the differentiation process. While Brm was not detectable by immunofluorescence in the sporadic siBrm MyHC-positive cells (data not shown), it remains formally possible that the latter population derives from cells in which Brm was not efficiently depleted. Alternatively, these cells might have initiated the differentiation program prior to the downregulation of Brm or a redundant, Brm-independent, cell cycle arrest can be activated in a small fraction of cultured myoblasts. By contrast, siBrg1 myoblasts uniformly failed to differentiate, despite their ability to withdraw from cell cycle arrest in response to differentiation conditions, as no EdU-positive cells were detected when cells were incubated in DM (Fig2A and B). Collectively, these data indicate that Brg1 and Brm perform essential functions during skeletal myogenesis, likely through separable mechanisms.
Figure 3.
Brm controls muscle differentiation-associated cell cycle arrest by repressing cyclin D1 expression
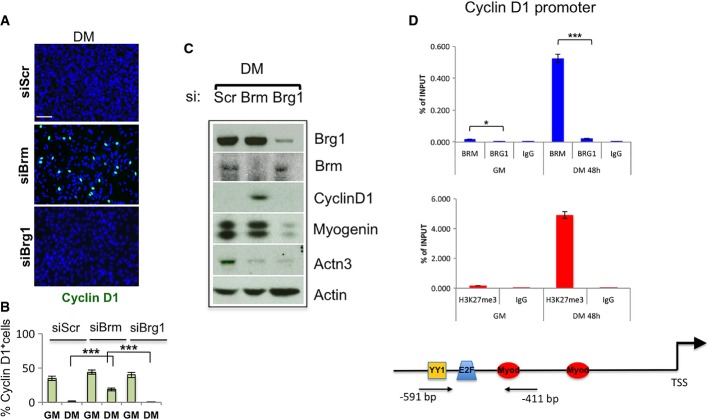
- A, B Immunofluorescence analysis of cyclin D1 expression in C2C12 cells depleted for Brm (siBrm) or Brg1 (siBrg1) in DM 48 h (A) and relative quantification reporting the percentage (%) of cyclin D1-positive cells (B). Scale bar, 50 μm. Data are presented as average ± SEM (n > 3). P-value was calculated using unpaired Student’s t-test, ***P < 0.001. Experiments were performed at least three times.
- C Western blot analysis performed in siBrm, siBrg1, and siScr C2C12 cells cultured in GM or DM, using antibodies against Brm, Brg1, cyclin D1, myogenin, and Actn3. α-actin was used as a loading control. Experiments were performed at least three times.
- D Recruitment of Brg1 and Brm and analysis of H3K27me3 on a promoter sequence of the Ccnd1 gene in GM and DM. Arrows indicate the regions amplified by the primers used. Protein recruitment is expressed as relative enrichment of each factor compared to IgG after normalization for total input control (n = 3, error bars represent SEM). P-value was calculated using unpaired Student’s t-test, *P < 0.05; ***P < 0.001.
Figure 2.
Downregulation of Brm or Brg1 leads to specific alterations of cell cycle and differentiation of C2C12 myoblasts
- A, B C2C12 were depleted for Brm (siBrm), Brg1 (siBrg1), or a scrambled (siScr) sequence by small interfering RNA (siRNA) during proliferation (GM), and samples were analyzed at different time points during differentiation (DM 18 h and DM 48 h). Double EdU/MyHC staining was performed after incubation of EdU 12 h before fixing the cells (A). Scale bar, 50 μm. Percentage of EdU-positive cells was calculated counting 10 fields of EdU-positive cells (B, top graph). Proliferation analysis was performed by counting the number/field of siRNA-treated C2C12 at the time point indicated (B, middle graph) and by flow cytometry by BrdU incorporation (B, bottom graph) as percentage of BrdU+ cells. Data are presented as average ± SEM (n = 3).
- C Heat map showing the expression profiles of transcripts in siRNA-treated C2C12 collected at 18 h and 48 h of differentiation.
- D Venn diagram showing overlap between genes downregulated in C2C12 depleted for Brm and Brg1 at early (18 h) and late (48 h) differentiation time points. The percentage of skeletal muscle genes annotated in each category is indicated.
Brg1 and Brm regulate distinct and overlapping clusters of genes during C2C12 myoblast differentiation
To further elucidate the individual roles of Brm and Brg1 during skeletal myogenesis, we performed a gene expression microarray in siBrg1 and siBrm myoblasts (with siScr as control) at two sequential stages of differentiation—18 and 48 h after incubation in DM—that were selected to reveal the relative impact of Brg1 or Brm on gene expression at early and late stages of muscle differentiation, respectively. The complete list of modulated genes is available and can be accessed through GEO Series accession number GSE44993. (http://www.ncbi.nlm.nih.gov/geo/query/acc.cgi?acc=GSE44993). A list of the up- and downregulated genes is also shown in Table EV1.
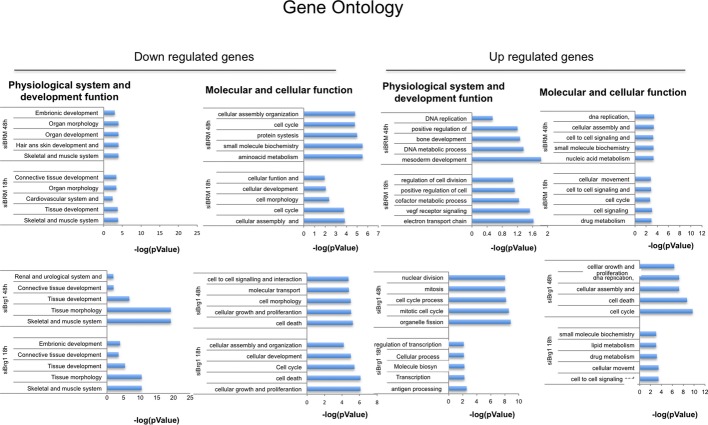
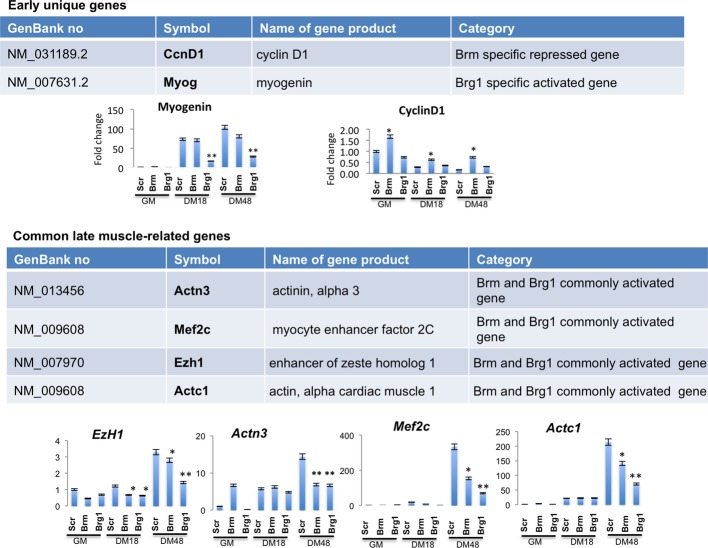
Interestingly, the gene expression profiles of C2C12 cells depleted of Brm or Brg1 showed distinct and overlapping clusters of up- and downregulated genes (Fig2C and D). The largest fraction of downregulated genes was observed in siBrg1 C2C12 cells (Fig2D) and was enriched in genes implicated in skeletal muscle differentiation, and other general aspect of cellular differentiation, such as tissue morphology and development, cell signaling, cell cycle, and cell death (Fig EV1). This is consistent with an essential role of Brg1 in the activation of early genes that promote skeletal muscle differentiation such as myogenin, as predicted by the phenotype of siBrg1 myoblasts (Figs1 and 3C) and previous studies 8-25. Conversely, downregulated genes in siBrm1 myoblasts showed only a modest enrichment in a subset of skeletal muscle late genes, which were also found downregulated in siBrg1 myoblasts (overlapping cluster of genes), indicating a possible cooperation of Brg1 and Brm in the activation of a cluster of common downstream muscle differentiation genes (Figs2D, EV1 and EV2). Among the upregulated genes, we noted enrichment in genes belonging to the cell cycle and proliferation networks in both siBrg1 and siBrm myoblasts (FigEV1). These genes are likely to be repressed, either directly or indirectly, through a Brg1- and/or Brm-mediated mechanism. Interestingly, at early differentiation stages (DM 18 h), the timing when myoblasts exit the cell cycle prior to differentiating, we observed upregulation of cell cycle-related genes (Figf, Vegfc, Ccng, Ccnd1) only in siBrm myoblasts (Figs2D and EV1). Among these genes, we annotated one key activator of cell cycle progression—the cyclin D1 gene Ccnd1—that was specifically upregulated in siBrm myoblasts. At 48 h of DM, cyclin D1 continued to be upregulated in siBrm C2C12 cells, although it was also annotated among the upregulated genes in siBrg1 C2C12 cells (http://www.ncbi.nlm.nih.gov/geo/query/acc.cgi?acc=GSE44993). By using qRT–PCR, we confirmed the presence of elevated levels of cyclin D1 transcripts in siBrm C2C12 cells, during proliferation (GM) and differentiation conditions (FigEV2). The elevated mRNA level of cyclin D1 was also confirmed in Brm−/− MEFs compared to WT MEFs during a myogenic conversion assay at several time points of differentiation (FigEV4E). By contrast, qRT–PCR analysis confirmed that the early muscle differentiation gene myogenin was downregulated only in siBrg1 C2C12 cells, while the expression of four commonly downregulated genes (EzH1, Actn3, MEF2c, and Actc1) was reduced in both siBrg1 and siBrm cells (FigEV2).
Gene ontology
Gene ontology analysis of C2C12 that were interfered for Brm (siBrm), Brg1 (siBrg1), or a scrambled sequence (siScr) by small interfering RNA (siRNA) analyzed during proliferation (GM) and at different time points during differentiation (DM 18 h and DM 48 h).
Gene expression analysis of differentially expressed genes for microarray validation
List of selected genes differentially expressed in differentiating siBrm and siBrg1 C2C12 cells as compared to siScr C2C12 cells and relative expression profile monitored by qPCR. Data are presented as average ± SEM of three independent experiments, and P-value was calculated using the unpaired Student’s t-test (*P < 0.05; **P < 0.01).
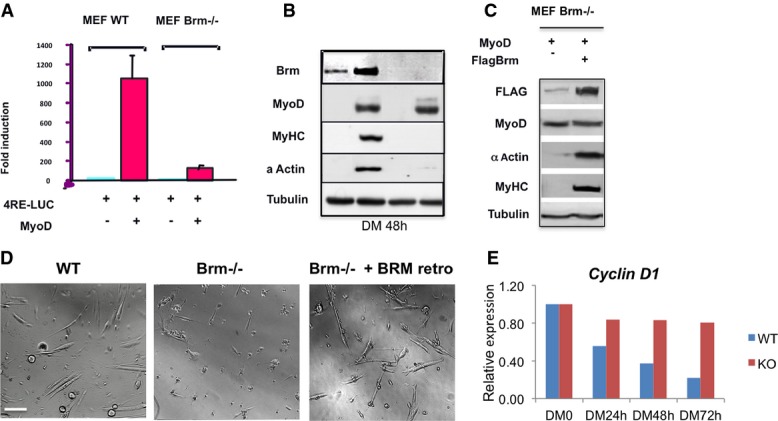
Ectopic expression of BRM rescues the myogenic differentiation defects in Brm−/− cells
- Luciferase assay in WT or Brm−/− mouse embryonic fibroblasts (MEFs) that were transfected with 4RELuc reporter and infected with MyoD. MEFs were transfected with the indicated constructs in GM. 24 h after transfection, the cells were shifted in differentiation medium, and harvested 48 h later for luciferase assay. Luciferase values are expressed as fold induction relative to the activity measured in the absence of MyoD. Data are shown as average ± SEM (n = 3).
- Western blot revealing the expression levels of the indicated proteins in WT or Brm−/− MEFs under the conditions used for luciferase assay in (A).
- Western blot of the indicated proteins after reintroduction of FLAG-tagged Brm in Brm−/− MEFs. After 2 days in growing medium, cells were transferred to differentiation medium and harvested 48 h later.
- Brightfield images of satellite cells isolated from muscles of WT and Brm−/− mice, after reintroduction of Brm by retroviral expression vector. Scale bar, 50 μm.
- Relative expression analysis in WT and Brm−/− MEFs infected with MyoD and induced to differentiate by switch with DM medium. Samples were collected at the time points indicated from the onset of differentiation induction (DM0). The expression levels are shown as relative to DM0, and the graph is representative of three independent experiments.
Brm controls muscle differentiation-associated cell cycle arrest by repressing Ccnd1 expression
Previous works established a critical, unique role of cyclin D1 in the regulation of myoblasts proliferation and inhibition of differentiation 31-33,34,35, indicating that Ccnd1 repression is important for cell cycle exit and activation of the myogenic program at early stages of myoblast differentiation. Given the proliferative phenotype observed only in siBrm myoblasts, we decided to focus on Ccnd1, as a potential Brm-repressed gene that mediates the proliferative phenotype of siBrm myoblasts.
We evaluated the expression of cyclin D1 in siBrm and siBrg1 C2C12, as compared to siScr C2C12 cells. Immunofluorescence and Western blot analysis showed a large proportion of siBrm myoblasts continue to express cyclin D1, as a reflection of their failure to withdraw from the cell cycle (Fig3A–C). By contrast, cyclin D1 was downregulated in siBrg1 cells placed in DM (Fig3A–C).
We further investigated the specific role of Brm vs. Brg1 in the repression of Ccnd1 transcription by using chromatin immunoprecipitation (ChIP) experiments. This analysis demonstrated that Brm, and not Brg1, bound the regulatory elements of Ccnd1 with an increased chromatin binding along with myoblast differentiation observed at −591 bp from the transcription start sites that coincided with an accumulation of the repressive histone mark H3K27 tri-methylation (H3K27me3) (Fig3D), which has been previously detected by ChIP-seq studies 36. This evidence indicates that Brm directly mediates Ccnd1 repression at the early onset of muscle differentiation.
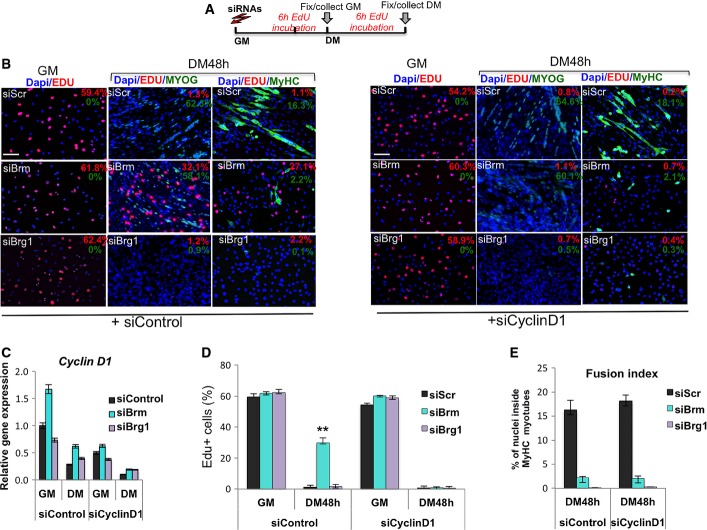
To establish a causal relationship between Ccnd1 expression, failure to arrest the cell cycle and defective formation of terminally differentiated myotubes in siBrm myoblasts, we downregulated Ccnd1 by siRNA and evaluated the effect on cell cycle arrest (as assessed by EdU incorporation) and on the expression of markers of terminal differentiation (indicated by expression of myogenin and MyHC) in siBrm, siBrg1, and siScr myoblasts (Fig4A). siRNA efficiently reduced cyclin D1 transcripts (Fig4C), leading to uniform depletion of cyclin D1 protein in C2C12 at all experimental points (Fig EV3), and effectively restored the ability of siBrm myoblasts to arrest the cell cycle in response to differentiation signals (DM) (Fig4B, compare right and left panels, and Fig4D). Interestingly, the recovery of cell cycle arrest in siBrm myoblasts was not sufficient to resume the expression of late muscle differentiation proteins, such as MyHC (Fig4B (right panel), D and E). No effect was observed on the cell cycle profile and expression of differentiation markers in siBrg1 and siScr myoblasts that were depleted of Ccnd1 (Fig4B–E). These data support the essential role of Ccnd1 repression in Brm-mediated arrest of cell cycle during muscle differentiation. However, the failure to complete the differentiation program of Ccnd1-depleted siBrm myoblasts indicates that cell cycle arrest and terminal differentiation are dissociated in siBrm myoblasts and suggests an additional role of Brm in the activation of muscle gene expression that is independent of its ability to arrest the cell cycle.
Figure 4.
Stage-specific requirement of Brg1 or Brm for the activation of the differentiation program in C2C12 myoblasts
- Schematic representation of the experimental setting, with siRNA delivered to C2C12 cells in GM and EdU pulses in GM or DM 6 h before collecting cells. Cyclin D1 (or control Scr) was downregulated by siRNA in C2C12 cells, which were subsequently interfered for Brm, Brg1, or scrambled sequences (siScr) by small interfering RNA (siRNA). Cells were then cultured in DM for 48 h.
- Immunofluorescence analysis of EdU incorporation, myogenin and MyHC in C2C12 collected from experimental conditions indicated in (A). Percentages of positive nuclei or cells are indicated in the top right corner of each panel. Nuclei are counterstained with DAPI. The effect of siBrg1, siBrm, or siScr on EdU incorporation, myogenin and MyHC expression was evaluated in siScr (left panels) or siCyclinD1 (right panels) C2C12 cells. Scale bar, 50 μm.
- Relative expression levels of Ccnd1 transcripts were monitored by qRT–PCR in siScr, siBrg1, and siBrm C2C12 cells in GM and DM (48 h). Data are presented as average ± SEM (n = 3).
- Quantification of EdU incorporation in nuclei, as percentage of EdU-positive nuclei/total nuclei in randomly selected fields, in siScr, siBrg1, and siBrm C2C12 cells in GM and DM (48 h), in the presence or absence of siCyclinD1. Data are presented as average ± SEM (n > 3). ***P < 0.01 (unpaired Student’s t-test).
- Fusion index was calculated by immunofluorescence staining, as percentage of nuclei within MyHC-expressing myotubes, performed in siScr, siBrg1, and siBrm C2C12 cells cultured in DM (48 h), in the presence or absence of siCyclinD1. Error bars represent average ± SEM (n = 3).
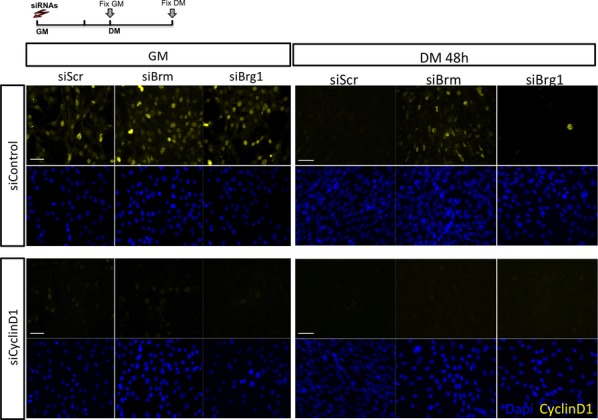
Efficient Cyclin D1 downregulation upon siRNA transfection
Immunofluorescence analysis of cyclin D1 expression in C2C12 cells depleted for Brm (siBrm) or Brg1 (siBrg1) in GM or DM 48 h upon delivery of siRNA against cyclin D1 or control sequence. Note that cyclin D1 is effectively depleted (bottom panel) and is specifically upregulated in DM condition only in Brm-depleted cells (upper panel). Scale bar, 50 μm.
Brm but not Brg1 is required for the completion of muscle differentiation
The lack of multinucleated myotubes in siBrm cells upon downregulation of Ccnd1 indicates that Brm might regulate essential and independent sequential steps of skeletal myogenesis. Thus, we hypothesized that after inducing G0/G1 arrest by Ccnd1 repression, Brm could also play an essential role in the activation of late muscle genes, as also suggested by the microarray analysis of siBrm C2C12 myoblasts (Fig2).
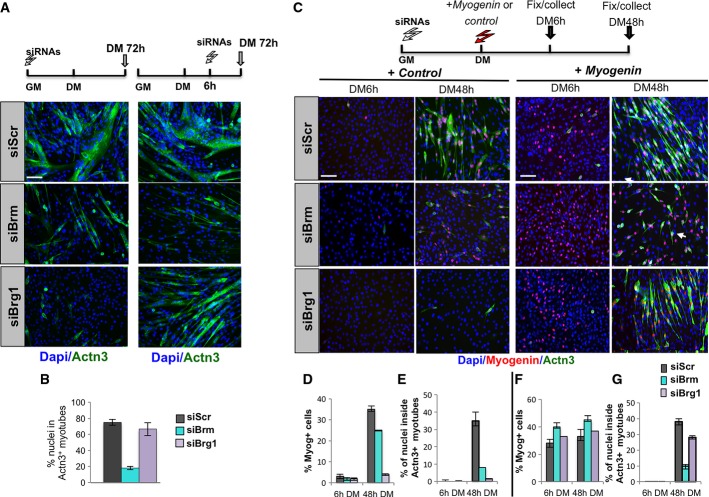
We addressed this issue by first investigating the effect of Brm or Brg1 knockdown at different stages of myogenesis, either during myoblast proliferation or soon after induction of differentiation. Toward this end, we delivered siRNAs to myoblasts either in GM or after 6 h from DM incubation (see scheme in Fig5A) in order to achieve maximal protein depletion within the first 12–18 h—a timing in which the large majority of the cells have already exited the cell cycle and do not incorporate EdU. Interestingly, while Brm knockdown inhibited the formation of multinucleated myotubes, regardless of the timing of downregulation, siRNA-mediated depletion of Brg1 delivered to myoblasts after 6 h in DM did not impair the formation of terminally differentiated myotubes (Fig5A and B), at variance with the inhibition of differentiation when Brg1 was downregulated in GM. This evidence suggests that Brg1 and Brm exert different functions in differentiating muscle cells, with Brg1 being required for the activation of early muscle genes, yet dispensable for the completion of later events during the formation of multinucleated myotubes. By contrast, Brm appears to be essential for late-stage events of skeletal myogenesis.
Figure 5.
Brm is required for both cell cycle arrest before differentiation and activation of late muscle gene expression in C2C12 cells
- A Immunofluorescence performed in differentiated C2C12 treated with siRNAs at different times as indicated on top of each panel. Terminal differentiation was monitored by using Actn3 (green), and nuclei were visualized by DAPI. Scale bar, 50 μm.
- B Quantification of fusion index calculated as percentage of nuclei within Actn3-expressing myotubes.
- C Representative immunofluorescence images of siRNA-treated C2C12 cells stained for myogenin and Actn3 at 6 h and 48 h from DM incubation, following overexpression of Myog or control cDNA, as described in the top scheme. Scale bar, 50 μm.
- D–G Quantification of myogenin nuclear staining, as percentage of myogenin-positive nuclei/total nuclei in randomly selected fields, in siBrm, siBrg1, or siScr C2C12 cells overexpressing a control cDNA (D) or myogenin vector (F). Fusion index was calculated by immunofluorescence staining, as percentage of nuclei within Actn3-expressing myotubes, in siBrm, siBrg1, or siScr C2C12 cDNA cells overexpressing a control cDNA (E) or myogenin vector (G).
Data information: Data are presented as average ± SEM (n > 3).
Previous studies showed that Brg1 is required for the activation of myogenin expression during skeletal myogenesis 6-25. Genetic and molecular studies have established that myogenin expression at early stages of skeletal myogenesis establishes a key restriction point for the activation of the differentiation program in skeletal myoblasts 37-39. Once expressed, myogenin promotes late muscle gene expression in collaboration with Mef2D 40, pRb 41-43, and other transcription factors 44,45. We therefore tested whether ectopic expression of myogenin could override the requirement for Brg1 or Brm during muscle differentiation. To this purpose, we transfected a myogenin expression vector to cells that had been previously depleted of Brm or Brg1 by siRNA in GM and compared to a control vector (see scheme in Fig5C). Indeed, myogenin overexpression rescued the formation of myotubes from siBrg1 myoblasts, but failed to do so in siBrm myoblasts (Fig5C (right panel), F and G), which exhibited a phenotype similar to control (empty vector transfected) myoblasts (compare left and right panels of Fig5C and D–G). Overall, these findings support the conclusion that Brg1 is required for direct activation of early muscle gene transcription at the myogenin step, while late completion of myogenesis appears to require Brm. These data also suggest that the downregulation of late muscle genes in siBrg1 C2C12 cells could be the result of an indirect effect on myogenin downstream target genes.
We also investigated the role of Brm on late muscle gene activation in independent experiments, by using Brm-deficient murine embryonic fibroblasts (MEFs) and satellite cells. Brm null MEFs were compared to their wild-type counterpart for activation of the myogenic program upon ectopic expression of MyoD (FigEV4). Activation of a MyoD-responsive luciferase reporter (4RE-luc, in which luciferase is driven by multiple MyoD-bound Eboxes) was largely compromised in Brm null MEFs, as compared to WT MEFs (FigEV4A). Moreover, MyoD promoted myogenic conversion of WT MEFs, but failed to convert Brm null MEFs (FigEV4B), and re-introduction of Brm restored MyoD ability to activate endogenous muscle genes in Brm null MEFs (FigEV4C). Likewise, primary satellite cells isolated from Brm null mice failed to form differentiated myotubes, as compared to satellite cells from WT mice (FigEV4D; see also FigEV5), but re-introduction of Brm restored their differentiation ability (FigEV4D).
Proliferation and differentiation defect in Brm−/− satellite cells
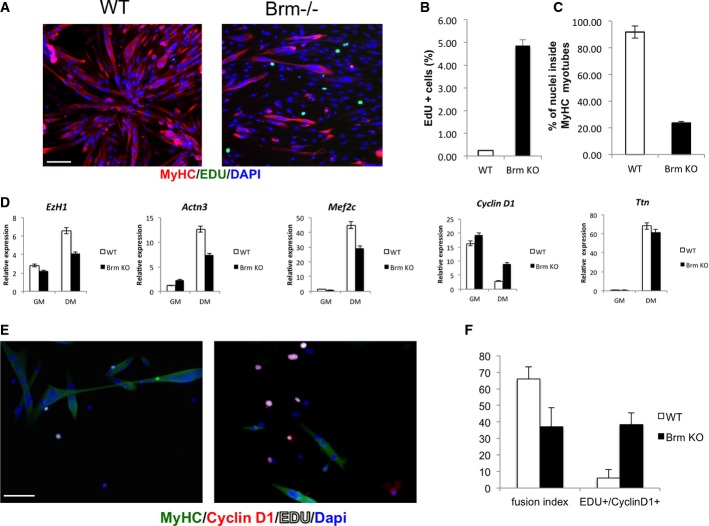
Satellite cells were isolated from muscles of WT and Brm−/− mice, cultured in GM, and then exposed to DM. Cells were incubated with EdU for 6 h in DM prior to collection for staining.
- A Immunofluorescence staining of MyHC and EdU. Scale bar, 50 μm.
- B Percentage of EdU-positive cells was calculated counting 10 fields of EdU-positive cells.
- C Quantification of fusion index calculated as percentage of nuclei within MyHC-expressing myotubes.
- D Analysis of expression levels of transcripts of genes selected from microarray analysis.
- E, F Immunofluorescence staining of WT (left)- and Brm−/− (right)-derived satellite cells for MyHC, EDU, and cyclin D1 (E); relative quantification of fusion index; and number of EDU+/cyclin D1+ cells (F). Scale bar, 50 μm. Data are shown as average ± SEM (n = 3).
Brm null mice exhibit delayed muscle regeneration and Brm null satellite cells display intrinsic deregulation of cell cycle and impaired differentiation
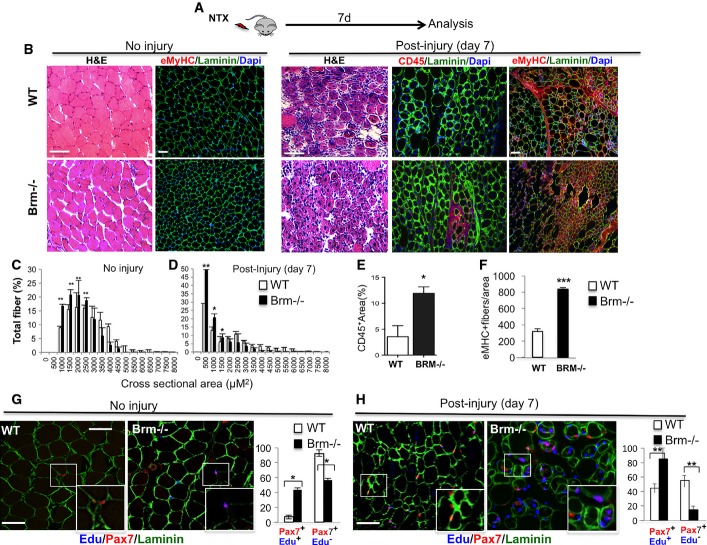
We next assessed the impact of Brm on skeletal myogenesis in vivo, by using Brm null mice 26,28. To evaluate the regeneration potential of Brm null muscles, we injured the tibialis anterior (TA) muscles of 2.5-month-old wild-type (WT) and Brm null mice, and compared their repair ability (Fig6A), by using multiple approaches. Although these mice develop normally and survive as long as their wild-type counterparts, they display increased total weight and reduced size of unperturbed muscles, as shown by the smaller cross-sectional area (CSA) of myofibers, when compared to their wild-type counterpart (Fig6B–D). This phenotype suggests that Brm deficiency can compromise postnatal myogenesis and prompted an interest in evaluating the regeneration potential of Brm null muscles.
Figure 6.
Impaired muscle regeneration in Brm−/− mice
- A Schematic representation of the experimental setting, showing the time of notexin-mediated muscle injury and tissue analysis (n = 4).
- B Regeneration of tibialis anterior (TA) muscles from wild-type (WT) and Brm null (Brm−/−) 2.5-month-old mice was evaluated by morphological criteria (hematoxylin and eosin (H&E) staining), the presence of regenerating myofibers (laminin/embryonic MyHC) and the presence of inflammatory infiltration (laminin/CD45) 7 days after notexin injury. Scale bar, 50 μm.
- C, D Analysis of cross-sectional area (CSA) of muscles represented as mean of CSA in WT and Brm−/− mice uninjured or post-injury.
- E Quantification of % of area occupied by CD45-positive cells in randomly selected fields.
- F Quantification of MyHC-positive fibers in randomly selected fields.
- G, H In addition to notexin injury, as indicated in (A), WT and Brm−/− mice (2.5 months old) received intraperitoneal injection of EdU. Immunohistochemistry for Pax7, laminin and EdU were performed in sections from TA muscles to detect proliferating satellite cells (Pax7/EdU double-positive cells within laminin-positive fibers), and its relative quantification. Scale bar, 50 μm.
Data information: Data are presented as average ± SEM (n > 3). P-value was calculated using unpaired Student’s t-test *P < 0.05; **P < 0.01; ***P < 0.001.
Morphological analysis of myofibers at 7 days post-injury showed a comparable number of centronucleated fibers in WT and Brm null mice (Fig6B), indicating that the extent of the injury was the same; however, a clear reduction in fiber CSA was observed in tibialis anterior muscle, as well as in gastrocnemius muscle (data not shown) of Brm null mice, as compared to WT muscles (Fig6B–D), indicating an impaired regeneration ability of Brm null muscles. Muscle repair is typically preceded by myofiber degeneration and inflammatory infiltration, followed by satellite cell-mediated formation of regenerating fibers that can be distinguished from pre-existing myofibers by virtue of their staining for embryonic MyHC (eMyHC). eMyHC expression typically disappears upon fiber maturation, between days 6 and 8 post-injury. Indeed, at 7 days post-injury, WT muscles showed morphological evidence of muscle repair, visible by H&E staining (Fig6B and D), which coincided with absence of inflammatory infiltrate, as quantified by CD45-positive cells (Fig6B and E) and low number of eMyHC-positive fibers (Fig6B and F). Conversely, Brm null muscles showed morphological evidence of ongoing regeneration, such as persistent infiltration of CD45-positive cells (Fig6B and E) and an abundant number of eMyHC-positive fibers (Fig6B and F).
These data reveal an impaired repair ability of Brm null muscles that could be accounted for by the defective myogenic potential due to the absence of Brm in muscle satellite cells—the cellular effector of muscle regeneration 46 reviewed by Brack & Rando and Yin and colleagues 47,48. However, the widespread gene deficiency of Brm null mice raises the possibility that the muscle phenotype detected could be due to a systemic and/or satellite cell extrinsic effect. To evaluate whether this phenotype was due to a cell intrinsic defect of Brm null satellite cells, we isolated by FACS satellite cells from notexin-injured TA muscles of wild-type and Brm null mice and compared their intrinsic differentiation potential in culture, upon incubation in differentiation conditions (DM). While WT satellite cells ceased proliferating (0.24% EdU cells) and formed multinucleated myotubes with high efficiency (91.87% of MyHC-positive myotubes), Brm-deficient satellite cells showed compromised differentiation ability, with sporadic and smaller MyHC myotubes (23.78% of MyHC-positive myotubes) and altered proliferation (4.86% of Edu-positive cells) (FigEV5A–C). As this phenotype replicates that observed in siBrm C2C12 myoblasts (Figs1 and 2), we used satellite cells to validate by qRT–PCR the changes in transcriptional output caused by Brm deficiency. We monitored, in satellite cells from WT and Brm-deficient satellite cells, the expression of genes that were found up- or downregulated in siBrm C2C12 (Fig EV2). Cyclin D1, which was found upregulated in siBrm C2C12 cultured in DM (Fig2), as compared to their normal counterpart, was also upregulated in Brm-deficient satellite cells induced to differentiate, as compared to WT satellite cells (Fig EV5D). Likewise, genes, such as Actn3, Ezh1, and Mef2C, that were annotated as downregulated in the microarray from siBrm C2C12 were also downregulated in Brm-deficient satellite cells (FigsEV2 and EV5D). As a control, the expression levels of Ttn, which were not altered in siBrm C2C12, did not differ in Brm-deficient satellite cells, as compared to the WT counterpart (FigEV5D).
We also cultured satellite cells at low confluence to minimize the effects of cell density that can alter the differentiation ability of primary satellite cells. Under these conditions, while the majority of WT satellite cells fused into cyclin D1-negative, MyHC-positive myotubes, a large proportion of Brm null satellite cells failed to downregulate cyclin D1 and could not form MyHC-multinucleated myotubes (FigEV5E and F). These results demonstrate that Brm deficiency alters the same pattern of gene expression and biological properties in both muscle cell lines and primary muscle satellite cells. Overall, data from cultured Brm-deficient satellite cells (FigEV5) and C2C12 cells (Figs1, 2 and EV5) strongly indicate that the muscle phenotype observed in Brm-deficient mice is due to intrinsic defects in cell cycle regulation and activation of late muscle gene expression.
Finally, we evaluated whether the intrinsic defective myogenic potential of Brm null satellite cells could be detected in vivo. We therefore performed Pax7 and EdU staining to determine whether Brm null satellite cells that failed to differentiate in regenerating muscles were proliferating. Interestingly, we detected sporadic Pax7/EdU double-positive satellite cells in unperturbed muscle from Brm null, while no EdU-positive cells could be detected in WT unperturbed muscles (Fig6G). At 7 days following injury by notexin injection, about 40% of WT Pax7-positive cells incorporated EdU, with the remaining 60% being a Pax7-positive/EdU-negative population that returned to quiescence (Fig6H). Given that WT muscles have undergone efficient repair (Fig6B–F), we presumed that the large majority of activated satellite cells completed the differentiation program and generated new fibers. However, over 80% of Brm null Pax7-positive cells continued to incorporate EdU at 7 days post-injury (Fig6H). Given the regeneration delay detected in Brm null muscles (Fig6B–F), it is likely that the high number of Brm null Pax7/EdU double-positive cells reflect their intrinsic inability to exit the cell cycle and efficiently complete the differentiation progress of muscle progenitors or re-enter quiescence.
Discussion
Brg1 and Brm, the two ATPase subunits of the SWI/SNF complex, have been often considered functionally redundant; however, the mutually exclusive incorporation of either subunit in the SWI/SNF complex indicates that they exert specific functions. This apparent paradox can be resolved by the co-existence in the same cell of distinct SWI/SNF complexes with heterogenous composition and in which alternative incorporation of Brg1 or Brm confers functional specialization.
In this study, we have used a combination of genetic inactivation of either Brg1 or Brm, coupled with genome wide transcriptional analysis, to elucidate the specific function of each protein in the transcriptional output and biological outcome of muscle progenitors during in vitro skeletal myogenesis and muscle regeneration in vivo. This analysis provided new insights into the differential roles of Brg1 and Brm during the process of skeletal muscle differentiation and assigned to these proteins stage-specific functions to coordinate gene expression that has not been appreciated by previous studies.
Our data demonstrate that Brg1 is required for the activation of muscle gene expression at the early onset of myoblast differentiation, but appears dispensable for later stages. While the essential role of Brg1 in the activation of early muscle gene expression has been shown by previous studies 6-25, the integrity of the differentiation ability observed in myoblasts in which Brg1 has been depleted after myogenin expression (Fig4) was somehow surprising, as it restricts the function of Brg1 to a discrete boundary of the differentiation process, and indicates a previously unrecognized role of Brm in the activation of late muscle genes.
Remarkably, our studies indicated that Brm, but not Brg1, is required for the completion of late skeletal myogenesis. Indeed, myotube formation was largely impaired by Brm depletion in myoblasts that had already initiated the differentiation process, by either incubation in DM (Fig5A–C) or forced expression of myogenin (Fig5C–G). By contrast, depletion of Brg1 at the same timing did not affect the differentiation process. This unexpected finding reveals a specific requirement of Brm in the activation of late stages of skeletal myogenesis that was confirmed in vivo by experiments showing impaired and delayed muscle regeneration in Brm null mice (Fig6) and further supported ex vivo by the intrinsic deficiency of Brm null satellite cells to form myotubes and activate late muscle gene expression (Fig EV5). Of note, Brm−/− mice showed a milder regeneration deficit as compared to the drastic decrease in differentiation observed in C2C12 cells and it is likely that compensatory mechanisms in vivo account for the milder phenotype. Nonetheless, the in vivo data support the importance of Brm in regulating cell cycle and differentiation of satellite cells.
Our data also revealed an essential role for Brm in the cell cycle arrest that typically occurs in myoblasts at the onset of differentiation and identified cyclin D1 as one key target of Brm-dependent control of cell cycle in differentiating myoblasts. Interestingly, in this case, Brm contribution to myogenic differentiation relies on its ability to directly repress transcription of cyclin D1, a well-known activator of G1–S phase transition during myoblast proliferation that has also been recognized as a unique inhibitor of muscle differentiation 31-33,34,35. We found that Brm deficiency in C2C12 myoblasts or primary satellite cells invariably leads to deregulation of cell cycle arrest, with an increased number of cells that did not withdraw from the cell cycle and failed to differentiate into multinucleated myotubes. This phenotype coincided with the upregulation of Ccnd1, which was independently annotated as an upregulated gene by microarray analysis in Brm-depleted C2C12 myoblasts (Figs2, EV1 and EV2). Importantly, Brm, but not Brg1, was found bound to Ccnd1 promoter by ChIP analysis, with an increased binding during the differentiation process that correlated with a proportional enrichment in H3K27 tri-methylation (H3K27me3) (Fig3)—a marker of the repressive activity of the Polycomb Repressive Complex 2 (PRC2) for gene silencing in muscle cells 49,50. The coincidental increase in H3K27me3 (Fig3) suggests that the recruitment of Polycomb group complex (PcG) might contribute to establish marks of repressive chromatin, in cooperation with Brm-based SWI/SNF, as proposed by Ho & Crabtree 51. Interestingly, the sequence of Ccnd1 promoter that is bound by Brm and is enriched in H3K27me3 contains both putative YY1 and E2F4/6 binding sites, which can mediate Brm recruitment, via PcG 52 or pRb 49,53, respectively.
Collectively, this study shed new light on the distinct roles exerted by Brg1 and Brm ATPases during skeletal myogenesis. We show for the first time that Brm plays an essential role at distinct stages of skeletal muscle differentiation, during myoblast proliferation by regulating cell cycle arrest, and during terminal differentiation by regulating late muscle gene expression. Consistently, we show that Brm is required for proper muscle regeneration, as its absence affects the balance between proliferation, differentiation, and quiescence of muscle stem cells. As such, this study provides new insight into the epigenetic control of gene expression during skeletal myogenesis. As a recent study has shown the essential role of BAF47/INI1—a constitutive, non-enzymatic SWI/SNF subunit—in the cell cycle arrest of differentiating C2C12 myoblasts 54, future studies should determine whether differences in SWI/SNF composition can also contribute to mediate the distinct activities of Brg1 and Brm during skeletal myogenesis.
Materials and Methods
Cell culture and myogenic differentiation
C2C12 myoblasts (ATCC CRL-1772) were cultured in Dulbecco’s modified Eagle medium (DMEM) supplemented with 20% FBS (fetal bovine serum) (Hyclone) (Growth Medium [GM]). Terminal differentiation was induced shifting 80%-confluent myoblasts in DMEM supplemented with 2% horse serum plus ITS (Sigma) (Differentiation Medium [DM]).
Brm−/− primary mouse embryo fibroblasts (MEFs) and their wild-type counterparts were obtained from Drs. M. Yaniv and Christian Muchardt (Institut Pasteur, Paris). Cells were grown in DMEM supplemented with 3% FCS (fetal calf serum, Hyclone) + 7% FBS. In order to induce myogenic differentiation, proliferating cells were infected with a MyoD-encoding retrovirus (pBABEpuro-MyoD) or transfected with an expression vector for MyoD (pCDNA3-MyoD) and after 24–48 h in proliferation medium, differentiation was induced by replacing cells in differentiation medium for 48 h.
Plasmid constructs
pCDNA3-myogenin expression vector was obtained by sub-cloning the rat myogenin cDNA into EcoRI site of the pCDNA3 vector.
The retroviruses pBabePuroMyod and pBabePuro were used to infect proliferating fibroblasts before induction of muscle differentiation. pBS (-)Brm-FLAG was obtained by cloning of Brm-FLAG (pBABE-hBrm-FLAG, Kingston laboratory).
Isolation of satellite cells by FACS from Brm null and WT mice
The isolation of satellite cells was performed as described 55. Briefly, hind limb muscles were minced and digested in HBSS with CaCl2 and MgCl2 (Gibco) containing 2 μg/ml Collagenase A (Roche), 2.4 U/ml Dispase I (Roche), 10 ng/ml DNase I (Roche) for 120 min at 37°C. Cells were blocked with 2.5% goat serum and stained with primary antibodies (10 ng/ml) CD31-eFluor450 (eBioscience, 48-0311-80), CD45-eFluor450 (eBioscience, 48-0451-80), TER-119-eFluor450 (eBioscience, 48-5921-80), CD34-eFluor647 (BD Biosciences, 347660), Sca-1-FITC (eBioscience, 11-5981-81) and α7integrin-APC (AbLab) for 30 min on ice. Cells were finally washed and resuspended in HBSS with CaCl2 and MgCl2 containing 0.2% (w/v) BSA and 1% (v/v) penicillin–streptomycin. Satellite cells were isolated by flow cytometry analysis and cell sorting, performed on FACSAria Cell Sorter. Satellite cells were isolated as Ter119−/CD45−/CD31−/CD34+/α7integrin+/Sca-1− cells.
Cell cycle analysis
For cell cycle analysis, 10 mM BrdU (Sigma) was added to the cells for 2 h. After BrdU incorporation, cells were harvested and fixed in ice-cold 70% ethanol. DNA was denatured with HCl 2 N/Triton 20% and labeled with an anti-BrdU antibody (BD Bioscience) for 1 h. Then, cells were resuspended in washing buffer and labeled with anti-mouse APC-conjugated antibody. Cells were then washed and resuspended in PBS containing 5 mg/ml propidium iodide and analyzed on a FACSAria flow cytometer using FlowJo software.
Transfections and infections
Transfection of pCDNA3-myogenin and pCDNA3-[control] plasmid was mixed in Optimem with Lipofectamine reagent (Invitrogen) and incubated with the cells for 5 h, according to the manufacturer’s instruction.
For siRNA transfection in C2C12 cells, Dharmafect3 reagent was mixed with 100 nM final concentration of siGenome Smart pool collections Brg1 #L-041135, Brm #L-056591-00, cyclin D1 #M-042441-01 and non-targeting pool #D-001810-10-20 (Dharmacon) and incubated with the cells in culture medium following manufacturer’s protocol (Thermo Scientific). After 36 h from the onset of transfection, growing medium (15% FBS) was replaced by differentiation medium (2% horse serum + ITS) and cells were harvested at GM, DM 18 h and DM 48 h for further analysis.
For retroviral infections, high-titered retroviral supernatants (about 107 virus/ml) were generated by transient transfection of the vectors in the helper-free packaging cell line Phoenix. Briefly, retroviral supernatant, undiluted or diluted in culture medium, were mixed with Polybrene (final concentration 8 μg/ml) and incubated with the cells at least for 5 h and cultured in Growth Medium for at least 36 h before the induction of differentiation, where required.
Microarray analysis
For affimetrix analysis, the total RNA from duplicates of siRNA-transfected cells was purified with TRIzol Reagent (Invitrogen) and labeled cRNA was prepared from 500 ng RNA using the Illumina® RNA Amplification Kit from Ambion (San Diego, USA). The labeled cRNA (1,500 ng) was hybridized overnight at 58°C to the Sentrix® MouseWG-6 Expression BeadChip (> 46,000 gene transcripts; Illumina, San Diego, CA, USA) according to the manufacturer’s instructions. BeadChips were subsequently washed and developed with fluorolink streptavidin Cy3 (GE Healthcare). BeadChips were scanned with an Illumina BeadArray Reader. These genes were analyzed for the presence of over-represented GO categories (Biological Process) and GeneGo processes importing normalized data into Ingenuity pathway software from GeneGo Inc. All RNA interference experiments were performed in duplicate and only those genes with a fold change of at least 1.3 present in duplicate experiments of RNAi for Brm or Brg1 were considered. These genes were analyzed for the presence of over-represented GO categories (Biological Process) and GeneGo processes using Ingenuity pathway software. The data discussed in this publication have been deposited in NCBI’s Gene Expression Omnibus and are accessible through GEO Series accession number GSE44993 (http://www.ncbi.nlm.nih.gov/geo/query/acc.cgi?acc=GSE44993).
qRT–PCR
Total RNA was extracted with TRIzol and retrotranscribed using the Taqman reverse transcription kit (Applied Biosystems). Real-time quantitative PCR was performed using Power SYBR Green Master mix (Applied Biosystems) following manufacturer’s indications. Relative expressions were calculated by the comparative Ct method for relative quantification using GAPDH (for SYBR Green) or B2 microglobulin (for TaqMan) as normalizing genes. Primers sequences are listed in Table EV2.
Antibodies, immunoprecipitation, and Western blotting analysis
For Western blotting analysis, whole cell extracts were prepared in a buffer containing 20 mM Hepes pH 7.9, 350 mM NaCl, 30 mM MgCl2, 1 mM EDTA pH 8, 0.1 mM EGTA, 20% glycerol, 0.5% NP-40 plus protease inhibitors 5 μg/ml. After lyses, protein concentrations were determined with Micro BCA Protein Assay Kit (ThermoScientific). Fifty microgram of protein were fractioned by SDS–PAGE, transferred to nitrocellulose membranes and incubated overnight with the following antibodies: MyoD (BD Bioscience, 554130), Flag (M2, Sigma), sarcomeric actin (5C5,ZZ Biotechnology), CDK4 (C-22, Santa Cruz Biotechnology), tubulin (H-300, Santa Cruz Biotechnology), cyclin D1 (Millipore, 04-221), H3K27me3 (Active Motif, 39155), Brm (Abcam, 12165), Brg1 (H88 Santa Cruz Biotechology, sc-10768), Actn3 (Origene, TA 303381), and monoclonal antibodies against myosin heavy chain (clone MF20) and against myogenin (clone IF5D7/2).
Chromatin immunoprecipitation assay
ChIP assay was performed as previously described 56. Primers used for ChIP-DNA amplification are listed in Table EV2. The antibodies used were as follows: anti-Brm (ab-15597, Abcam), anti-Brg1 (sc-10768, H88), or normal IgG as control. Primers are listed in Table EV2.
Animals and in vivo treatments
129/SvJ mice and 129/SvJ Brm null mice were obtained from Jackson Laboratories and Scott Bultman, respectively. All protocols were approved by the Sanford-Burnham Medical Research Institute Animal Care and Use Committee. Experimental mice used in our experiments were derived from breeding of Brm null homozygous mice. To assess muscle regeneration, muscle injury was performed by intramuscular injection of notexin (Sigma). Ten microgram of notexin were injected in the right tibialis anterior and in the right gastrocnemius. Left tibialis anterior and left gastrocnemius were not injured and they were used as a control (uninjured). Starting from the day of injury, 50 μg of EDU (50 μg/g) were injected intraperitoneally twice a day for 6 days. At day 6 post-injury, mice were euthanized and muscles were collected for histology studies.
Immunofluorescence and histology
For immunofluorescence experiments, C2C12 myoblasts and satellite cells were stained using standard protocol with the following antibodies: anti-Brm (ab-15597); anti-Brg1 (sc-17796, G7); anti-myosin heavy chain (MF20) 1:20; anti-Alpha-Actinin3 (EP2531Y, Origene); cyclin D1 (04-221-clone EP272Y, Millipore). After incubation with conjugated secondary antibody (Alexa, Invitrogen), cells were counterstained with 0.1 μg/ml 4′,6-diamidino-2-phenilindole (DAPI).
For histological analysis, tibialis anterior and gastrocnemius muscles were snap-frozen in liquid nitrogen-cooled isopentane, sectioned transversally at 10 μm, and stained for the following primary antibodies: Laminin (L9393 Sigma) and Pax7 (Hybridoma bank). Hematoxylin and eosin staining was additionally performed to access muscle integrity.
BrdU and EDU labeling
5-bromo-20-deoxy-uridine (BrdU) labeling and detection kit (Roche) was used according to the manufacturer’s instructions. BrdU labeling reagent was added to the cells with fresh media overnight. In some experiments, the Click-iT EdU assay from Invitrogen was used as an alternative to the BrdU assay, according to the manufacturer’s directions. Similar to BrdU, EdU (5-ethynyl-2′-deoxyuridine) is a nucleoside analog of thymidine and is incorporated into DNA during active DNA synthesis. EdU incubation was performed for 2–4 h. BrDU and EDU immunohistochemistry was used to assay BrDU/EDU incorporation.
Statistical analysis
Data are presented as mean ± SEM unless otherwise indicated. Differences between groups were analyzed for statistical significance using the unpaired Student’s t-test with significance defined as *P < 0.05, **P < 0.01, or ***P < 0.001, by performing at least three independent experiments.
All experiments requiring the use of animals, directly or as a source of cells, were subjected to randomization based on litter. Investigators were not blinded to group allocation or outcome assessment. Sample size was predetermined based on the variability observed in preliminary and similar experiments. No samples or animals were excluded from this study.
Acknowledgments
PLP is an Investigator of Sanford Children’s Health Research Center. This work has been supported by the following grants to PLP: R01AR056712, R01AR052779, and P30 AR061303 from the National Institute of Health/National Institute of Arthritis and Musculoskeletal and Skin Diseases (NIAMS), EPIGEN, Muscular Dystrophy Association (MDA) and Association française contre les myopathies (AFM). This work has benefited from research funding from the European Community’s Seventh Framework Programme in the project FP7-Health—2009 ENDOSTEM 241440 (Activation of vasculature associated stem cells and muscle stem cells for the repair and maintenance of muscle tissue). SB was supported by the National Institutes of Health (CA125237 to S.J.B.). MC was supported by Fondazione Telethon (grant GGP08126). SA (TG2-01162) and BM (TG2-01162) were supported by CIRM training fellowships. PC is supported by NIH diversity supplement to 5 R01 AR052779.
Author contributions
SA initiated the project and performed functional experiments in C2C12 cells and Brm null MEFs, microarray preparation and analysis, and ChIP. PCT performed experiments of siRNA knockdown, immunofluorescence, RT–qPCR, tissue histology, isolation, and characterization of satellite cells from WT and Brm null mice. ADA performed experiments of muscle regeneration and analysis of tissue histology WT and Brm null mice. CC contributed to experiments in Brm null MEFs. BM performed Western blots from C2C12 siRNA. AF and MC initially supervised the analysis of Brg1 and Brm expression in C2C12 cells and experiments in Brm null MEFs. SJB provided Brm null mice, and advice on these mice, and edited the manuscript. PLP designed and supervised the whole project and wrote the manuscript.
Conflict of interest
The authors declare that they have no conflict of interest.
Supporting Information
Expanded View Figures PDF
Table EV1
Table EV2
Review Process File
References
- Dilworth FJ, Blais A. Epigenetic regulation of satellite cell activation during muscle regeneration. Stem Cell Res Ther. 2011;2:18. doi: 10.1186/scrt59. [DOI] [PMC free article] [PubMed] [Google Scholar]
- Fong AP, Tapscott SJ. Skeletal muscle programming and re-programming. Curr Opin Genet Dev. 2013;23:568–573. doi: 10.1016/j.gde.2013.05.002. [DOI] [PMC free article] [PubMed] [Google Scholar]
- Puri PL, Sartorelli V. Regulation of muscle regulatory factors by DNA-binding, interacting proteins, and post-transcriptional modifications. J Cell Physiol. 2000;185:155–173. doi: 10.1002/1097-4652(200011)185:2<155::AID-JCP1>3.0.CO;2-Z. [DOI] [PubMed] [Google Scholar]
- de la Serna IL, Ohkawa Y, Imbalzano AN. Chromatin remodelling in mammalian differentiation: lessons from ATP-dependent remodellers. Nat Rev Genet. 2006;7:461–473. doi: 10.1038/nrg1882. [DOI] [PubMed] [Google Scholar]
- Guasconi V, Puri PL. Chromatin: the interface between extrinsic cues and the epigenetic regulation of muscle regeneration. Trends Cell Biol. 2009;19:286–294. doi: 10.1016/j.tcb.2009.03.002. [DOI] [PMC free article] [PubMed] [Google Scholar]
- de la Serna IL, Ohkawa Y, Berkes CA, Bergstrom DA, Dacwag CS, Tapscott SJ, Imbalzano AN. MyoD targets chromatin remodeling complexes to the myogenin locus prior to forming a stable DNA-bound complex. Mol Cell Biol. 2005;25:3997–4009. doi: 10.1128/MCB.25.10.3997-4009.2005. [DOI] [PMC free article] [PubMed] [Google Scholar]
- Gerber AN, Klesert TR, Bergstrom DA, Tapscott SJ. Two domains of MyoD mediate transcriptional activation of genes in repressive chromatin: a mechanism for lineage determination in myogenesis. Genes Dev. 1997;11:436–450. doi: 10.1101/gad.11.4.436. [DOI] [PubMed] [Google Scholar]
- Ohkawa Y, Yoshimura S, Higashi C, Marfella CG, Dacwag CS, Tachibana T, Imbalzano AN. Myogenin and the SWI/SNF ATPase Brg1 maintain myogenic gene expression at different stages of skeletal myogenesis. J Biol Chem. 2007;282:6564–6570. doi: 10.1074/jbc.M608898200. [DOI] [PubMed] [Google Scholar]
- Puri PL, Mercola M. BAF60 A, B, and Cs of muscle determination and renewal. Genes Dev. 2012;26:2673–2683. doi: 10.1101/gad.207415.112. [DOI] [PMC free article] [PubMed] [Google Scholar]
- Wu JI, Lessard J, Crabtree GR. Understanding the words of chromatin regulation. Cell. 2009;136:200–206. doi: 10.1016/j.cell.2009.01.009. [DOI] [PMC free article] [PubMed] [Google Scholar]
- Albini S, Puri PL. SWI/SNF complexes, chromatin remodeling and skeletal myogenesis: it’s time to exchange! Exp Cell Res. 2010;316:3073–3080. doi: 10.1016/j.yexcr.2010.05.023. [DOI] [PMC free article] [PubMed] [Google Scholar]
- Cairns BR. The logic of chromatin architecture and remodelling at promoters. Nature. 2009;461:193–198. doi: 10.1038/nature08450. [DOI] [PubMed] [Google Scholar]
- Lessard JA, Crabtree GR. Chromatin regulatory mechanisms in pluripotency. Annu Rev Cell Dev Biol. 2010;26:503–532. doi: 10.1146/annurev-cellbio-051809-102012. [DOI] [PMC free article] [PubMed] [Google Scholar]
- Wilson BG, Roberts CW. SWI/SNF nucleosome remodellers and cancer. Nat Rev Cancer. 2011;11:481–492. doi: 10.1038/nrc3068. [DOI] [PubMed] [Google Scholar]
- Yaniv M. Chromatin remodeling: from transcription to cancer. Cancer Genet. 2014;207:352–357. doi: 10.1016/j.cancergen.2014.03.006. [DOI] [PubMed] [Google Scholar]
- Kowenz-Leutz E, Leutz A. A C/EBP beta isoform recruits the SWI/SNF complex to activate myeloid genes. Mol Cell. 1999;4:735–743. doi: 10.1016/s1097-2765(00)80384-6. [DOI] [PubMed] [Google Scholar]
- Muchardt C, Yaniv M. A human homologue of Saccharomyces cerevisiae SNF2/SWI2 and Drosophila brm genes potentiates transcriptional activation by the glucocorticoid receptor. EMBO J. 1993;12:4279–4290. doi: 10.1002/j.1460-2075.1993.tb06112.x. [DOI] [PMC free article] [PubMed] [Google Scholar]
- Sena JA, Wang L, Hu CJ. BRG1 and BRM chromatin-remodeling complexes regulate the hypoxia response by acting as coactivators for a subset of hypoxia-inducible transcription factor target genes. Mol Cell Biol. 2013;33:3849–3863. doi: 10.1128/MCB.00731-13. [DOI] [PMC free article] [PubMed] [Google Scholar]
- Willis MS, Homeister JW, Rosson GB, Annayev Y, Holley D, Holly SP, Madden VJ, Godfrey V, Parise LV, Bultman SJ. Functional redundancy of SWI/SNF catalytic subunits in maintaining vascular endothelial cells in the adult heart. Circ Res. 2012;111:e111–e122. doi: 10.1161/CIRCRESAHA.112.265587. [DOI] [PMC free article] [PubMed] [Google Scholar]
- Wilson BG, Helming KC, Wang X, Kim Y, Vazquez F, Jagani Z, Hahn WC, Roberts CW. Residual complexes containing SMARCA2 (BRM) underlie the oncogenic drive of SMARCA4 (BRG1) mutation. Mol Cell Biol. 2014;34:1136–1144. doi: 10.1128/MCB.01372-13. [DOI] [PMC free article] [PubMed] [Google Scholar]
- Zhang M, Chen M, Kim JR, Zhou J, Jones RE, Tune JD, Kassab GS, Metzger D, Ahlfeld S, Conway SJ, et al. SWI/SNF complexes containing Brahma or Brahma-related gene 1 play distinct roles in smooth muscle development. Mol Cell Biol. 2011;31:2618–2631. doi: 10.1128/MCB.01338-10. [DOI] [PMC free article] [PubMed] [Google Scholar]
- de la Serna IL, Carlson KA, Imbalzano AN. Mammalian SWI/SNF complexes promote MyoD-mediated muscle differentiation. Nat Genet. 2001;27:187–190. doi: 10.1038/84826. [DOI] [PubMed] [Google Scholar]
- Simone C, Forcales SV, Hill DA, Imbalzano AN, Latella L, Puri PL. p38 pathway targets SWI-SNF chromatin-remodeling complex to muscle-specific loci. Nat Genet. 2004;36:738–743. doi: 10.1038/ng1378. [DOI] [PubMed] [Google Scholar]
- Mallappa C, Nasipak BT, Etheridge L, Androphy EJ, Jones SN, Sagerstrom CG, Ohkawa Y, Imbalzano AN. Myogenic microRNA expression requires ATP-dependent chromatin remodeling enzyme function. Mol Cell Biol. 2010;30:3176–3186. doi: 10.1128/MCB.00214-10. [DOI] [PMC free article] [PubMed] [Google Scholar]
- Forcales SV, Albini S, Giordani L, Malecova B, Cignolo L, Chernov A, Coutinho P, Saccone V, Consalvi S, Williams R, et al. Signal-dependent incorporation of MyoD-BAF60c into Brg1-based SWI/SNF chromatin-remodelling complex. EMBO J. 2012;31:301–316. doi: 10.1038/emboj.2011.391. [DOI] [PMC free article] [PubMed] [Google Scholar]
- Bultman S, Gebuhr T, Yee D, La Mantia C, Nicholson J, Gilliam A, Randazzo F, Metzger D, Chambon P, Crabtree G, et al. A Brg1 null mutation in the mouse reveals functional differences among mammalian SWI/SNF complexes. Mol Cell. 2000;6:1287–1295. doi: 10.1016/s1097-2765(00)00127-1. [DOI] [PubMed] [Google Scholar]
- Klochendler-Yeivin A, Fiette L, Barra J, Muchardt C, Babinet C, Yaniv M. The murine SNF5/INI1 chromatin remodeling factor is essential for embryonic development and tumor suppression. EMBO Rep. 2000;1:500–506. doi: 10.1093/embo-reports/kvd129. [DOI] [PMC free article] [PubMed] [Google Scholar]
- Reyes JC, Barra J, Muchardt C, Camus A, Babinet C, Yaniv M. Altered control of cellular proliferation in the absence of mammalian brahma (SNF2alpha) EMBO J. 1998;17:6979–6991. doi: 10.1093/emboj/17.23.6979. [DOI] [PMC free article] [PubMed] [Google Scholar]
- Muchardt C, Bourachot B, Reyes JC, Yaniv M. ras transformation is associated with decreased expression of the brm/SNF2alpha ATPase from the mammalian SWI-SNF complex. EMBO J. 1998;17:223–231. doi: 10.1093/emboj/17.1.223. [DOI] [PMC free article] [PubMed] [Google Scholar]
- Kadam S, Emerson BM. Transcriptional specificity of human SWI/SNF BRG1 and BRM chromatin remodeling complexes. Mol Cell. 2003;11:377–389. doi: 10.1016/s1097-2765(03)00034-0. [DOI] [PubMed] [Google Scholar]
- Fujio Y, Guo K, Mano T, Mitsuuchi Y, Testa JR, Walsh K. Cell cycle withdrawal promotes myogenic induction of Akt, a positive modulator of myocyte survival. Mol Cell Biol. 1999;19:5073–5082. doi: 10.1128/mcb.19.7.5073. [DOI] [PMC free article] [PubMed] [Google Scholar]
- Guttridge DC, Albanese C, Reuther JY, Pestell RG, Baldwin AS., Jr NF-kappaB controls cell growth and differentiation through transcriptional regulation of cyclin D1. Mol Cell Biol. 1999;19:5785–5799. doi: 10.1128/mcb.19.8.5785. [DOI] [PMC free article] [PubMed] [Google Scholar]
- Skapek SX, Rhee J, Kim PS, Novitch BG, Lassar AB. Cyclin-mediated inhibition of muscle gene expression via a mechanism that is independent of pRB hyperphosphorylation. Mol Cell Biol. 1996;16:7043–7053. doi: 10.1128/mcb.16.12.7043. [DOI] [PMC free article] [PubMed] [Google Scholar]
- Skapek SX, Rhee J, Spicer DB, Lassar AB. Inhibition of myogenic differentiation in proliferating myoblasts by cyclin D1-dependent kinase. Science. 1995;267:1022–1024. doi: 10.1126/science.7863328. [DOI] [PubMed] [Google Scholar]
- Zhang JM, Zhao X, Wei Q, Paterson BM. Direct inhibition of G(1) cdk kinase activity by MyoD promotes myoblast cell cycle withdrawal and terminal differentiation. EMBO J. 1999;18:6983–6993. doi: 10.1093/emboj/18.24.6983. [DOI] [PMC free article] [PubMed] [Google Scholar]
- Asp P, Blum R, Vethantham V, Parisi F, Micsinai M, Cheng J, Bowman C, Kluger Y, Dynlacht BD. Genome-wide remodeling of the epigenetic landscape during myogenic differentiation. Proc Natl Acad Sci USA. 2011;108:E149–E158. doi: 10.1073/pnas.1102223108. [DOI] [PMC free article] [PubMed] [Google Scholar]
- Andres V, Walsh K. Myogenin expression, cell cycle withdrawal, and phenotypic differentiation are temporally separable events that precede cell fusion upon myogenesis. J Cell Biol. 1996;132:657–666. doi: 10.1083/jcb.132.4.657. [DOI] [PMC free article] [PubMed] [Google Scholar]
- Hasty P, Bradley A, Morris JH, Edmondson DG, Venuti JM, Olson EN, Klein WH. Muscle deficiency and neonatal death in mice with a targeted mutation in the myogenin gene. Nature. 1993;364:501–506. doi: 10.1038/364501a0. [DOI] [PubMed] [Google Scholar]
- Liu QC, Zha XH, Faralli H, Yin H, Louis-Jeune C, Perdiguero E, Pranckeviciene E, Munoz-Canoves P, Rudnicki MA, Brand M, et al. Comparative expression profiling identifies differential roles for Myogenin and p38alpha MAPK signaling in myogenesis. J Mol Cell Biol. 2012;4:386–397. doi: 10.1093/jmcb/mjs045. [DOI] [PMC free article] [PubMed] [Google Scholar]
- Ohkawa Y, Marfella CG, Imbalzano AN. Skeletal muscle specification by myogenin and Mef2D via the SWI/SNF ATPase Brg1. EMBO J. 2006;25:490–501. doi: 10.1038/sj.emboj.7600943. [DOI] [PMC free article] [PubMed] [Google Scholar]
- Novitch BG, Mulligan GJ, Jacks T, Lassar AB. Skeletal muscle cells lacking the retinoblastoma protein display defects in muscle gene expression and accumulate in S and G2 phases of the cell cycle. J Cell Biol. 1996;135:441–456. doi: 10.1083/jcb.135.2.441. [DOI] [PMC free article] [PubMed] [Google Scholar]
- Novitch BG, Spicer DB, Kim PS, Cheung WL, Lassar AB. pRb is required for MEF2-dependent gene expression as well as cell-cycle arrest during skeletal muscle differentiation. Curr Biol. 1999;9:449–459. doi: 10.1016/s0960-9822(99)80210-3. [DOI] [PubMed] [Google Scholar]
- Sellers WR, Novitch BG, Miyake S, Heith A, Otterson GA, Kaye FJ, Lassar AB, Kaelin WG., Jr Stable binding to E2F is not required for the retinoblastoma protein to activate transcription, promote differentiation, and suppress tumor cell growth. Genes Dev. 1998;12:95–106. doi: 10.1101/gad.12.1.95. [DOI] [PMC free article] [PubMed] [Google Scholar]
- Blais A, Tsikitis M, Acosta-Alvear D, Sharan R, Kluger Y, Dynlacht BD. An initial blueprint for myogenic differentiation. Genes Dev. 2005;19:553–569. doi: 10.1101/gad.1281105. [DOI] [PMC free article] [PubMed] [Google Scholar]
- Cao Y, Yao Z, Sarkar D, Lawrence M, Sanchez GJ, Parker MH, MacQuarrie KL, Davison J, Morgan MT, Ruzzo WL, et al. Genome-wide MyoD binding in skeletal muscle cells: a potential for broad cellular reprogramming. Dev Cell. 2010;18:662–674. doi: 10.1016/j.devcel.2010.02.014. [DOI] [PMC free article] [PubMed] [Google Scholar]
- Mauro A. Satellite cell of skeletal muscle fibers. J Biophys Biochem Cytol. 1961;9:493–495. doi: 10.1083/jcb.9.2.493. [DOI] [PMC free article] [PubMed] [Google Scholar]
- Brack AS, Rando TA. Tissue-specific stem cells: lessons from the skeletal muscle satellite cell. Cell Stem Cell. 2012;10:504–514. doi: 10.1016/j.stem.2012.04.001. [DOI] [PMC free article] [PubMed] [Google Scholar]
- Yin H, Price F, Rudnicki MA. Satellite cells and the muscle stem cell niche. Physiol Rev. 2013;93:23–67. doi: 10.1152/physrev.00043.2011. [DOI] [PMC free article] [PubMed] [Google Scholar]
- Blais A, van Oevelen CJ, Margueron R, Acosta-Alvear D, Dynlacht BD. Retinoblastoma tumor suppressor protein-dependent methylation of histone H3 lysine 27 is associated with irreversible cell cycle exit. J Cell Biol. 2007;179:1399–1412. doi: 10.1083/jcb.200705051. [DOI] [PMC free article] [PubMed] [Google Scholar]
- Caretti G, Di Padova M, Micales B, Lyons GE, Sartorelli V. The Polycomb Ezh2 methyltransferase regulates muscle gene expression and skeletal muscle differentiation. Genes Dev. 2004;18:2627–2638. doi: 10.1101/gad.1241904. [DOI] [PMC free article] [PubMed] [Google Scholar]
- Ho L, Crabtree GR. Chromatin remodelling during development. Nature. 2010;463:474–484. doi: 10.1038/nature08911. [DOI] [PMC free article] [PubMed] [Google Scholar]
- Atchison L, Ghias A, Wilkinson F, Bonini N, Atchison ML. Transcription factor YY1 functions as a PcG protein in vivo. EMBO J. 2003;22:1347–1358. doi: 10.1093/emboj/cdg124. [DOI] [PMC free article] [PubMed] [Google Scholar]
- Zhang HS, Gavin M, Dahiya A, Postigo AA, Ma D, Luo RX, Harbour JW, Dean DC. Exit from G1 and S phase of the cell cycle is regulated by repressor complexes containing HDAC-Rb-hSWI/SNF and Rb-hSWI/SNF. Cell. 2000;101:79–89. doi: 10.1016/S0092-8674(00)80625-X. [DOI] [PubMed] [Google Scholar]
- Joliot V, Ait-Mohamed O, Battisti V, Pontis J, Philipot O, Robin P, Ito H, Ait-Si-Ali S. The SWI/SNF subunit/tumor suppressor BAF47/INI1 is essential in cell cycle arrest upon skeletal muscle terminal differentiation. PLoS ONE. 2014;9:e108858. doi: 10.1371/journal.pone.0108858. [DOI] [PMC free article] [PubMed] [Google Scholar]
- Mozzetta C, Consalvi S, Saccone V, Tierney M, Diamantini A, Mitchell KJ, Marazzi G, Borsellino G, Battistini L, Sassoon D, et al. Fibroadipogenic progenitors mediate the ability of HDAC inhibitors to promote regeneration in dystrophic muscles of young, but not old Mdx mice. EMBO Mol Med. 2013;5:626–639. doi: 10.1002/emmm.201202096. [DOI] [PMC free article] [PubMed] [Google Scholar]
- Albini S, Coutinho P, Malecova B, Giordani L, Savchenko A, Forcales SV, Puri PL. Epigenetic reprogramming of human embryonic stem cells into skeletal muscle cells and generation of contractile myospheres. Cell Rep. 2013;3:661–670. doi: 10.1016/j.celrep.2013.02.012. [DOI] [PMC free article] [PubMed] [Google Scholar]
Associated Data
This section collects any data citations, data availability statements, or supplementary materials included in this article.
Supplementary Materials
Expanded View Figures PDF
Table EV1
Table EV2
Review Process File


