Abstract
Previous studies in our laboratory have demonstrated that prostaglandin (PG) E2 is involved in anorexia/cachexia development in MCG 101 tumor-bearing mice. In the present study, we investigate the role of PGE receptor subtype EP2 in the development of anorexia after MCG 101 implantation in wild-type (EP2+/+) or EP2-receptor knockout (EP2−/−) mice. Our results showed that host absence of EP2 receptors attenuated tumor growth and development of anorexia in tumor-bearing EP2 knockout mice compared to tumor-bearing wild-type animals. Microarray profiling of the hypothalamus revealed a relative twofold change in expression of around 35 genes including mRNA transcripts coding for Phospholipase A2 and Prostaglandin D2 synthase (Ptgds) in EP2 receptor knockout mice compared to wild-type mice. Prostaglandin D2 synthase levels were increased significantly in EP2 receptor knockouts, suggesting that improved food intake may depend on altered balance of prostaglandin production in hypothalamus since PGE2 and PGD2 display opposing effects in feeding control.
Keywords: Anorexia, cachexia, EP receptor, hypothalamus, microarray analysis, Prostaglandin D synthase
Introduction
Tumors are known to cause inflammation through release of cascades of inflammatory signals including interleukins and prostaglandins in order to promote growth (Lönnroth et al. 1995). Cytokines and eicosanoides cause a variety of secondary physiological responses of the host, including anorexia and weight loss (Plata-Salaman 1999; Furuyashiki and Narumiya 2011). The precise mechanisms of prostaglandins to alter feeding and metabolism are, however, not fully known. Prostaglandins act on specific EP receptor subtypes which are transmembrane spanning, G-protein coupled receptors classified as EP1, EP2, EP3, and EP4. Each EP receptor is associated with a unique G-protein and a second messenger system, but signaling can also be transduced by G-protein-independent mechanisms (Jiang and Dingledine 2013a). Previously, attention has been paid to the role of EP receptor subtypes 1, 3, and 4 in anorexia secondary to tumor growth (Wang et al. 2001, 2005a; Ruud et al. 2013). However, since cyclooxygenase inhibition by indomethacin failed to improve food intake but maintained body composition in tumor-bearing animals genetically depleted of EP1 or EP3 receptors, it would appear that these receptors do not participate in a prostaglandin-induced anorexic response (Wang et al. 2005a). A possible candidate for central anorexia could be EP4 receptor since ICV injection of an EP4 antagonist blocked the anorexic effect of PGE2 administration in healthy mice (Ohinata et al. 2006). However, PGE2-EP4 receptor ligand binding does not seem to be the underlying mechanism in tumor-induced hypophagia since CNS-specific disruption of EP4 receptors did not alter the anorexic response in MCG 101 tumor-bearing animals (Ruud et al. 2013).
From a clinical perspective, PGE2 has raised interest since it may be released from epithelial tumors such as colon cancer in progressive disease (Yang et al. 1998; Cahlin et al. 2008). There are several possible mechanisms for PGE2 to reach its central target receptors. PGE2 is highly lipophilic and can readily cross the blood–brain barrier but has a very short half-life in the circulation, and passive diffusion has been suggested to be of less importance (Ruud et al. 2013). Instead circulating PGE2 was suggested to act in the circumventricular organs and induce central PG synthesis and release via COX-activation (Laflamme et al. 1999). Prostaglandins display significant cross-reactivity on all of the four subtypes of EP receptors (Kiriyama et al. 1997) and EP1–4 receptors are present in hypothalamus and brainstem areas of relevance for feeding control and metabolism (Zhang and Rivest 1999; Wang et al. 2005b; Ruud et al. 2013).
The aim of the present study was to evaluate the role of subtype EP2 receptor signaling for development of anorexia in tumor-bearing animals since genetic knockout studies could not verify a role of other PGE receptor candidates as EP1, EP3, or EP4, in mediating the prostaglandin-induced anorexic response of the tumor-bearing host (Wang et al. 2005a; Ruud et al. 2013). For this purpose we used a solid tumor model, MCG 101, which induces anorexia and cachexia in part due to elevated intrinsic production of PGE2. In order to explore the role of the EP2 receptor for anorexia development, an EP2−/− knockout mice model was used.
Materials and Methods
Animal experiments
The animal experimental protocol was approved by the Regional committee for animal ethics in Göteborg. Adult, male and female and age-matched EP2−/− and EP2+/+ mice (C57BL/6 genetic background) (Tilley et al. 1999) were bred and housed in plastic cages in a temperature controlled room with a 12 h dark/light cycle and received standard laboratory rodent chow (B & K Universal AB, Stockholm, Sweden). Animal groups were tumor-bearing (TB) and sham-treated controls (FF) in EP2−/− and EP2+/+ mice. All animals had free access to tap water and food at all times before and during experiments. Prior to experiments, mice were transferred to cages with wire floor that permitted collection and quantification of spilled food by weighing. Daily food intake and body weight were registered in the morning between 08.00 and 09.00. Animals were allowed 3 days adaptation to wire floors before the start of experiments (day 0) (Lönnroth et al. 1995; Wang et al. 2005a,c). Tumor-bearing mice were implanted s.c. bilaterally in the flank with a 3–5 mm3 of a transplantable MCG-101 methylcholanthrene-induced tumor under general anesthesia (Isofluran, inhaled concentration 2.7%) (Lundholm et al. 1978). Control mice were sham implanted. All mice were sacrificed on day 10 upon tumor implantation between 8–11 am. Blood samples were obtained by cardiac puncture during general anesthesia for plasma PGE2 determination followed by 20 mL 4°C transcardiac saline perfusion (Lönnroth et al. 1995; Wang et al. 2001). The brains were rapidly removed and hypothalamus was dissected free, snap-frozen in liquid nitrogen, and kept at −80°C until micro-array analyses. Dry tumor weight, water content, fat-free carcass weight, and whole-body fat were determined as described (Eden et al. 1983).
RNA extraction
Total RNA was extracted using RNeasy Lipid Tissue mini kit (Qiagen GmbH, Hilden, Germany) with on column DNase treatment included according to kit protocol. Quality of RNA was checked in an Agilent 2100 BioAnalyzer with the RNA 6000 Nano Assay kit (Agilent Technologies, Inc., Santa Clara, CA). The concentration of RNA was measured in a Nano Drop ND-1000A spectrophotometer (NanoDrop Technologies, Inc., Wilmington, DE). Hypothalamic mRNA for microarray analysis was pooled from seven mice in each group.
Real-time PCR
Two hundred nanograms of total RNA from each hypothalamus were reverse transcribed in a cDNA synthesis reaction using oligo d(T) primers according to the manufacturer’s instructions (Advantage® RT for PCR kit; Takara Bio Europe/Clontech, Saint-Germain-en-Laye, France). Positive and negative controls were included in each run of cDNA synthesis. Predesigned primers from Qiagen were used for analysis of mouse Ptgs1, (Cox1, Assay 00155330) Ptgs2, (Cox2, Assay QT00165347) and Ptgds (PGD2 synthase, Assay QT00098049). Real-time PCR analysis was performed using either QantiTect SYBR Green kit or LightCykler FastStart DNA MasterPLUS SYBR Green I kit (Roche Diagnostics Scandinavia AB, Bromma, Sweden). Two microliter of diluted cDNA and 2 μL of primer were used for each reaction of 20 μL. All samples were analyzed in duplicates, and positive and negative results were included in each run. A LightCykler 1.5 instrument was used for all analyses. Quantitative results were produced by the relative standard curve method using GAPDH as housekeeping gene, which was equally expressed among groups.
Microarray expression profiling
Five hundred nanograms of pooled total RNA from each group were labeled with Cyanine 3-dCTP or Cyanine 5-dCTP (GE Healtcare Life sciences, Uppsala, Sweden) in a cDNA synthesis reaction using the Agilent Fluorescent Direct Label Kit (n = 7/group). Whole Mouse Genome Oligo Microarray (4 × 44K; Agilent Technologies) containing 41,174 features, including positive and negative control spots, were used. Hybridization was performed during 18 h with EP2−/− TB versus EP2+/+ TB cDNA in a dual-color experiment, followed by posthybridization washes according to “in situ Hybridization Kit Plus” (Agilent Technologies) instructions. Two technical replicates were done. The microarrays were dried with nitrogen gas in laminar flow and images were quantified on an Agilent G2565 AA microarray scanner. Fluorescence intensities were extracted using the Feature Extraction software program v9.1.3.1. (Agilent Technologies). Dye-normalized, outlier- and background-subtracted values were imported with the FE Plug-in (Agilent Technologies) into GeneSpring software program v 12.5 that was used for data analysis. Of the 41,232 features on the array, 18,851 features from pooled hypothalamus RNA were detected as present, with a signal ≥2.6 SD above background signal; 1747 entities remained after t-test against zero (P < 0.05). Fold changes 1.5 of Log2 transformed ratios were considered statistically significant in gene expression and used for further analyses in Gene Ontology search and pathway analysis. A fold change of 1.5 corresponds to a change in gene expression of 50% which has been reported to generate reproducible sets of altered genes when compared across microarray platforms (Patterson et al. 2006).
Statistics
Results are presented as mean ± SE. Food intake and animal weight over time were compared by two-way ANOVA for repeated measures. End point variables (tumor weight, body composition, plasma PGE2 concentration and mRNA levels) were compared by one-way factorial ANOVA followed by Fisher PLSD, or t-test when appropriate. P ≤ 0.05 was considered statistically significant in two-tailed tests. Statview for Windows v. 5.0.1 was used for statistical calculations. Statistical evaluations of microarray analyses were done in Genespring 12.5 software as described in the Materials and Methods section.
Results
Food intake
Food intake declined significantly in wild-type tumor-bearing mice around day 7 and remained lower compared to sham controls in wild-type EP2+/+ mice (Fig.1A). There was no significant tumor-induced anorexia in tumor-bearing EP2−/− knockouts (Fig.1B).
Figure 1.
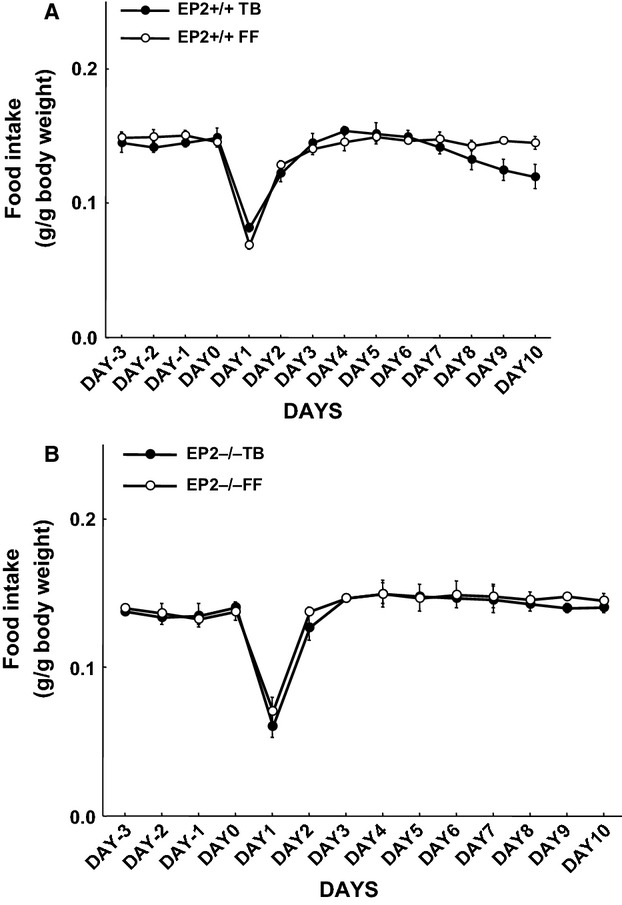
Time-course changes of food intake in EP2+/+ (A) and EP2−/− (B) tumor-bearing mice (TB) and sham controls (FF). Food intake decreased significantly in TB wild-type mice from days 6 to 7 when tumor mass appeared (P < 0.05, A) (mean ± SEM, seven animals in each observation point; ANOVA for repeated measures).
Tumor weight and body composition
Tumor wet and dry weight were significantly lower at the end of the experiment in knockout mice (EP2−/−) compared to wild-type animals (EP2+/+) (P < 0.05; Fig.2). Pronounced alteration was observed in EP2+/+ groups due to larger tumors and whole-body water retention. Water retention did not occur in EP2−/− mice (Fig.3). Fat-free carcass dry weight was significantly preserved in EP2−/− tumor-bearing mice compared to wild-type EP2+/+ tumor-bearing mice (P < 0.001; Fig.4), while whole-body fat did not differ between EP2−/− and wild-type tumor-bearing mice. Plasma PGE2 levels were similarly elevated in tumor-bearing mice compared to controls in both EP2−/− and EP2+/+ mice (Fig.5).
Figure 2.
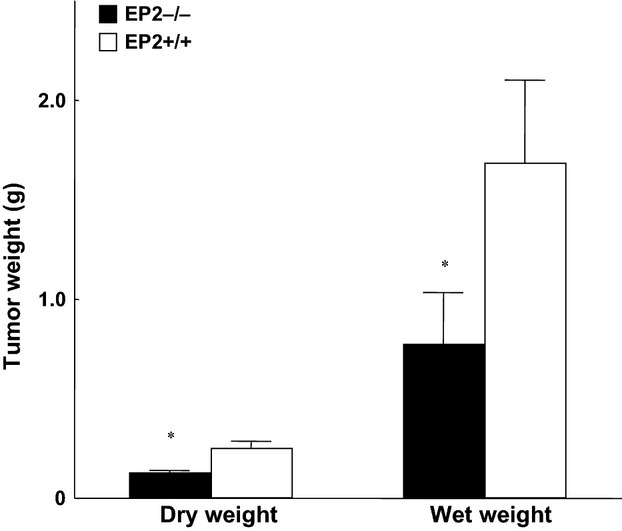
Tumor wet and dry weight at the end of experiments (day 10) in EP2−/− and EP2+/+ tumor-bearing mice (mean ± SEM, *P < 0.05; seven animals in each group).
Figure 3.
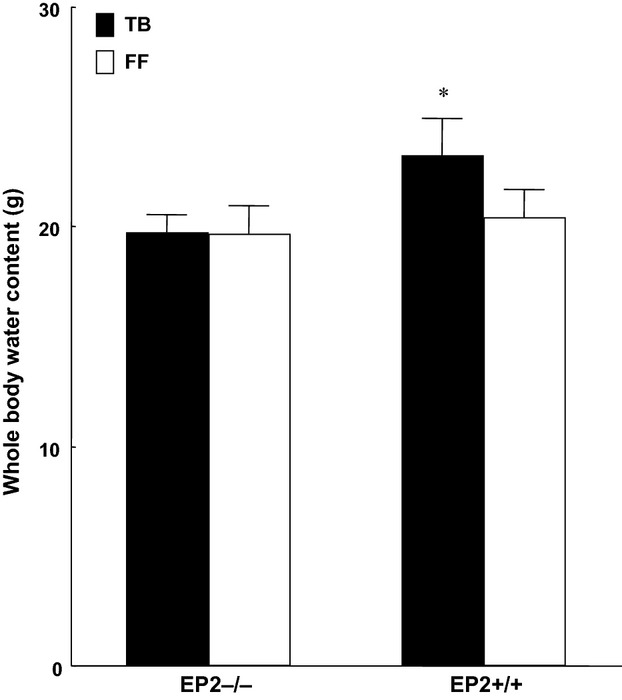
Whole-body water content in freely fed tumor-bearing mice (TB) and sham controls (FF) at the end of experiment (day 10) (mean ± SEM, *P < 0.05; seven animals in each group).
Figure 4.
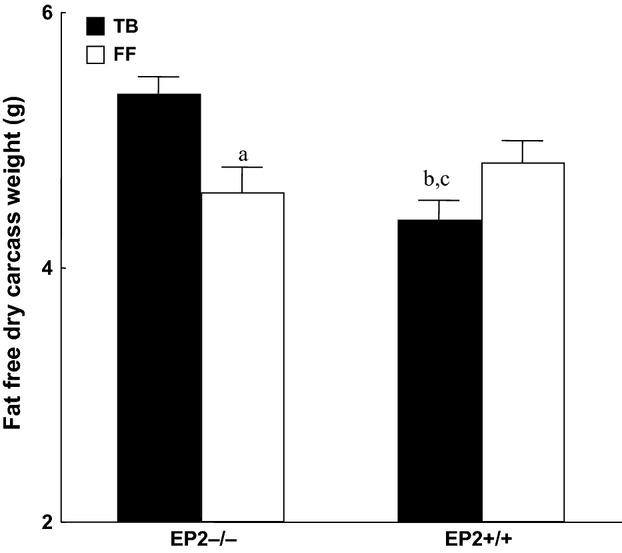
Whole-body fat-free carcass dry weight at the end of the experiments (day 10) in freely fed tumor-bearing animals (TB) and sham controls (FF) (mean ± SEM, (a) P < 0.01 versus TB EP2−/− ; (b) P < 0.07 versus FF EP2+/+ ; (c) P < 0.001 versus TB EP2−/−; seven animals in each group).
Figure 5.
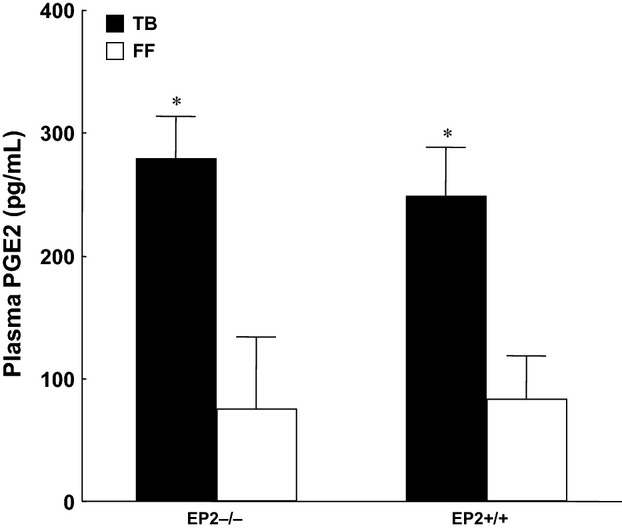
Plasma PGE2 concentration in tumor-bearing EP2−/− and EP2+/+ mice compared to sham controls (FF) at the end of experiment (day 10) (mean ± SEM, *P < 0.01; seven animals in each group).
RNA expression in brain hypothalamus
Microarray analysis of pooled extracts of hypothalami from tumor-bearing EP2−/− mice (n = 7) relative to tumor-bearing EP2+/+ animals (n = 7) showed differences in mRNA gene expression. We identified 182 genes that had above 1.5-fold change in relative expression between groups; 38 entities had above twofold difference (8 up- and 30 downregulated in EP2−/− vs. EP2+/+ mice). The gene list with 1.5-fold changed genes was used for Pathway- and gene ontology analyses to find enriched pathways and categories of genes. Gene ontology search showed a significant match with the GO category GO:0048511 “Rhythmic processes” which contains genes involved in generation and maintenance of rhythms in the physiology of an organism. Additional significant matches were found with Wikipathways “IL2 signaling” P < 0.05 (two matching genes) and “TGFβ receptor signaling” P < 0.001 (five matching genes, Table1). We also found Platg2f, coding for Phospholipase A2 (down 2.2) and Ptgds; coding for Prostaglandin D2 synthase (up 2.2), among the genes with large change in expression between groups (TB EP2+/+ vs. TB EP2−/−).
Table 1.
mRNA transcripts related to TGF-β signaling with altered levels in hypothalamic tissue from MCG 101 tumor-bearing EP2−/− versus EP2+/+ mice at the end of experiment (day 10)
| Gene name | Gene symbol | NCBI gene ID | Fold change | Regulation |
|---|---|---|---|---|
| SMAD family member 7 | Smad7 | 17131 | 1.8 | Up |
| Protein Kinase C, delta | Prkcd | 18753 | 1.7 | Up |
| Adaptor-related protein complex2, beta 1 subunit | Ap2b1 | 71770 | 1.6 | Up |
| Mitogen-activated protein kinase kinase 6 | Map2k6 | 26399 | 1.5 | Up |
| Lympoid enhancer-binding protein | Lef1 | 16842 | 1.6 | Down |
By real-time PCR we confirmed changes in Ptgds (Prostaglandin D2 synthase) and extended our analysis to include additional genes relevant for prostaglandin production Ptgs1 (Cox1), Ptgs2 (Cox2) (n = 7/group). Hypothalamic Cox1 levels were significantly lower while Cox2 levels were increased in tumor-bearing mice compared to controls (Table2), while Cox2 expression was not significantly altered between tumor-bearing EP2−/− and EP2+/+ mice (Fig.6). Prostaglandin D2 synthase was, however, significantly increased in EP2−/− tumor-bearing mice compared to EP2+/+ tumor-bearing animals (Fig.6).
Table 2.
Relative concentrations of Cox 1 and Cox 2 mRNA transcripts in hypothalamic tissue from EP2−/− and EP2+/+ MCG 101 tumor-bearing mice (TB) and sham-implanted controls (FF) at the end of experiment (day 10, mean ± SEM)
| EP2+/+ | EP2−/− | |
|---|---|---|
| Cox 1 | ||
| TB | 1.06 ± 0.11a | 1.32 ± 0.08a |
| FF | 2.24 ± 0.12 | 1.99 ± 0.07 |
| Cox 2 | ||
| TB | 3.17 ± 0.85b | 4.82 ± 0.9c |
| FF | 1.73 ± 0.21 | 1.39 ± 0.19 |
P < 0.001 versus corresponding FF control of same genetic type.
P < 0.15 versus corresponding FF control of same genetic type.
P < 0.01 versus corresponding FF control of same genetic type.
Figure 6.
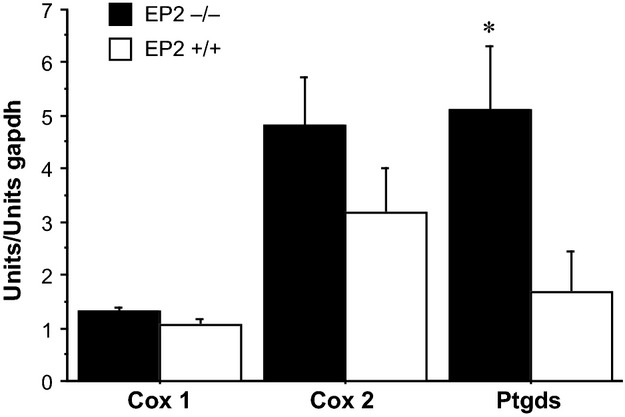
Levels of hypothalamic Cox-1, Cox-2, and Prostaglandin D2 synthase, mRNA in tumor-bearing EP2−/− and EP2+/+ mice at the end of experiment (day 10) (mean ± SEM, *P < 0.05; seven animals in each group).
Discussion
In the present study, we examined the role of the EP2 receptor in anorexia development in mice carrying tumors that induce anorexia/cachexia and released increased levels of PGE2. We confirmed the results previously observed in the wild-type tumor-bearing groups, where exposure to MCG 101 over 10 days caused reductions of food intake and fat-free carcass weight (Cahlin et al. 2000; Wang et al. 2005a,c). We also found that host absence of EP2 receptors retarded MCG 101 tumor growth and maintained food intake and fat-free carcass weight. Genetic knockout of host EP2 receptors lead to significant changes in expression of mRNA transcripts related to prostanoid production in brain hypothalamus.
In the MCG 101 model the tumor cells produce prostaglandin E2, which consequently leads to elevated plasma levels of PGE2 (Lönnroth et al. 1995). Although prostaglandin E2 is suggested to cross the blood–brain barrier our previous study found no elevation of PGE2 or its metabolites in cerebrospinal fluid (Ruud et al. 2013). However, indomethacin treatment decreased anorexia concomitant with normalized plasma PGE2 levels (Wang et al. 2005a), suggesting COX dependency. We have previously suggested that anorexia is dependent on COX-1 expression rather than COX-2 in this model, since a COX-1 inhibitor delayed onset of anorexia while a selective COX-2 inhibitor was without such effect (Ruud et al. 2013). In the present experiments we found no change in relative expression of either COX-1 or COX-2 mRNA in hypothalamus from tumor-bearing EP2 receptor knockouts compared to tumor-bearing wild-type mice. However, both COX-1 and COX-2 mRNA expressions were significantly altered relative to sham-treated mice. Seen together, it appears that prostaglandins attenuate appetite and stimulate tumor growth which leads to overt cachexia. However, it remains to be determined whether systemic prostaglandins or brain PG production are of relevance. Likely, systemic PGE2 stimulates tumor growth while hypothalamic PGE2 production promotes anorexia. In earlier experiments we reported that loss of host EP1 or EP3 receptors did not alter anorexia in mice carrying MCG 101 tumors despite effects on tumor growth and body composition by indomethacin treatment (Wang et al. 2005a). Moreover, food intake was improved by short-term treatment by Cox-inhibitors without any effects on tumor size (Ruud et al. 2013). Such findings suggest separate effects of systemic and brain PG production and/or signaling linked to anorexia/cachexia secondary to tumor growth.
To identify other potential CNS mechanisms behind altered anorexia in EP2 receptor knockout mice we performed microarray analyses of hypothalamic extracts from tumor-bearing EP2−/− mice relative to EP2+/+ animals. In total, there was a 1.5-fold change difference in expression of around 180 genes. A metabolic pathway search revealed possible involvement of TGFβ signaling, which is associated with inflammatory response and reported to regulate COX/PGE2 levels, also in CNS (Luo et al. 1998; Minghetti et al. 1998; Matsumura et al. 2009; Fang et al. 2014), although our mice did not display altered COX mRNA levels., However, we found changed expression of other genes directly involved in PG production, such as increased amount of mRNA for Prostaglandin D2 synthase, and decreased expression of Phospholipase A2 from hypothalami of tumor-bearing EP2−/− mice compared with EP2+/+ animals. Thus, reduced expression of Phospholipase A2 could reflect adaptation of PG production in the brain secondary to lack of EP2 receptors, contributing to improved food intake, although CNS levels of prostaglandins were not measured in present experiments.
PGD2 and PGE2 are positional isomers and have several opposing effects in physiological processes as sleep, body temperature, and feeding behavior (Kandasamy and Hunt 1990; Hayaishi 1991; Ohinata and Yoshikawa 2008). PGE2 and PGD2 are produced from the same precursor, PGH2, and is then converted to PGE2/PGD2 by specific enzymes. PGE2 is produced by the different isoforms of Prostaglandin E2 synthases whereas Prostaglandin D2 synthase produces PGD2. Recent findings report that central administration of PGD2 was associated with stimulation of food intake (Ohinata et al. 2008). Moreover, intraventricularly administered PGD2 was reported to stimulate food intake via DP1 receptor activation (Ohinata et al. 2008). The orexigenic effect of PGD2 was suggested to stimulate food intake via activation of NPY Y1 (Ohinata et al. 2008), the most orexigenic of the NPY receptors (Blomqvis and Herzog 1997), and increased mRNA levels of Prostaglandin D2 synthase were found in brain tissue of fasted mice as well as in food-restricted rats, without similar increases in tumor-bearing animals, supporting its role in appetite control (Ohinata et al. 2008; Pourtau et al. 2011). Therefore, it is plausible that maintained food intake in the EP2−/− tumor mice was induced by increased DP1 receptor activity.
Our present and previous results suggest that host EP receptors are involved in control of tumor growth. In the present study, loss of host EP2 receptors reduced tumor growth which was also observed in our previous studies on EP1-deficient mice, whereas a lack of EP3 receptors increased tumor growth (Wang et al. 2005a). Earlier preclinical and clinical studies, suggest a role for cyclooxygenases and prostaglandins in tumor progression, although their downstream signaling is still not well understood. Our finding of reduced MCG 101 tumor growth agree with findings of reduced tumor growth in several other models, such as the syngenic colorectal cancer cell line MC26 as well as Lewis lung carcinoma in hosts lacking EP2 receptors (Yang et al. 2003). The importance of EP2 receptors for cancer cell proliferation has also been demonstrated using newly discovered selective EP2 antagonists (Jiang and Dingledine 2013b).
In conclusion, we demonstrate the importance of EP2 receptors for anorexia, cachexia progression in tumor-bearing mice, possibly mediated by altered balance of PGE2/PGD2 production in brain hypothalamus. Our results of reduced MCG 101 tumor growth are consistent with previous studies showing the importance of EP2 receptor signaling in tumor proliferation.
Acknowledgments
We are grateful to Professors Kent Lundholm and Anders Blomqvist for their support of this study.
Conflict of Interest
The authors declare that they have no competing interests.
References
- Blomqvis AG. Herzog H. Y-receptor subtypes–how many more? Trends Neurosci. 1997;20:294–298. doi: 10.1016/s0166-2236(96)01057-0. [DOI] [PubMed] [Google Scholar]
- Cahlin C, Korner A, Axelsson H, Wang W, Lundholm K. Svanberg E. Experimental cancer cachexia: the role of host-derived cytokines interleukin (IL)-6, IL-12, interferon-gamma, and tumor necrosis factor alpha evaluated in gene knockout, tumor-bearing mice on C57 Bl background and eicosanoid-dependent cachexia. Cancer Res. 2000;60:5488–5493. [PubMed] [Google Scholar]
- Cahlin C, Lonnroth C, Arvidsson A, Nordgren S. Lundholm K. Growth associated proteins in tumor cells and stroma related to disease progression of colon cancer accounting for tumor tissue PGE2 content. Int. J. Oncol. 2008;32:909–918. [PubMed] [Google Scholar]
- Eden E, Lindmark L, Karlberg I. Lundholm K. Role of whole-body lipids and nitrogen as limiting factors for survival in tumor-bearing mice with anorexia and cachexia. Cancer Res. 1983;43:3707–3711. [PubMed] [Google Scholar]
- Fang L, Chang HM, Cheng JC, Leung PC. Sun YP. TGF-beta1 induces COX-2 expression and PGE2 production in human granulosa cells through Smad signaling pathways. J. Clin. Endocrinol. Metab. 2014;99:E1217–E1226. doi: 10.1210/jc.2013-4100. [DOI] [PubMed] [Google Scholar]
- Furuyashiki T. Narumiya S. Stress responses: the contribution of prostaglandin E(2) and its receptors. Nat. Rev. Endocrinol. 2011;7:163–175. doi: 10.1038/nrendo.2010.194. [DOI] [PubMed] [Google Scholar]
- Hayaishi O. Molecular mechanisms of sleep-wake regulation: roles of prostaglandins D2 and E2. FASEB J. 1991;5:2575–2581. [PubMed] [Google Scholar]
- Jiang J. Dingledine R. Prostaglandin receptor EP2 in the crosshairs of anti-inflammation, anti-cancer, and neuroprotection. Trends Pharmacol. Sci. 2013a;34:413–423. doi: 10.1016/j.tips.2013.05.003. [DOI] [PMC free article] [PubMed] [Google Scholar]
- Jiang J. Dingledine R. Role of prostaglandin receptor EP2 in the regulations of cancer cell proliferation, invasion, and inflammation. J. Pharmacol. Exp. Ther. 2013b;344:360–367. doi: 10.1124/jpet.112.200444. [DOI] [PMC free article] [PubMed] [Google Scholar]
- Kandasamy SB. Hunt WA. Involvement of prostaglandins and histamine in radiation-induced temperature responses in rats. Radiat. Res. 1990;121:84–90. [PubMed] [Google Scholar]
- Kiriyama M, Ushikubi F, Kobayashi T, Hirata M, Sugimoto Y. Narumiya S. Ligand binding specificities of the eight types and subtypes of the mouse prostanoid receptors expressed in Chinese hamster ovary cells. Br. J. Pharmacol. 1997;122:217–224. doi: 10.1038/sj.bjp.0701367. [DOI] [PMC free article] [PubMed] [Google Scholar]
- Laflamme N, Lacroix S. Rivest S. An essential role of interleukin-1beta in mediating NF-kappaB activity and COX-2 transcription in cells of the blood-brain barrier in response to a systemic and localized inflammation but not during endotoxemia. J. Neurosci. 1999;19:10923–10930. doi: 10.1523/JNEUROSCI.19-24-10923.1999. [DOI] [PMC free article] [PubMed] [Google Scholar]
- Lönnroth C, Svaninger G, Gelin J, Cahlin C, Iresjö B-M, Cvetkovska E, et al. Effects related to indomethacin prolonged survival and decreased tumor growth in a mouse tumor model with cytokine dependent cancer cachexia. Int. J. Oncol. 1995;7:1405–1413. doi: 10.3892/ijo.7.6.1405. [DOI] [PubMed] [Google Scholar]
- Lundholm K, Edstrom S, Ekman L, Karlberg I, Bylund AC. Schersten T. A comparative study of the influence of malignant tumor on host metabolism in mice and man: evaluation of an experimental model. Cancer. 1978;42:453–461. doi: 10.1002/1097-0142(197808)42:2<453::aid-cncr2820420212>3.0.co;2-t. [DOI] [PubMed] [Google Scholar]
- Luo J, Lang JA. Miller MW. Transforming growth factor beta1 regulates the expression of cyclooxygenase in cultured cortical astrocytes and neurons. J. Neurochem. 1998;71:526–534. doi: 10.1046/j.1471-4159.1998.71020526.x. [DOI] [PubMed] [Google Scholar]
- Matsumura T, Suzuki T, Aizawa K, Sawaki D, Munemasa Y, Ishida J, et al. Regulation of transforming growth factor-beta-dependent cyclooxygenase-2 expression in fibroblasts. J. Biol. Chem. 2009;284:35861–35871. doi: 10.1074/jbc.M109.014639. [DOI] [PMC free article] [PubMed] [Google Scholar]
- Minghetti L, Polazzi E, Nicolini A. Levi G. Opposite regulation of prostaglandin E2 synthesis by transforming growth factor-beta1 and interleukin 10 in activated microglial cultures. J. Neuroimmunol. 1998;82:31–39. doi: 10.1016/S0165-5728(97)00185-9. [DOI] [PubMed] [Google Scholar]
- Ohinata K. Yoshikawa M. Central prostaglandins in food intake regulation. Nutrition. 2008;24:798–801. doi: 10.1016/j.nut.2008.06.006. [DOI] [PubMed] [Google Scholar]
- Ohinata K, Suetsugu K, Fujiwara Y. Yoshikawa M. Activation of prostaglandin E receptor EP4 subtype suppresses food intake in mice. Prostaglandins Other Lipid Mediat. 2006;81:31–36. doi: 10.1016/j.prostaglandins.2006.06.008. [DOI] [PubMed] [Google Scholar]
- Ohinata K, Takagi K, Biyajima K, Fujiwara Y, Fukumoto S, Eguchi N, et al. Central prostaglandin D(2) stimulates food intake via the neuropeptide Y system in mice. FEBS Lett. 2008;582:679–684. doi: 10.1016/j.febslet.2008.01.050. [DOI] [PubMed] [Google Scholar]
- Patterson TA, Lobenhofer EK, Fulmer- Smentek SB, Collins PJ, Chu TM, Bao W, et al. Performance comparison of one-color and two-color platforms within the MicroArray Quality Control (MAQC) project. Nat. Biotechnol. 2006;24:1140–1150. doi: 10.1038/nbt1242. [DOI] [PubMed] [Google Scholar]
- Plata-Salaman CR. 1998 Curt P. Richter Award. Brain mechanisms in cytokine-induced anorexia. Psychoneuroendocrinology. 1999;24:25–41. doi: 10.1016/s0306-4530(98)00045-6. [DOI] [PubMed] [Google Scholar]
- Pourtau L, Leemburg S, Roux P, Leste-Lasserre T, Costaglioli P, Garbay B, et al. Hormonal, hypothalamic and striatal responses to reduced body weight gain are attenuated in anorectic rats bearing small tumors. Brain Behav. Immun. 2011;25:777–786. doi: 10.1016/j.bbi.2011.02.004. [DOI] [PubMed] [Google Scholar]
- Ruud J, Nilsson A, Engstrom Ruud L, Wang W, Nilsberth C, Iresj BM, et al. Cancer-induced anorexia in tumor-bearing mice is dependent on cyclooxygenase-1. Brain Behav. Immun. 2013;29:124–135. doi: 10.1016/j.bbi.2012.12.020. [DOI] [PubMed] [Google Scholar]
- Tilley SL, Audoly LP, Hicks EH, Kim HS, Flannery PJ, Coffman TM, et al. Reproductive failure and reduced blood pressure in mice lacking the EP2 prostaglandin E2 receptor. J. Clin. Invest. 1999;103:1539–1545. doi: 10.1172/JCI6579. [DOI] [PMC free article] [PubMed] [Google Scholar]
- Wang W, Lonnroth C, Svanberg E. Lundholm K. Cytokine and cyclooxygenase-2 protein in brain areas of tumor-bearing mice with prostanoid-related anorexia. Cancer Res. 2001;61:4707–4715. [PubMed] [Google Scholar]
- Wang W, Andersson M, Lonnroth C, Svanberg E, Lundholm K. Anorexia and cachexia in prostaglandin EP1 and EP3 subtype receptor knockout mice bearing a tumor with high intrinsic PGE2 production and prostaglandin related cachexia. J. Exp. Clin. Cancer Res. 2005a;24:99–107. [PubMed] [Google Scholar]
- Wang W, Andersson M, Lonnroth C, Svanberg E. Lundholm K. Prostaglandin E and prostacyclin receptor expression in tumor and host tissues from MCG 101-bearing mice: a model with prostanoid-related cachexia. Int. J. Cancer. 2005b;115:582–590. doi: 10.1002/ijc.20539. [DOI] [PubMed] [Google Scholar]
- Wang W, Svanberg E, Delbro D. Lundholm K. NOS isoenzyme content in brain nuclei as related to food intake in experimental cancer cachexia. Brain Res. Mol. Brain Res. 2005c;134:205–214. doi: 10.1016/j.molbrainres.2004.10.038. [DOI] [PubMed] [Google Scholar]
- Yang VW, Shields JM, Hamilton SR, Spannhake EW, Hubbard WC, Hylind LM, et al. Size-dependent increase in prostanoid levels in adenomas of patients with familial adenomatous polyposis. Cancer Res. 1998;58:1750–1753. [PubMed] [Google Scholar]
- Yang L, Yamagata N, Yadav R, Brandon S, Courtney RL, Morrow JD, et al. Cancer-associated immunodeficiency and dendritic cell abnormalities mediated by the prostaglandin EP2 receptor. J. Clin. Invest. 2003;111:727–735. doi: 10.1172/JCI16492. [DOI] [PMC free article] [PubMed] [Google Scholar]
- Zhang J. Rivest S. Distribution, regulation and colocalization of the genes encoding the EP2- and EP4-PGE2 receptors in the rat brain and neuronal responses to systemic inflammation. Eur. J. Neurosci. 1999;11:2651–2668. doi: 10.1046/j.1460-9568.1999.00682.x. [DOI] [PubMed] [Google Scholar]


