Abstract
In the mammalian retina, processes of ~70 types of interneurons form specific synapses on ~30 types of retinal ganglion cells (RGCs) in a neuropil called the inner plexiform layer (IPL). Each RGC type extracts salient features from visual input, which are sent deeper into the brain for further processing 1-4. The specificity and stereotypy of synapses formed in the IPL account for the feature-detecting ability of the RGCs. Here, we analyze the development and function of synapses on one RGC type, the W3B-RGC5,6. These cells have the remarkable property of responding when the timing of a small object's movement differs from that of the background, but not when they coincide6. Such cells, called “local edge detectors” or “object motion sensors”, can distinguish moving objects from a visual scene that is also moving6-12. We show that W3B-RGCs receive strong and selective input from an unusual excitatory amacrine cell type called VG3-AC. Both W3B-RGCs and VG3-ACs express the immunoglobulin superfamily recognition molecule Sidekick-2 (Sdk2)13,14, and both loss- and gain-of function studies indicate that Sdk2-dependent homophilic interactions are necessary for the selectivity of the connection. The Sdk2-specified synapse is essential for visual responses of W3B-RGCs: whereas bipolar cells relay visual input directly to most RGCs, the W3B-RGCs receive much of their input indirectly, via the VG3-ACs. This non-canonical circuit introduces a delay into the pathway from photoreceptors in the center of the receptive field to W3B-RGCs, which could improve their ability to judge the synchrony of local and global motion.
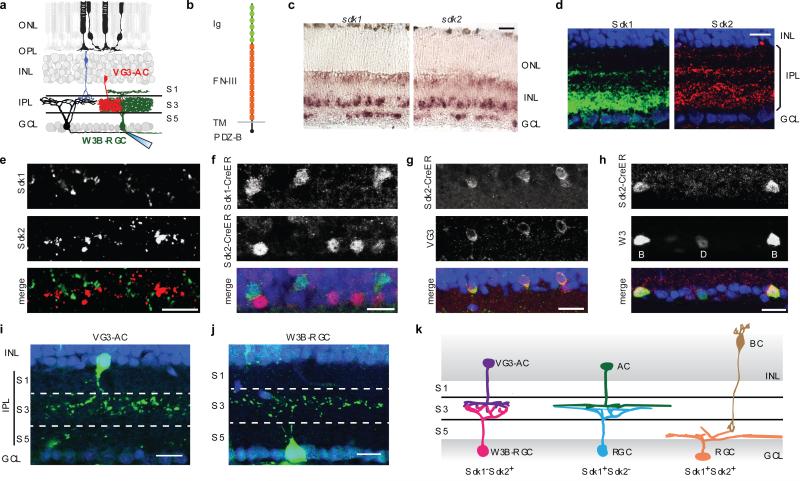
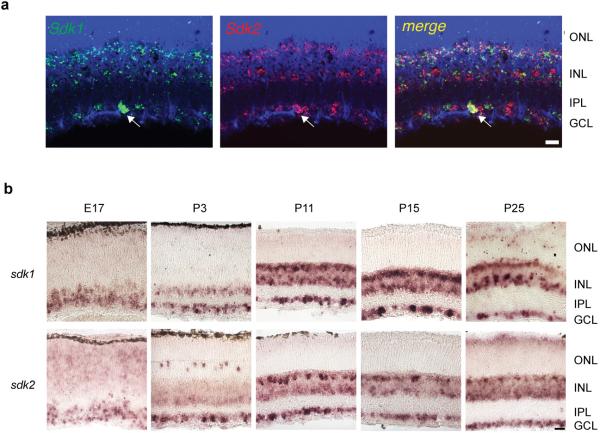
In situ hybridization revealed that both sdk1 and sdk2 were expressed in subsets of mouse retinal neurons (Fig. 1a-c). Sdk1- and Sdk2-positive cells were largely non-overlapping as shown previously in chicks13,14; however, a double-positive population was also present in mouse (Extended Data Fig. 1a). Expression was evident by embryonic day 17 and persisted into adulthood, spanning the periods of lamina formation and synaptogenesis (Extended Data Fig. 1b). Immunostaining showed that Sdks were concentrated in the synapse-rich IPL (Fig. 1d), presumably owing to their C-terminal synaptic localizing motif15. Sdks were concentrated in two of five strata within the IPL, S3 and S5. Sdk1- and Sdk2-positive puncta in S3 were non-overlapping, consistent with the complementary expression pattern of the genes (Fig. 1e).
Figure 1. Sidekicks are expressed by subsets of retinal neurons.
a. Photoreceptors in the outer nuclear layer (ONL) synapse on bipolar cells. Bipolar (blue), amacrine (red) and retinal ganglion cells (RGCs, black) synapse in the inner plexiform layer (IPL), which is divided into 5 sublaminae (S1-S5). W3B-RGCs are targeted for whole cell recording and interneurons stimulated optogenetically.
b. Structure of Sdks. Ig, immunoglobulin domains; FN-III, fibronectin type III domains; TM, transmembrane domain; PDZ-B, PDZ-binding, synaptic-localizing sequence.
c. Expression of sdk1 and sdk2 in P8 retina assessed by in situ hybridization in retinal cross-sections.
d. Immunohistochemical detection of Sdk1 and Sdk2 at P30.
e. Double-label immunohistochemistry shows non-overlapping Sdk1- and Sdk2-rich puncta in S3.
f. Double-staining for epitope tagged CreER in Sdk1ce/+;Sdk2 ce/+ mouse shows largely non-overlapping expression at P30.
g. VG3-ACs are Sdk2-positive, shown by immunostaining for VG3 and CreER in Sdk2 ce/+ mouse.
h.W3B-RGCs (B) are Sdk2-positive (CreER and YFP double-staining in Sdk2 ce/+;TYW3 mouse). Dimmer W3D-RGCs (D) are Sdk2-negative.
i,j. A VG3-AC (i) and a W3B-RGC (j) imaged in Sdk2 ce/+ mated to a reporter line.
k. Arborization pattern of principal retinal cell types that express sdk1 and sdk2. The amacrine and bipolar cell types (AC, BC) that express Sdk1 remain to be determined. ONL, outer nuclear layer; INL, inner nuclear layer; IPL, inner plexiform layer; GCL, ganglion cell layer. Scale, 10 μm for all panels.
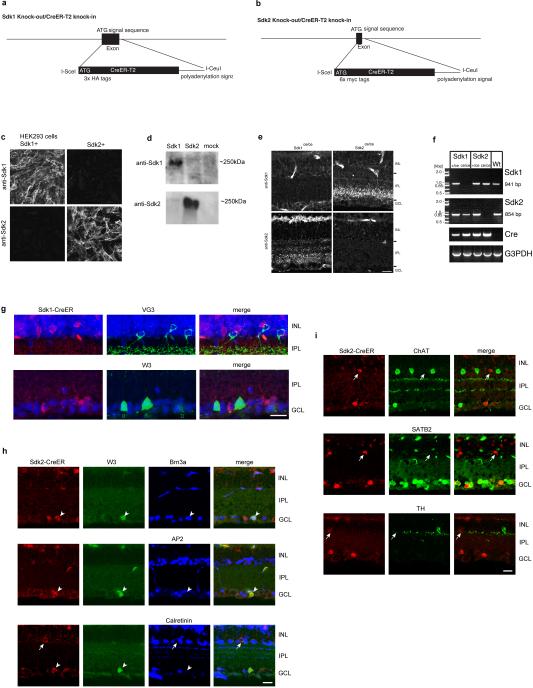
We generated mice in which a ligand-activated Cre recombinase (CreER) fused to distinct epitope tags was targeted to the first coding exon (Sdk1ce and Sdk2ce; Extended Data Fig. 2a-f). Interneurons and RGCs that expressed sdk1 or sdk2, identified using reporter lines or immunostaining, arborized in S3; neurons that expressed both sdk1 and sdk2 arborized in S5. Sdk1−/Sdk2+ RGCs were W3B-RGCs, labeled by YFP in the TYW3 line, which we generated and characterized previously5,6. Another set of morphologically similar RGCs, called W3D, which are dimly labeled in the TYW3 line, expressed neither sdk1 nor sdk2. Most Sdk1−/Sdk2+ interneurons expressed the vesicular glutamate transporter 3, encoded by slc17a8 (refs.16-18); we call them VG3-ACs. Both W3B-RGCs and VG3-ACs extend dendrites that arborized in S3 (Fig. 1f-k and Extended Data Fig. 2g-i).
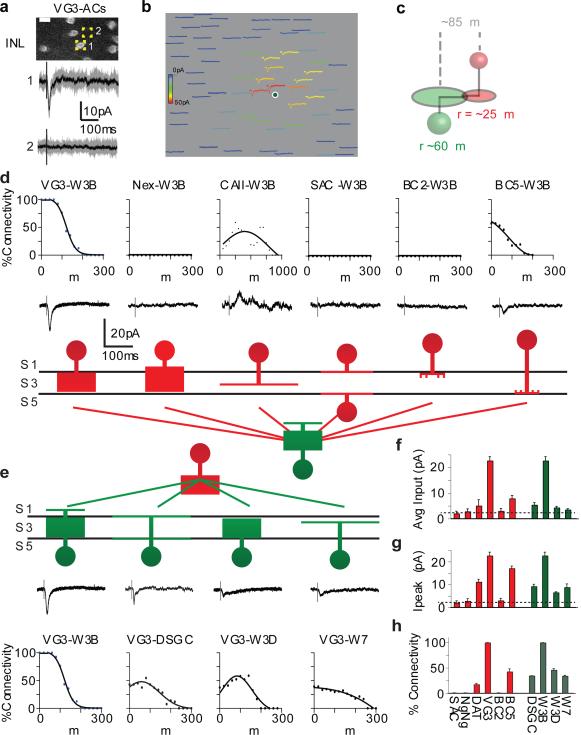
To determine whether VG3-ACs synapse on W3B-RGCs, we implemented an optogenetic strategy (Extended Data Fig. 3). We generated mice5,17 in which VG3-ACs expressed a channelrhodopsin2 (ChR2) fused to a red fluorescent protein and W3B-RGCs were labeled with YFP. We targeted YFP-positive W3B-RGCs in explanted retinas with patch electrodes and activated ChR2 in VG3-ACs using 2-photon stimulation. Optogenetic stimulation of individualVG3-ACs evoked reliable postsynaptic currents in W3B-RGCs (Fig. 2a, #1). Displacement of the laser (~10μm) so that it was within the receptive field of the RGC but no longer illuminated a ChR2-expressing cell evoked no stimulus locked current (Fig. 2a, #2). Thus, responses were due to excitation of ChR2 rather than photoreceptors. Additional physiological and pharmacological studies demonstrated that VG3-ACs formed excitatory, glutamatergic connections on RGCs (Extended Data Fig. 4a-c), consistent with recent studies of VGlut3-containing neurons in retina19,20 and other brain areas21
Figure 2. Selective connectivity of VG3-ACs and W3B-RGCs.
a. Current recorded from a W3B-RGC upon optogenetic stimulation of a VG3-AC (1); no current is recorded when the stimulus is displaced by ~10μm (2). Grey traces, 10 trials, black traces, average. Scale bar, 10μm.
b. Currents recorded in W3B-RGCs in response to stimulating 64 VG3-ACs in a 250×200μm enclosing the RGC. Heat map indicates peak strength of connections; position of trace corresponds to position of stimulated VG3-AC soma. Scales are 15μm and 125 msec.
c. Cartoon showing the radii of VG3-AC and W3B-RGC arbors, indicating distance over which overlap occurs.
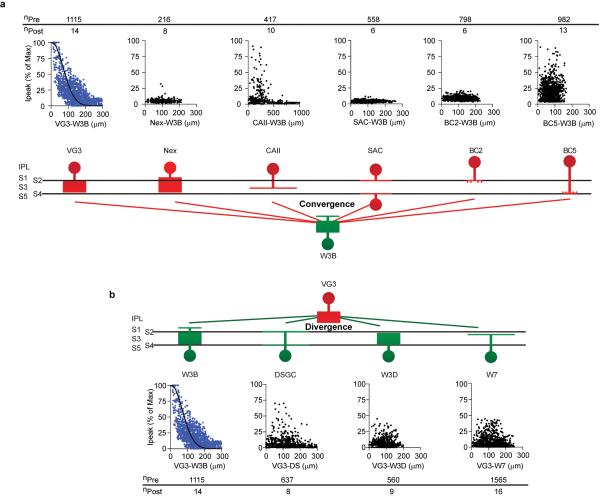
d,e. Strength of connections as a function of distance from 6 interneuron types to W3B-RGCs (d) and from VG3-ACs to 4 RGC types (e). Sample currents shown below each graph. The W7 population contained 6 nearly-disconnected and 10 connected pairs, presumably corresponding to the S1-laminating and S3-laminating W7 subsets. Full data shown in Extended Data Figure 5. Upward currents are inhibitory (Vh ~0mV); downward currents are excitatory (Vh ~−60mV).
f. Average strength of connectivity for pairs shown in d.
g. Strength of connections for pairs in which responses exceeded baseline (dotted line, average noise floor, 2-3pA). Holding potential was −70mV for inward currents and −10 mV for outward currents.
h. Percent of connected pairs for VG3-AC to RGC recordings and interneuron to W3B-RGC recordings averaged over 100μm radius from the postsynaptic RGC. Full data and n values for f-h are shown in Extended Data Figure 5. Error bars in f-h indicate +/− SEM
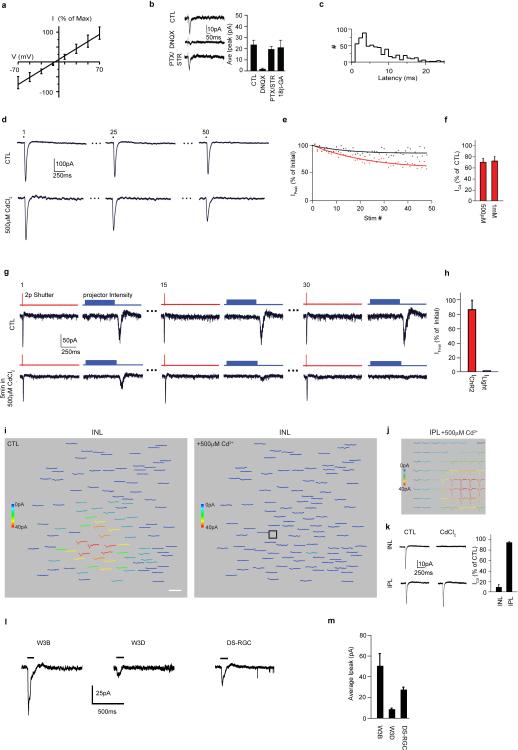
We devised a test to determine whether the VG3-AC – W3B-RGC connection was monosynaptic. Although the light-activated ion channel ChR2 is highly calcium permeable, we found that it is insensitive to CdCl2, a blocker of endogenous voltage-activated calcium channels in nerve terminals (Extended Data Fig. 4d-h). Thus, in the presence of CdCl2, neurotransmitter can be released only from ChR2-positive terminals. Synaptic currents elicited by activating terminal arbors of ChR2-expressing VG3-ACs persisted in the presence of CdCl2 (Extended Data Fig. 4i-k). Gap junction blockers had no effect on these currents, ruling out the possibility that calcium entering through ChR2 in VG3-ACs permeated gap junctions to electrically coupled glutamatergic bipolar cells, which then synapsed on W3B-RGCs (Extended Data Figure 4b). Together these results demonstrate that VG3-ACs form synapses directly on W3B-RGCs.
To assess convergence of VG3-ACs onto W3B-RGCs, we recorded from W3B-RGCs while stimulating 60-200 VG3-ACs within 200μm of their somata. All VG3-ACs and W3B-RGCs separated by ≤100μm were connected, with the strength of the connection inversely proportional to the distance between them (Fig. 2b). Because the radii of VG3-ACs and W3B-RGCs dendritic arbors are ~60μm and ~30μm, respectively5,17,19,20 we conclude that VG3-ACs are functionally connected to W3B-RGCs whenever their dendrites overlap (Fig. 2c).
The strong connectivity of VG3-ACs to W3B-RGCs could be a simple consequence of the overlap of their arbors22-24, as predicted by “Peters’ Rule”, which posits that connectivity is proportional to the proximity of pre- and poststynaptic arbors22-25. To test this idea, we measured the connectivity of VG3-ACs to four Sdk2-negative RGC types for which we had marker lines, W3D-RGCs, W7-RGCs, and two types of ON-OFF direction-selective RGCs (ooDSGCs); W3D-RGC and W7-RGC dendrites intermingle with W3B-RGCs and ooDSGC dendrites straddle those of W3B-RGCs. Optogenetic stimulation of VG3-ACs elicited excitatory postsynaptic currents from W3D-RGCs, W7-RGCs and ooDSGCs that were qualitatively similar to, but only ~10% as strong as those in W3B-RGCs (Fig. 2e,f and Extended Figure 5). The weakness resulted from a 2-fold decrease in the fraction of pairs that were detectably connected, and a 5-fold decrease in the peak synaptic currents for connected pairs (Fig. 2g,h). We also assayed input to W3B-RGCs from six other types of interneurons that arborize in or at the border of S3. In all cases, connectivity was many-fold lower than that between VG3-ACs and W3B-RGCs (Fig. 2dh). Together, these data demonstrate that Peters’ Rule is insufficient to explain patterns of connectivity in the neuropil of the retina.
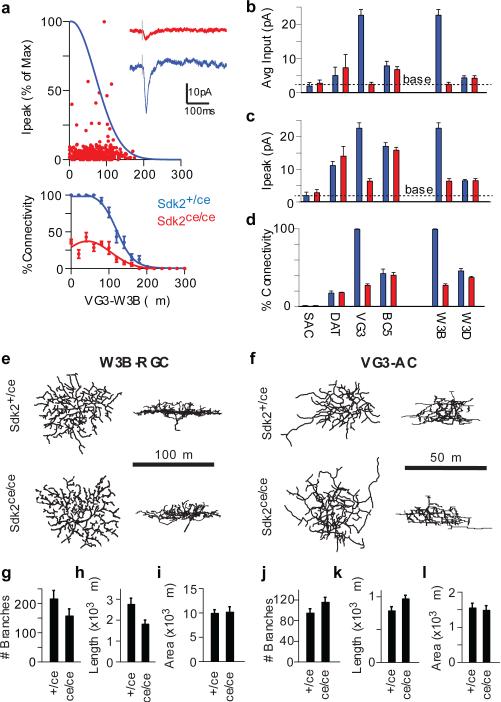
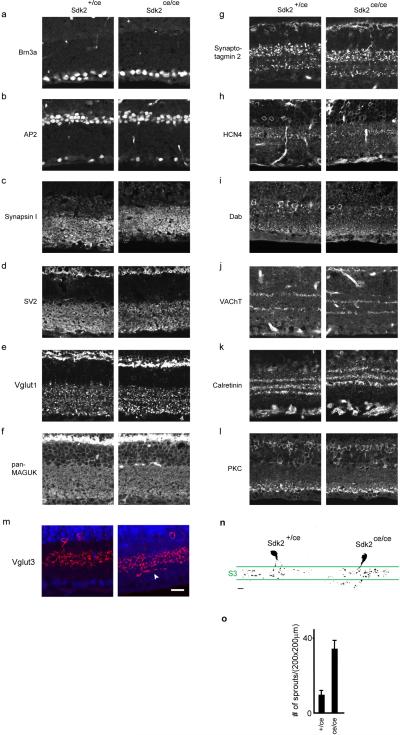
To ask whether Sdk2 plays a role in establishment of the strong VG3-ACs to W3B-RGC connection, we used the Sdk2ce line, in which insertion of CreER generates a sdk2 null allele (Extended Data Fig. 2). Sdk2ce/ce mice are viable, fertile and exhibit no external deficits. We detected no alterations in retinal structure or in the numbers or positions of any cell types examined (Extended Data Fig. 6). However, physiological analysis revealed a 20-fold reduction in the strength of synaptic connections between VG3-ACs and W3B-RGCs (Fig. 3a-d). Thus, Sdk2 is required for the selective connectivity of VG3-ACs to W3B-RGCs.
Figure 3. Decreased synaptic connectivity in Sdk2 mutants.
a. Strength of connections from VG3-ACs to W3B-RGCs in Sdk2 ce/ce mutants, derived from 557 VG3-ACs and 12 W3B-RGCs. Fit to the control data (Extended Data Fig. 5a) re-plotted in blue. Inset, VG3-AC-evoked currents recorded from a W3B-RGC in Sdk2ce/ce and Sdk2ce/+ retina (f).
b-d. Synaptic connectivity in Sdk2 ce/ce mutants and those in controls. Graphs show total strength of connections (b), strength of connections for pairs in which responses exceeded baseline(c, dotted line) and percent of connected pairs (d). Full data shown in Extended Data Figure 8.
e-f,. En face and laminar projections of skeletonized dendritic arbors from dye-filled W3B-RGCs (e) or VG3-ACs labeled sparsely with tdTomato in Sdk2+/ce and Sdk2ce/ce retinae (f).
g,h,i. Average branch number, branch length, and dendritic field area for W3B-RGC in Sdk2ce/ce and Sdk2ce/+ retina. Data from 14 W3B-RGCs in 8 Sdk2+/ce mice and 11 W3B-RGCs in 9 Sdk2ce/ce mice.
j-l. Similar to g-i, except for 9 VG3-ACs in 6 Sdk2+/ce mice and 10 VG3-ACs in 8 Sdk2ce/ce mice. . Scale, 25μm. Error bars in b-d and g-l indicate +/− SEM
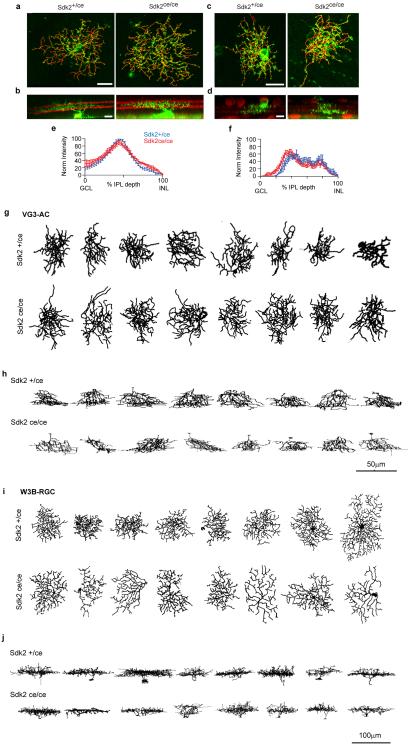
We sought morphological correlates of the synaptic disruption observed in Sdk2 mutants. To this end, we imaged single VG3-ACs and W3B-RGCs labeled in a transgenic line or by dye injection. The size, shape and laminar restriction of VG3-AC and W3B-RGC arbors were generally normal in Sdk2ce/ce mice (Fig. 3e,f). However, branch number and length were modestly reduced in mutant W3B-RGCs and modestly increased in VG3-ACs; in both cell types, some branches extended beyond the normal termination zone (Fig. 3g-l and Extended Data Fig. 6m-o and 7). Defects in laminar restriction were similar to, though less striking than those observed in chick retina following micro-RNA mediated attenuation of Sdk213. In chicks, sdk2 expression was decreased in isolated cells in a wild-type background; we speculate that this led to competition between normal and mutant neurons resulting in more striking defects than observed in the null mutant.
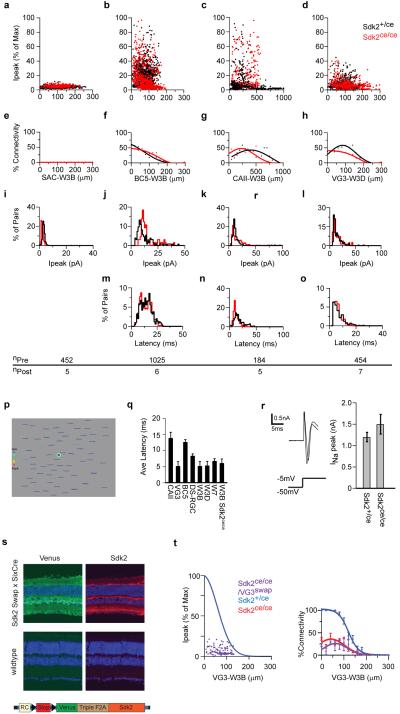
The result that Sdk2-positive neurons connect more strongly to each other than to Sdk2-negative partners is consistent with the finding that Sdks are homophilic adhesion molecules12,13. If this is true, defects should be observed only at synapses in which both partners express sdk2. To test this idea, we asked whether sdk2 deletion affected synapses in which only one partner was Sdk2-positive. Deletion of sdk2 had no effect on the strength of coupling in any of four such cases: connections of sdk2-negative bipolar and amacrine cells to W3B-RGCs and of VG3-ACs to sdk2-negative RGCs (Fig. 3b-d and Extended Data Fig. 8a-r). These results also provide evidence that loss of Sdk2 does not affect the overall properties of VG3-ACs or W3B-RGCs. In addition, we generated mice in which sdk2 could be expressed in a Cre-dependent manner in any cell (Extended Data Fig. 8s). In combination with the Sdk2ce/ce line, this allowed us to selectively restore Sdk2 in VG3-ACs. In this case, connectivity was as low as in Sdk2ce/ce mutants (Fig 3m). Forced expression of sdk2 in these cells increased their connectivity to W3B-RGCs (Fig. 3n). Together, these results support the idea that Sdk2 promotes connectivity by a homophilic mechanism.
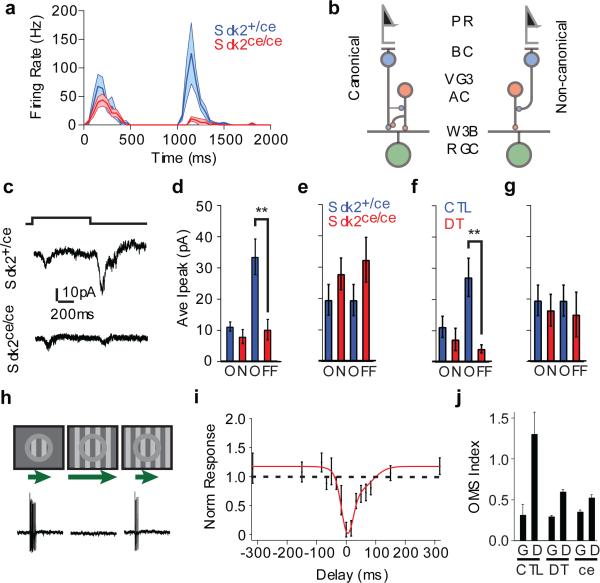
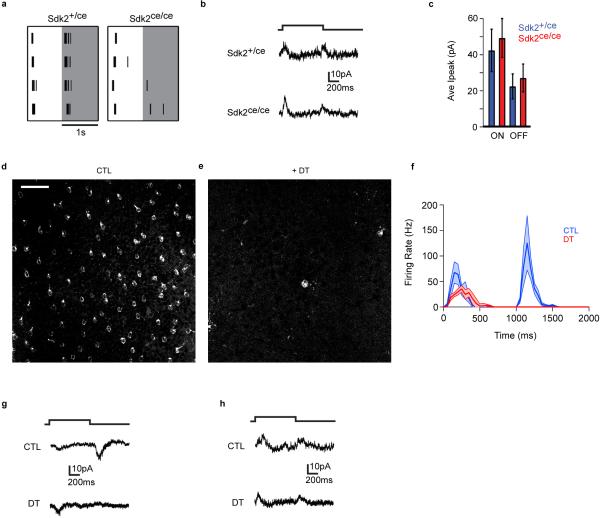
We next asked what role the Sdk2-specified VG3-AC to W3B-RGC connection plays in the function of W3B-RGCs. To this end, we recorded responses of W3B-RGCs to visual rather than optogenetic stimulation. As reported previously5,6,20, a bright spot flashed over the dendritic arbor (the receptive field center) of control W3B-RGCs elicited a burst of action potentials at both the onset and the offset of the light, with the OFF response substantially larger than the ON response. In Sdk2ce/ce mice, the ON response persisted but the OFF response was nearly abolished (Fig. 4a and Extended Data Fig. 9a). This result was unexpected, because input from amacrine cells generally modulates RGC responses but does not generate them3. To ask whether this phenotype resulted from decreased excitation or enhanced inhibition, we recorded synaptic currents in response to the same stimulus. Consistent with results from the voltage recording, a flashing spot elicited excitatory currents at both light onset and offset, with OFF currents larger than ON currents; in Sdk2 mutants, the OFF current was abolished while the ON current was little affected (Fig. 4c,d). In contrast, inhibitory currents evoked in W3B-RGCs by full-field stimulation, presumably derived from conventional amacrine cells, were unaffected in Sdk2 mutants (Fig. 4e and Extended Data Fig. 9b). The effect was specific in that light evoked inward currents in neighboring RGCs, such as W3D-RGCs, persisted in Sdk2 mutants (Extended Data Fig. 9c).
Figure 4. Excitatory input reaches W3B-RGCs via VG3-ACs.
a. Average firing rate recorded from W3B-RGCs in Sdk2ce/+ (blue, n = 21) and Sdk2ce/ce (red, n = 10) retinae in response to a small spot flashed for 1s. Dark lines, average; shadowing denotes SEM. Bin width, 50 msec.
b. Canonical and non-canonical pathways for delivering OFF input to RGCs.
c. Excitatory currents recorded from W3B-RGCs in response to a spot flash (Vh = −65mV).
d. Average peak current (Ipeak) from experiments like c (n=7 W3B-RGCs in 4 Sdk2ce/+ mice and 8 W3B-RGCs in 4 Sdk2ce/ce mice; *p<0.01).
e. Ipeak of inhibitory currents recorded from W3B-RGCs in response to a full field flash (Vh = −5mV) (n=7 W3B-RGCs in 5 mice (4 Sdk2ce/+ mice and 1 CTL mouse pooled) and 5 W3B-RGCs in 4 Sdk2ce/ce mice; *p<0.01).
f. Ipeak of excitatory currents recorded from W3B-RGCs in response to a spot flash (n=5 W3B-RGCs in 3 CTL mice and 11 W3B-RGCs in 5 Vglut3-cre;DTR mice).
g. Ipeak of inhibitory currents recorded from W3B-RGCs in response to a full field flash (n=5 W3B-RGCs in 5 mice (4 Sdk2ce/+ mice and 1 CTL mouse pooled) and 5 DT treated Vglut3-cre;DTR/TYW3 mice).
h. Object motion stimulus-evoked responses in W3B-RGCs. W3B-RGCs spike vigorously to a grating passed over their receptive field center (Local). They are silenced when the moving grating extends to their surround (Global) but not when the center grating leads or lags that in the surround (differential), as quantified in i.
i. Responses measured in W3B in response to a stimulus where the center grating began its movement at different times relative to that of the surround. Negative delays are when the center led the surround. Responses were normalized to those evoked by a center grating alone (n =7 W3B RGCs).
j. Responses measured in W3B-RGCs to global (G) and differential (D) motion stimuli normalized to that elicited in control (CTL) W3B-RGCs with local motion stimuli. (n=10 W3B-RGCs in 5 CTL mice, 6 W3B-RGCs in 4 Sdk2ce/ce mice and 9 W3B-RGCs in 3 DT treated Vglut3-cre;DTR/TYW3 mice). Error bars in e-g, i, j indicate +/− SEM
The effect we observed could have resulted from defects in other Sdk2-expressing retinal cells (Fig. 1k), or compensatory alterations during development. To test these possibilities, we selectively ablated mature VG3-ACs. We expressed diphtheria toxin receptor in VG3-ACs, injected diphtheria toxin in adult animals, recorded from W3B-RGC~10 days after injection, and verified loss of VG3-ACs following recording (Extended Data Fig. 9d-e). Ablation of VG3-ACs in adulthood led to even greater loss of light-evoked excitatory OFF responses than observed following global deletion of sdk2; inhibitory responses in W3B-RGCs and excitatory responses in nearby RGCs were unaffected (Fig.4e,g and Extended Data Fig. 9f-h; also see ref.20). Together, these results lead to the conclusion that visual input are delivered to W3-RGCs in an unusual way: while bipolar cells synapse directly on most RGCs (ref. 3), W3B-RGCs receive OFF input indirectly via VG3-ACs (Fig. 4b). The small, statistically insignificant decrease in the ON response may reflect the presence of other ON inputs that compensate for loss of that normally supplied by VG3-ACs.
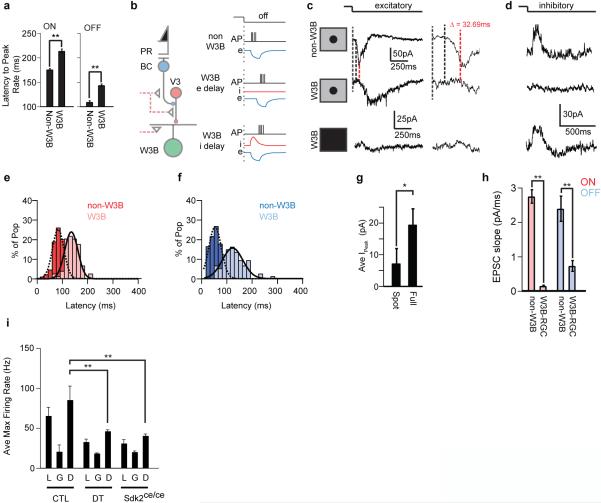
Speed is of the essence for visual perception, so it seems odd to interpose an extra synapse between photoreceptors and W3B-RGCs. Why might this be useful? A clue comes from the fact that W3B-RGCs compare motion in the center and surround of the receptive field, firing only when the two are asynchronous5-7 (Fig. 4h,i). For the comparison to be temporally precise, input from the surround must arrive at the cell rapidly and/or input from the center must be delayed. Previous studies5,7 show that spiking amacrine cells convey rapid inhibition to object motion sensing RGCs including W3B-RGCs. We find that in addition, currents elicited by stimulation of the receptive field center are delayed in W3B-RGCs relative to other RGCs (Extended Data Figure 10). We speculate that the interposition of VG3-ACs between bipolar cells and W3B-RGCs contributes to this delay, though it cannot explain it entirely. In addition, VG3-ACs themselves are tuned to differential motion20, presumably accounting for much of the tuned excitatory input that W3B-RGCs receive6. Consistent with this interpretation, the ability of W3B-RGCs to distinguish local from global motion is dramatically reduced in Sdk2 mutants or following elimination of VG3-ACs, as evidenced by a reduction in spike rate relative to control for local and differential motion. (Fig. 4j and Extended Data Fig. 10i).
In summary, the recognition molecule Sdk2 is required for the selective and strong connectivity between Sdk2-positive VG3-ACs and W3B-RGCs. Connections of VG3-ACs or W3B-RGCs with proximate but Sdk2-negative partners are substantially weaker. Because Sdk2 is localized at synapses and required in both partners, we speculate that it acts homophilically to promote appropriate connections. In its absence, close contacts fail to form or are not maintained, leading to dramatically decreased synaptic strength.
Taken together with previous studies, our data support a multi-step model for synaptic specificity in the IPL. First, one set of recognition molecules, including cadherins and plexins, direct arbors to appropriate sublaminae26,27. Within sublaminae, proximate partners connect at low levels, consistent with Peters’ Rule22-25. Finally, recognition molecules such as Sdks, and perhaps other immunoglobulin superfamily adhesion molecules28,29, act to bias connectivity in favor of specific pairings..
Our results also reveal a role of the VG3-AC – W3B-RGC synapse in visual function. In canonical retinal circuits, bipolar cells relay visual input from photoreceptors to RGCs, whereas amacrine cells, which have been presumed to be inhibitory, modulate this input3 (Fig. 4b). In contrast, VG3-ACs provide the main excitatory drive to the W3B-RGCs. Thus, the VG3-AC – W3B-RGC synapse is a component of a non-canonical retinal circuit in which some of the visual input is relayed to W3B-RGCs through VG3-ACs rather than arriving directly through bipolar cells. This seemingly cumbersome arrangement could improve the sensitivity of W3B-RGCs to the visual features that best excite them – motion of small objects against a background that moves in a trajectory distinct from that of its background5.
METHODS
Animals
We modified a lambda phage-mediated recombineering method30 to generate sdk1 and sdk2 targeting vectors in which the first coding exons of the sdk1 and sdk2 genes were replaced by an epitope-tagged CreER-T2 recombinase cDNA. Tags were 3 tandem copies of the HA tag (amino acid sequence YPYDVPDYA) for Sdk1 and 6 tandem copies of the myc tag (amino acid sequence EQKLISEEDL) for Sdk2. Loci were modified by homologous combination in V6.5 embryonic stem (ES) cells, and chimeras were produced by the Harvard University Genome Modification Facility. High percentage chimeras transmitting the knock-in alleles were bred to animals expressing FLP recombinase from the beta-actin promoter31 to remove the SV40-NEO cassette.
Thy1-STOP-YFP, TYW3, TYW7, TYW9, Kcng4-cre and Neto1-cre mice were generated in our laboratory. Thy1-STOP-YFP expresses YFP following excision of a stop cassette by Cre recombinase32. TYW3, mice express YFP in subsets of RGCs5. TYW7 mice express YFP in two types of RGCs, which are present at similar densities; one has its dendrites in the distal half of S3; the other has its dendrites in S1. TYW9 mice express YFP in ooDSGCs that prefer nasal motion33. Neto1-cre and Kcng4-cre mice express cre recombinase in Type 2 and Type 5 bipolar cells respectively, as well as in subsets of RGCs26,34. Nex-cre mice, in which cre is targeted to the endogenous NeuroD6 locus35, were obtained from K. Nave via L. Reichardt (UCSF); this line expresses Cre in nGnG and SEG amacrine cells36. DAT-cre mice, in which cre is targeted to the endogenous DAT locus were obtained from X. Zhuang (Chicago)37 via V. Murthy (Harvard); this line expresses cre in Type II catecholaminergic amacrine cells. ChAT-cre, in which the Cre recombinase gene was targeted to the endogenous ChAT gene, was obtained from Jackson Laboratories38; this line expresses cre in starburst amacrine cells. Hb9-GFP transgenic mice, which express GFP in ooDSGCs that prefer nasal motion39, were obtained from K. Eggan (Harvard). Rosa-CAG-Lox-STOP-LOX-ChR2(H134R)-tdTomato mice (Ai27),which express channelrhodopsin following excision of a stop cassette by Cre recombinase40 were provided by H. Zeng (AIBS, Seattle). Rosa-CAG-LOX-STOP-LOX-DTR mice, which express diphtheria toxin receptor following excision of a stop cassette by Cre recombinase, were obtained from Jackson Laboratories41. The Rosa-CAGS-LOX-CHERRY-LOX-GFP line was from S. Dymecki (Harvard University)42. Six3-cre43 were provided by W. Klein (M.D. Anderson Cancer Center).
To enable expression of Sdk2 under Cre-dependent control, we generated a line using a previously described strategy44,45. A cassette encoding Venus and Sdk2, separated by tripleF2A (3 tandem repeats of foot-and-mouth disease 2A peptide sequence) was cloned into a Rosa26CAG-STOP- targeting vector to generate Rosa-CAG-LOX-STOP-LOX-Venus-3F2A-Sidekick2-WPRE-FRT-neo-FRT. Homologous recombinants were selected in the V6.5 ES cell line and chimeras were generated. Germ-line chimeras were crossed to a Flp mouse31 to obtain germ-line transmissions and to remove the FRT-neo-FRT sequence.
Animals were used in accordance with NIH guidelines and protocols approved by Institutional Animal Use and Care Committee at Harvard University. Mice were maintained on a C57/B6J background. Both male and female mice were used in this study. Animals were 40 to 100 days old at the time of euthanasia unless otherwise stated in the text or figure legend. Genotypes of mice were known to investigators at the time of the experiment, and there was no randomization in assignment of animals for specific experiments.
RT-PCR
RNAs were prepared from brains of wildtype or knock-out mice using EZNA Total RNA kit I (OMEGA bio-tek, Norcross, GA), reverse-transcribed by SuperScript III (Life Technologies), and amplified using Taq DNA polymerase (EconoTaq PLUS, Lucigen) with these gene-specific PCR primers.
Sdk1 forward: TGAACGGTCTTCTGCAAGGCTACA
Sdk1 reverse: AAGGGTCAGCTCAGAGGCAGATTT
Sdk2 forward: TTCTGGCTGGTAGAAGGCAACTCA
Sdk2 reverse: AGGATGCCGTTGATCTTGTCCTCA
Cre forward: GCATTACCGGTCGATGCAACGAGTGATGAG
Cre reverse: GAGTGAACGAACCTGGTCGAAATCAGTGCG
G3PDH forward:TGAAGGTCGGTGTGAACGGATTTGGC
G3PDH reverse:CATGTAGGCCATGAGGTCCACCAC
Histology
Mice were euthanized by intraperitoneal injection of pentobarbital and either enucleated immediately or transcardially perfused with Ringer's solution followed by 4% (w/v) paraformaldehyde (PFA) in PBS. Eye cups were removed and fixed in 4% (w/v) PFA in PBS on ice overnight, sunk in 30% (w/v) sucrose/PBS, and mounted in the OCT compound. Immunostaining of cryosections was carried out as described previously14,44. For double immunostaining with two different mouse antibodies, we used the Zenon Horseradish Peroxidase Mouse IgG1 Labeling Kit (Life Technologies, Grand Island, NY) to label one of them, and detected reaction product with TSA-Plus kits (Perkin-Elmer Life Sciences, Waltham, MA). For immunodetection of epitope-tagged CreER, cryosections were permeabilized in absolute methanol at −20°C for overnight, treated with Image-iT FX signal enhancer (Life Technologies) as instructed by the manufacturer's protocol, and blocked with 5%(w/v) skim milk (BioRad, Hercules, CA) in PBS for 30 min at room temperature. The antibodies were diluted in Renoir Red diluent (BioCare Medical, Concord, CA), incubated at 4°C for 48 hours, rinsed, and detected with secondary antibodies which had been preabsorbed with acetone powders prepared from mouse brain. In some cases, animals were injected twice with 1 mg tamoxifen (Sigma, St. Louis, MO) in 0.1 ml sunflower oil at 24 and 48 hours prior to sacrifice, resulting in a higher concentration of CreER in the nucleus, which enhanced our ability to detect it.
To label single VG3-ACs and W3B-RGCs, retinae containing dye-filled W3B-RGCs or sparsely labeled VG3-ACs were fixed in 4% PFA at 4 degrees for 1hr and then incubated in primary antibodies dissolved in blocking solution (PBS + 0.3% Triton-X-100 + 3% donkey serum; Jackson Immunoresearch) for 7-10 days at 4 °C with agitation. Next, retinae were washed for 3-5hrs in 3-5 changes of PBS and incubated with secondary antibodies overnight at 4 °C with agitation. After 3-5 hrs of washing in PBS with agitation, retinae were flattened onto nitrocellulose membranes (Millipore) and mounted on slides (Vectashield, Vector Labs).
To generate antibodies to mouse Sdk1 and Sdk2, ~100 amino acid-long stretches of the intracellular domains were selected in a region where the two molecules maximally differ in amino acid sequence. cDNAs encoding these fragments fused to a poly-histidine tags were inserted into a pET vector (Novagen, Madison, WI). Fusion proteins were produced in BL21 bacteria and purified using a His-column (Life Technologies). Animals were immunized and antisera produced by Covance Research. Antibodies were affinity purified using the antigen fusion proteins as bait. We also generated mouse polyclonal antibodies to mouse Sdk1 and Sdk2 by immunizing Sdk1 and Sdk2 knock-out mice with L cells (ATCC, Manassas, VA) that had been transfected with full length mouse Sdk1 or Sdk2 cDNA as described previously28. Antibodies were tested on sdk1 and sdk2 expressing HEK cells (HEK-293T; ATCC) and on retinal tissue from Sdk1ce/ce and Sdk2ce/ce mice to verify specificity.
Antibodies used in this study were: rabbit monoclonal antibody to estrogen receptor alpha (Clone SP1, from Epitomics or Abcam, Cambridge, MA); goat anti-Myc (NB600-335, from Novus, Littleton, CO); rat anti-HA (3F10, from Roche Diagnostics Co., Indianapolis, IN); anti-Brn3a (clone, 5A3.2), rabbit anti-synapsin I (AB1543P), mouse anti-calretinin (clone, 6B8.2), goat anti-ChAT antibodies, and sheep anti-tyrosine hydroxylase from Millipore (Billerica, MA); AP2 (clone, 3B5), SV2, anti-synaptotagmin 2 (clone, ZNP1) from Developmental Studies Hybridoma Bank (Iowa City, IA); mouse anti-VGlut1 (clone, N28/9), mouse anti-pan-MAGUK (clone, N28/86), mouse anti-HCN4 (clone, N114.10), and mouse anti-Vesicular acetylcholine transporter (clone, N6/38) from NeuroMab (Davis, CA); mouse anti-SATB2 (clone, 4B19) from Abcam; rabbit anti-fluorescein (Life Technologies); and rabbit anti-protein kinase C alpha (P4334) from Sigma. Rabbit antibody to Dab1 was a kind gift from Dr. Brian Howell at SUNY Upstate (Syracuse, NY). Rabbit anti-Lucifer Yellow and anti-Fluorescein were from Invitrogen. Chicken anti-GFP and rabbit anti-mCherry were generated as described previously42,44. Nuclei were labeled with NeuroTrace Nissl 435 (Life Technologies). Secondary antibodies were conjugated to DyLight 488, DyLight 594, or Alexa 647 (Jackson ImmunoResearch, West Grove, PA).
For in situ hybridization, riboprobes were synthesized from Sdk1 or Sdk2 cDNAs using digoxigenin- or fluorescein-labeled UTP and hydrolyzed to around 500bp as described in ref. 13,15. Probes were detected using anti-digoxigenin antibodies conjugated to alkaline phosphatase, followed by reaction with BCIP (5-bromo-4-chloro-3-indolyl phosphate) and NBT (nitroblue tretrazolium) substrate for 24-36hrs; or using anti-digoxigenin and anti-fluorescein antibodies conjugated to horseradish peroxidase, followed by amplification with tyramide conjugates (TSA-Plus system; Perkin-Elmer Life Sciences).
Imaging
Images of immunostained retinal wholemounts were acquired on a LSM 710 confocal microscope using a 63× water immersion objective. Images were acquired at a resolution of 1024×1024pixels with a step size of 0.2-0.5mm. ImageJ was used to generate maximum intensity projections of singly labeled neurons and skeletonized dendrites in the x-y and x-z planes.
Image stacks were registered using stackreg (ImageJ). Images of single VG3-ACs and W3B-RGCs taken from P30-40 retinae were skeletonized manually through the z-stack using simple neurite tracer (ImageJ). Path ROIs describing neuronal processes were converted to stacks and analyzed for morphological properties using the Trees toolbox47. We measured the projection depth of VG3-ACs and W3B-RGCs by taking the z-axis intensity profile of labeled neurons and plotted this profile as a % of IPL depth. IPL depth in turn was defined by ChAT or VAChT-counterstained somas which label starburst amacrine cells in the GCL and IPL.
Channelrhodopsin Excitation
ChR2-tdTomato-positive interneurons were first imaged at low power (2-4mW sample plane power at 960nm) and a stack of their cell body positions was acquired. Somata were highlighted as regions of interest (ROIs) until all available interneurons were marked within the stack (typically 250×200×4μm). Custom software written in LabView (National Instruments) used these ROIs to steer the beam to soma locations and activate ChR2 using either raster or spiral scan trajectories (~25-30mW sample plane power at 920nm). Dwell times in these scan patterns were 0.02-0.05ms/pixel, which was less than the rise time of the current produced by a stationary spot (Extended Data Fig. 3c,g-j). Pixel size was 0.6μm2 and scan patterns typically contained 100 pixels with their total time synchronized to the laser shutter, which opened for 2ms.
We arrived at these parameters by measuring the kinetics of ChR2 responses on HEK cells and retinal neurons that expressed ChR2(H134R) (Extended Data Fig. 3). Our goal was to scan interneuron somas (typically 10×10pixels in size) and activate them with a current step that would imitate the square current pulses used when stimulating interneurons via a sharp electrode47. Responses in ChR2-expressing HEK cells elicited by a stationary spot of IR laser light at a range of wavelengths between 800-960nm (840nm,860nm and 920nm are shown in Extended Data Fig. 3b,c) led us to conclude that 920nm would be a good compromise between response size, rise time and sample plane power. Currents typically had <2ms rise times (10- 90%) with peak amplitudes of 150-175pA at 25mW sample plane power (Extended Data Fig. 3a). Increasing stimulus duration beyond 2-3ms produced no increase in peak amplitude and instead the response showed signs of desensitization49-51 (Extended Data Fig. 3a). Taken together, these results would suggest that responses evoked by 920nm light would saturate at dwell times greater than 2ms/pixel.
Next, we measured the spatial dimension of 2p laser stimulation of ChR2. To do this, we recorded from ChR2 expressing HEK cells while (1) stimulating the HEK cell at different positions away from the edge of the cell membrane (Extended Data Fig. 3d) or (2) stimulating the HEK cell at different heights beginning at the cell membrane (Extended Data Fig. 3f). Taken together these results indicate that at our “ChR2” PSF has XYZ dimensions of 3×3×5μm. Next, we recorded from ChR2-positive RGCs or SACs, highlighted their somas with ROIs and steered the beam through these ROIs in raster or spiral scan trajectories at different dwell times to produce currents of 250-350pA with <2ms rise times (Extended Data Fig 3g-j). Empirically, this dwell time tended to be 0.02-0.05ms. Currents were similar at both dwell times. Finally, we determined the relationship between inward currents on W3B to stimulation of VG3-ACs at different sample plane powers. This experiment revealed a classical sigmoid relationship between the size of the postsynaptic response and the strength of the stimulus (power at the sample plane) delivered to VG3-ACs consistent with calcium dependence of transmitter release52 (Extended Data Fig. 3l). Sample plane powers used in our analysis of connectivity (25-30mW) sit on the plateau of this curve and are 4-6 times the power levels that evoke a minimal response. We observed signs of IR-light induced damage on cultured cells as well as retinal tissue at sample plane powers greater than 40mW.
Under the conditions we used, photoreceptor-evoked light responses on RGCs were rarely seen. To confirm this independence, we activated ChR2 and photoreceptors independently and observed distinctly different kinetics26 (Extended Data Figure 4g). These data establish that our functional connectivity measurements are not contaminated by light responses. Nevertheless, we avoided exposure times of >100ms due to a well described relationship between exposure time and IR evoked light responses52. Even in these cases, however ChR2-positive interneuron-evoked responses were clearly distinguishable from light responses due to the significant differences in their latencies (>50ms for light responses).
For experiments in which we activated ChR2 with blue light, we incubated the retina in a cocktail of blockers as described in ref 19. ((S)-1-(2-Amino-2-carboxyethyl)-3-(2-carboxy-5-phenylthiophene-3-yl-methyl)-5-methylpyrimidine-2,4-dione,ACET53, 10mM, Tocris ; L-(+)-2-Amino-4-phosphonobutyric acid, L-AP4, 20mM, Tocris; Hexamethonium, 300mM, Sigma). To activate ChR2, we focused light from a 500mW 470nm LED (Thor Labs) onto the retina using a relay lens and a 5× objective. LED activation was synchronized to the recordings similar to above for 2p recordings.
Electrophysiology
Mice were dark adapted for at least 2hrs prior to euthanasia. The retina was rapidly dissected under infrared illumination into oxygenated (95% O2; 5% CO2) Ames solution (Sigma), then placed in a recording chamber with RGCs facing up. Labeled neurons were imaged under two-photon illumination and targeted for recording. For cell-attached recordings, the patch electrodes (4-7MΩ) were filled with Ames solution. For whole cell recordings, the electrodes were filled with an internal solution containing 120mM KAc, 10mM NaAc, 0.2mM CaCl2, 1mM MgCl2, 10mM EGTA, 2mM NaATP, 0.3mM MgGTP, 5mM KCl and 10mM HEPES. Fluorescein 3000MW dextran (Invitrogen) was also added to the internal solution to make the electrode visible under two-photon illumination. The chloride reversal potential under these conditions is ~−70mV, allowing good separation of inhibitory and excitatory currents in whole-cell mode. For excitatory currents holding potential (Vh) was ~−70mV (ECl) and for inhibitory currents Vh was ~−10mV (Eglutamate); these values were determined for each cell with a voltage ramp stimulus. Only cells with a Vm more negative than −50mV and series resistances of less than 25MΩ were used in this study. 2,3-Dioxo-6-nitro-1,2,3,4-tetrahydrobenzo[f] quinoxaline-7-sulfonamide (NBQX, 40μM, Tocris), picrotoxin (PTX, 100μM, Tocris), strychnine (STR, 3μM, Tocris) and cadmium chloride (CdCl2, Sigma) were dissolved in Ames. Following recording, retinas were processed for histology (see above) and immunostained with antibodies against fluorescein to visualize RGC morphologies.
Signals from loose-patch and whole-cell recordings were acquired with a MultiClamp 700B amplifier (Molecular Devices) and with custom software written in LabView. For spikes, Multiclamp was put into I=0 mode and signals were high pass filtered at 1Hz. For currents, signals were digitized at 20kHz, low-pass filtered at 3kHz and high-pass filtered at 0.1Hz. Series resistance for all recordings was not compensated.
Currents were processed by custom software written in Matlab (Simulink) and were analyzed as follows: First, currents averaged from ~10 stimulus repetitions were split into those that evoked currents (connected) and those that did not (disconnected) in a partially automated way using the following criteria: (1) Averaged traces had to have peak currents that were one standard deviation above the pre-stimulus average baseline. (2) The variance about the mean current had to be <15% to confirm that stimulus locked currents were present in each individual trial. Once categorization was complete, traces were analyzed for their rise times, decay times, onset latency, and sizes. These measurements were then remapped to the stimulated interneuron's position. Graphs of these processed values were plotted in Igor Pro (Wavemetrics), saved as image files and inserted into figure layouts using Adobe Illustrator. A similar classification procedure was used for analysis of light evoked currents. Data from Sdk2ce/+ and Sdk2+/+ mice were pooled for analysis.
Visual Stimuli
Visual stimuli were delivered via a projector as described in ref. 26. Briefly, all visual stimuli were written in Matlab using the psychophysics toolbox and displayed on the projector with a background intensity set to 1×10⁴ R*/rod/s.
The ON receptive field is larger than the OFF receptive field in W3B-RGCs6 and slightly off-center spots can bias the relative sizes of ON and OFF inward currents. To ensure that this innate feature of W3B-RGCs did not influence our measurements of ON and OFF current sizes we delivered white noise stimuli to W3B RGC while recording inward currents. Next, we reverse correlated these currents to the stimuli and created an average that described the receptive field center. These receptive fields were used as stimuli to measure the sizes of ON and OFF inward currents. Currents in wild-type animals had a canonical shape and showed that the peak OFF-current is typically 4-8 times larger than ON current (Fig. 4).
For our differential motion stimulus, we first mapped the W3B-RGCs receptive field using a grid of flashing spots and measured spikes in I=0 mode. Next, we centered a circular object region (100-150μm) over the receptive field, bounded it with a grey annulus (50-70μm) and created a background region that extended from the annulus to edge of our projected image. Differential motion stimuli were constructed as previously reported6-8 and consisted of bars of 40-72μm in width that alternated in intensity about our adapting grey level and moved at a speed of 100μm/sec, for a single bar width. For local motion, bars were passed within the object region while the background was set to grey. For global motion, bars were passed over the object and background regions. For differential motion, we passed bars over the full field but moved them in the object region at the following times before or after bars movement in the background: 333.33ms, 166.67ms, 100ms, 83.3ms, 66.67ms, 50ms, 33.33ms, 16.67ms, 0ms (Figure 6l). These correspond to a difference of 20, 10, 5, 4, 3, 2, 1 and 0 frames of our 60 Hz projector. Responses at these different timings were collected and normalized to the response obtained under local motion only. W3B-RGCs are strongly silenced by activation of their surround and as a result do not fire when bar movement in the two regions were synchronous. The OMS index (Figure 4j) was computed by normalizing the average firing rate in response to differential and global motion to that measured in response to local motion. Average firing rates used for this procedure are shown in Extended Data Figure 10i.
Diphtheria Toxin injection
DT (Sigma, St. Louis, MO) was first dissolved in PBS at 1 mg/ml and then aliquoted at −80°C. Freshly thawed DT aliquot was diluted in PBS and delivered as intraperitoneal injection at 1μg/50g body weight41 to 7-10 week old Vglut3-Cre;R26iDTR;TWY3 mice. The dose was repeated 4 times at 2 d interval. As controls, we injected DT in control animals and saline in VGlut3-cre;R26iDTR;TWY3 animals.
AAV-mediated Gene Transfer
Viral-mediated gene transfer was performed as described in ref. 26. For initial connectivity measurements, adeno-associated virus (AAV) expressing Cre-dependent ChR2-YFP (rAAV2/9-hEF1a-DIO-ChR2 (H134R)-YFP-WPRE, AV-9-20297P, Penn Vector Core) was at a titer of ~1×10¹³ genome copies per ml as described in ref. 26. All of these initial viral-experiments were repeated using the Ai27 line. Similar results were obtained with both methods, and results from both methods were pooled.
Statistical methods
No statistical method was used to predetermine sample size. Data sets were tested for normality and statistical differences were examined using the Student's t-test (Igor Pro). Variance in the estimate of the mean is shown as standard error of the mean (SEM).
Extended Data
Extended data Figure 1. Expression of sdk1 and sdk2 in developing retina.
a. Double-label in situ hybridization for sdk1 and sdk2 at P10. Arrow indicates a retinal ganglion cell that expresses both sdks. Label in INL includes amacrine and bipolar cells, as summarized in Fig. 1K. Other images (not shown) reveal that sdk2 is also expressed by horizontal cells. Scale, 10μm.
b. In situ hybridization for sdk1 and sdk2 RNA at indicated postnatal ages. Scale, 10μm.
Extended data Figure 2. Generation and characterization of Sdk1 and Sdk2 knock-in mice.
a,b. Targeting vectors used to generate Sdkce/ce and Sdk2ce/ce mice.
c. HEK293 cells transfected with expression vectors encoding sdk1 or sdk2, followed by staining with mouse antibodies to Sdk1 and Sdk2.
d. HEK293 cells transfected with expression vectors encoding sdk1 or sdk2, followed by immunoblotting with rabbit polyclonal antibodies to Sdk1 and a mouse monoclonal antibody to Sdk2 (CS22).
e. Retinal sections from P30 Sdk1ce/ce and Sdk2ce/ce mice stained with mouse antibodies to Sdk1 and Sdk2. Signal on blood vessels is nonspecific. Scale bar, 10 μm.
f. RT-PCR from Sdk1ce/+, Sdk1ce/ce, Sdk2ce/+ Sdk2ce/ce, and wildtype (Wt) mice. Total RNAs were prepared from brain. G3PDH, glyceraldehyde-3-phosphate dehydrogenase.
g. VG3-ACs and W3B-RGCs are Sdk1-negative. CreER expressed in P30 Sdk1 ce/+ mouse was stained with antibodies to the estrogen receptor and vesicular glutamate transporter 3 (VG3). Bottom row shows CreER and YFP double-staining in Sdk1ce/+; TYW3 mouse. Scale, 10 μm.
h. Sdk2-expressing W3B cells express a RGC marker, Brn3a, but not an amacrine cell marker, AP2. Calretinin is expressed in all the SACs, a subpopulation of CAII amacrine cells and some RGCs. Scale, 10 μm.
i. SACs (ChAT-positive), type I catecholaminergic (tyrosine hydroxylase-positive), SEG and nGnG (Satb2-positive35), amacrine cells do not express Sdk2. Scale, 10 μm.
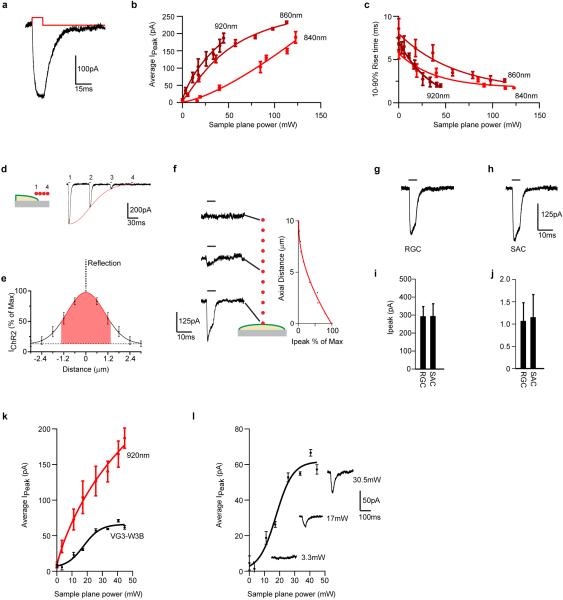
Extended data Figure 3. Optimization of optogenetic methods.
a. Sample current recorded from a ChR2-YFP expressing HEK cell in response to a stationary PSF-sized spot of 920nm laser stimulation for 7ms.
b. Plot of average peak current measured on ChR2-YFP expressing HEK cells in response to a stationary PSF-sized spot of laser stimulation at 840nm,860nm,920nm for a range of different powers.920nm produced the largest currents for the least power.
c. Plot of the rise time (10-90%) of currents to a stationary, PSF-sized spot of laser stimulation at 840nm, 860nm, 920nm for a range of different powers. 920nm light produced the shortest rise time for the least power.
d. Cartoon of a HEK cell with 4 adjacent, point spread function- (PSF-) sized pixels that starting on the edge of the cell and extending off (left). Sample currents evoked by stimulation of these regions. Currents decrease in size as the PSF moves away from the cell.
e. Quantification of the experiment illustrated in d for 5 cells. The curve was obtained in only one direction and reflected about the y-axis to give a measure of the XY spread of ChR2 excitation.
f. Cartoon of a HEK cell stimulated by a stationary, PSF-sized spot at 10 adjacent 1μm planes that extend from the cell surface to −10μm. Sample currents evoked by this procedure at the indicated z-positions. Average peak current measured on 4 cells for this procedure (right) show the z-extent of ChR2 excitation.
g. Sample current evoked in a ChR2 expressing RGC in response to stimulating an ROI (10×15) with a dwell time of 0.03ms, taking a total time of 5ms.
h. Sample current evoked in a ChR2 expressing SAC in response to stimulating an ROI (10×15) with a dwell time of 0.03ms, taking a total time of 5ms.
i. Average peak current evoked in RGCs and SACs in response to the stimuli shown in g and h (n = 6 cells)
j. Average rise time (10-90%) of currents evoked on RGCs and SACs in response to the stimuli shown in g and h (n = 6 cells)
k. Plot of average peak current measured in a W3B RGC in response to stimulation of VG3-ACs with 2p stimulation (920nm) for a range of sample plane powers. Average current size shows a sigmoid relationship. Responses plateau at 25mW sample plane power (n= 6 W3B-VG3 pairs in 2 animals). Average peak current (Ipeak) versus power relationship from panel b has been re-plotted for comparison.
l. Average peak current versus sample plane power measured on W3B RGCs to VG3-AC replotted from k. Sample currents beside the curve were evoked by the powers indicated. Responses require a threshold amount of excitation in VG3-ACs; likely owing to calcium-dependent vesicle release mechanisms (n= 6 W3B-VG3 pairs 2 animals).
Extended data Figure 4. VG3-ACs form direct excitatory synapses on W3B-RGCs.
a. Average current (I)-voltage (V) plot of VG3-AC evoked currents on W3B-RGCs. Currents were normalized to the maximum inward current per cell (n=10 VG3-W3B pairs).
b. Currents are abolished by inhibitors of AMPA-type glutamate receptors (DNQX, 20μM) but are unaffected by inhibitors of GABA (picrotoxin, PTX, 100μM), glycine (strychnine, STR, 3μM) receptors and gap junctions (18β-Glycyrrhetinic acid , 18β-GA, 25μM) (n = 8-10 per condition).
c. Latency of VG3-AC-evoked currents on W3B (n = 623 VG3s and 14 RGCs)
d. Inward currents measured in HEK cells transiently transfected with constructs containing ChR2-GFP. The 1st, 25th and 60th responses to a train (1hz) of 60 stimuli are shown for HEK cells recorded in control (CTL) and CdCl2-containing solution.
e. Peak currents from the experiment shown in a, plotted as a percent of the initial peak size. Currents in CdCl2 appear to decrease slightly over time.
f. Quantification of peak currents measured in Cd2+-containing solution expressed as a percent of those found in control solution (CTL). ChR2 activity is largely unaffected by the presence of CdCl2. (n= 6 cells, in CTL solution, 10 cells in 500μM and 8 cells in 1mM CdCl2 solution)
g. Responses of a ChR2-positive RGC to stimulus train that alternated between 2p excitation of ChR2 on the RGC soma and 1p activation of photoreceptors above the RGC. The 1st, 15th and 30th responses in the train are shown. ChR2 responses are insensitive to the calcium channel blocker but light responses are not.
h. Peak current measured on the final pulse of the train expressed as a percent of the first for the experiments performed like that in e. IChR2 is largely immune to the calcium channel blocker CdCl2. (n= 4 ChR2-positive RGCs)
i. Heat map of VG3-AC responses measured in a W3B RGC in control solution (left) and the same heat map measured in the presence of 500μM CdCl2. VG3-AC responses initiated by soma stimulation require functional voltage gated calcium channels in the nerve terminals.
j. Heat map of VG3-AC responses measured in the same W3B-RGC in CdCl2 solution shown in f in response to a 10×10 stimulus grid(grid square = 5×5pixels) in the inner plexiform layer (IPL). Activating ChR2 on VG3-AC nerve terminals produces responses in W3B-RGCs in spite of silencing voltage-activated calcium channels globally. Scale, 65ms and 34μm.
k. Currents recorded from W3B RGCs (−60mV) in response to stimulation of VG3-ACs at their somas (INL) or terminals (IPL) in control (CTL) and cadmium (CdCl2 ,200μM) containing solution (Left). Average peak current evoked by either soma (INL) or nerve terminal (IPL) stimulation in CdCl2 solution expressed as a percent of that found in CTL (Right, n = 276 VG3-ACs and 5 W3B-RGCs). Currents evoked by IPL stimulation in CdCl2 containing solution result from Ca2+ influx via ChR2 on VG3-AC terminals. VG3-ACs synapse directly with W3B-RGCs.
l. Sample currents evoked in W3B-RGCs, W3D RGCs and DS-RGCs by blue light (1-photon) stimulation of ChR2 positive VG3-ACs. Experiments were done in the presence of a cocktail of blockers: ACET, 10 μM, to block the OFF pathway,; L-AP4, 20 μM, to block the ON pathway and hexamethonium, 300 μM, to block cholinergic nicotinic receptors19,51.
m. Average peak currents from experiments like those in panel “l”. (n=15 W3B-RGCs, n=7 W3D-RGCs and n=13 ooDSGCs). These results from 1p stimulation of a population of VG3-ACs, confirm the conclusion from 2p stimulation of single VG3-ACs (Fig. 2): these amacrine cells innervate W3B-RGCs far more strongly than W3D-RGCs or ooDSGCs. By 1p stimulation, the currents evoked in ooDSGCs are stronger than those in W3D-RGCs, whereas they are similar in the 2p data. This difference likely arises from their larger dendritic size. Based on the dendritic diameter of VG3-ACs (~50 μm; Fig. 2c and 3r), W3B-RGCs (~115μm; Fig. 2c and 3l), W3D-RGCs (~125μm; data not shown) and ooDSGCs (200μm; ref 37), we can estimate that dendrites of W3B-RGCs, W3D-RGCs and ooDSGCs overlap dendrites of ~24, ~29 and ~100 VG3-ACs respectively. Given the percent connectivity in shown in Fig. 2, we estimate that each W3D-RGC is innervated by 10-15 VG3-ACs whereas each ooDSGC is innervated by ~35 VG3-ACs.
Extended data Figure 5. Synaptic connectivity of VG3-ACs and W3B-RGCs.
a-b. Strength of connections as a function of distance from 6 interneuron types to W3B-RGCs (a) and VG3-ACs to 4 RGC types (b). Number of synaptic partners assayed shown above and sample currents shown below each graph. The W7 population contained 6 nearly-disconnected and 10 connected pairs, presumably corresponding to the S1-laminating and S3-laminating W7 subsets. Normalized peak currents (Ipeak) from each pair were normalized to the average maximum response from VG3-AC–W3B-RGCs.
Extended data Figure 6. Normal retinal architecture in Sdk2 mutants.
Sections of Sdk2 ce/+ and Sdk2 ce/ce retinas (P30) were stained with antibodies to cell-type specific markers, synaptic components or fluorescent proteins. No differences between mutants and controls were detected in cells other than VG3-ACs and W3B-RGCs.
a. Brn3a labels most RGCs
b. AP2 labels all amacrine cells
c-d. Synapsin I, and SV2 are associated with synaptic vesicles
e.VGlut1 is concentrated in photoreceptor and bipolar terminals
f. PSD-95 family members, stained with anti-MAGUK, are associated with synaptic sites, usually excitatory postsynaptic densities
g. Synaptotagmin 2 is concentrated in bipolar cells types 2 and 6.
h. Anti-HCN4 labels type 3a bipolar cells
i. Anti-disabled-1 (Dab1) labels AII amacrines
j. Anti-VAChT labels dendrites of starburst amacrine cells
k. Anti-calretinin labels subsets of RGCs and amacrine cells, including starburst amacrine cells.
l. Anti-protein kinase C-alpha (PKCα) labels rod bipolar cells and a subset of amacrine cells.
m. Anti-VGlut3 labels VG3-ACs. Sprouting is evident in the mutant.
n. Single-cell reconstructions of VG3-ACs labeled sparsely with GFP in retinal cross-sections
o. Quantification of sprouting in mutant VG3-ACs. Scale, 10 μm for all parts.
Extended data Figure 7. Morphological analysis of VG3-ACs and W3B-RGCs in Sdk2 mutants.
a-b. Dye-injected W3B-RGCs were imaged and skeletonized as described in Methods. Projections on rotated stacks counterstained with anti-VAChT antibodies are shown in h.. Scale, 25μm.
c-d. Similar to g-l, except for VG3-ACs labeled sparsely with tdTomato and counterstained with anti-ChAT to label the somas of starburst amacrine cells. Scale, 25μm.
e-f. Mean intensity (±SEM) of dye-labeled W3B-RGC dendrites (e) and VG3-AC dendrites across the IPL from images such as those shown in a-d.
g-h. En face or laminar projections of skeletonized dendritic arbors from VG3-ACs labeled sparsely with tdTomato in Sdk2+/ce and Sdk2ce/ce retinae.
i-j. En face or laminar projections of skeletonized dendritic arbors from dye-filled W3B-RGCs in Sdk2+/ce and Sdk2ce/ce retinae.
Extended data Figure 8. Electrical and synaptic properties of Sdk2 mutant VG3-ACs and W3B-RGCs.
a-l. Strength of connections as a function of distance from 3 interneuron types (starbust amacrine cells (SAC), Type 5 Bipolar cells (BC5) and Type II catecholaminergic (CAII)) to W3B-RGCs and from VG3-ACs to W3D-RGCs in Sdk2ce/+ (black) and Sdk2ce/ce (red) retinae. a-d normalized peak current (Ipeak). e-h % of connected pairs. i-l average current amplitudes in a 30ms window following the stimulus pulse.
m-o Latencies of currents detectable above noise. Number of pre- and postsynaptic partners assayed shown below each column.
p. Responses evoked in a W3B-RGC (green dot) in a Sdk2 mutant upon stimulation of 66 VG3-ACs (Genotype: TYW3; Sdk2ce/ce; VGlut3-cre; lox-stop-lox ChR2-tdTomato).
q. Average latencies for currents detectable above noise in control.
r. Sodium currents in W3B-RGCs Sdk2ce/+ and Sdk2ce/ce retinae. Sample currents evoked by a step from −60mV to −5mV (left) and average peak sodium current amplitude measured on W3B-RGCs in Sdk2ce/+ and Sdk2ce/ce retinae.
s. Retinal crossections from wildtype mice and those that overexpress Sdk2 broadly using Six3-Cre driver and the Sdk2 swap transgene. Sdk2 is expressed strongly from the swap transgene.
t. mStrength of connections from VG3-ACs to W3B-RGCs in Sdk2ce/ce mutants where Sdk2 expression was rescued in VG3-ACs. Data was derived from 121 VG3-ACs and 3 W3B-RGCs. Fit to the control data (Fig. 1h) re-plotted in blue.
Extended data Figure 9. Effective deletion of VG3-ACs by diphtheria toxin (DT).
a. Spike responses of W3B-RGCs in Sdk2ce/+ and Sdk2ce/ce retinae in response to a ~100μm flashing spot centered on the receptive field. OFF responses are strongly reduced in the absence of Sdk2.
b. Inhibitory currents recorded (Vh = −5mV) from W3B-RGCs in Sdk2+/ce and Sdk2ce/ce retinae in response to a full field flash for 1s.
c. Ipeak measured from excitatory currents in non-W3B RGCs. (n=8 in 4 Sdk2ce/+ mice and 8 in 4 Sdk2ce/ce mice).
d-e. Sample images of tdTomato-positive VG3-ACs in retinae from DT treated CTL (a) and Vglut3/DTR mice (b). Scale bar, 40μm.
f. Average firing rate recorded from W3B-RGCs in CTL (blue, n = 21) and DT treated Vglut3-cre;DTR/TYW3 (red, n = 12) retinae in response to a small spots flashed for 1s. Dark lines, average; shadowing denotes SEM. Bin width, 50 msec.
g. Excitatory currents recorded (Vh = −65mV) from W3B-RGCs in CTL and DT treated Vglut3-cre;DTR/TYW3 retinae in response to a small spots flashed for 1s.
h. Inhibitory currents recorded (Vh = −5mV) from W3B-RGCs in CTL and DT treated Vglut3-cre;DTR/TYW3 retinae in response to a small spots flashed for 1s.
Extended data Figure 10. A delay line in the differential motion response.
a. Average latency to peak firing rate in W3B-RGCs and non-W3B RGCs in response to a spot flashed over their receptive field center(n = 21 non-W3B RGCs and 18 W3B RGCs). Spike responses on W3B-RGCs are delayed(**p<0.01).
b. Possible mechanisms for the delay. In non-W3B RGCs excitatory currents produced by BCs drive the neuron to fire. In W3B-RGCs spikes could be delayed because interposition of VG3-ACs delays the onset of the EPSC (W3B e delay) or because of a transient IPSC that arrives at the same time as the EPSC and delays the cell from reaching threshold (W3B i delay).
c,d. Excitatory (c) and inhibitory currents (d) measured from non-W3B- and W3B-RGCs in response to a flashing spot centered on the receptive field or a full field flash. Dotted lines denote the stimulus onset, non-W3B RGC EPSC onset and W3B-RGC EPSC onset (red). The onset of EPSCs in W3B-RGC lags behind those found on non-W3B-RGCs by ~30ms. No significant transient inhibition was observed in the receptive field center (d).
e,f. Histogram of latency to onset of the ON (e) and OFF (f) excitatory current measured on W3B-RGCs (light blue, light red) and non-W3B RGCs (blue, red). W3B RGCs lag non-W3B RGCs by ~32-40ms and also have higher variance about the mean (n = 29 non-W3B RGCs and 27 W3B RGCs).
g. Average peak of inhibitory currents measured on W3B-RGCs in response to a ~100μm diameter flashing spot and a full field flash (n =6 WT W3B RGCs; *p<0.05).
h. Slope of the light-evoked excitatory current between 10 and 90% of the peak. Slope of currents in W3B-RGCs are significantly lower than those of non-W3B RGCs. (n = 29 non-W3B RGCs and 27 W3B RGCs; **p<0.001). The non-W3B-RGCs included W3D-RGCs, ooDSGCs, alpha-RGCs, and some unidentified RGCs.
i. Average maximal firing rates measured in W3B-RGCs to local, global and differential motion stimuli. (n=10 W3B-RGCs in 5 CTL mice, 6 W3B-RGCs in 4 Sdk2ce/ce mice and 9 W3B-RGCs in 3 DT treated Vglut3-cre;DTR/TYW3 mice; **p<0.01). Firing rates in global and differential motion were normalized to that elicited in control (CTL) W3B-RGCs with local motion stimuli for Figure 4o.
ACKNOWLEDGEMENTS
We thank E. Soucy and J. Greenwood for assistance with constructing the two-photon microscope and the Genome Modification Facility at Harvard for generating mouse lines. E. Feinberg for insight into the ion selectivity of ChR2. This work was supported by grants from NIH (NS029169 and EY022073) to J.R.S., NSERC (Canada) and Banting Postdoctoral Fellowships to A.K., a HHMI-Life Sciences Research Foundation Postdoctoral Fellowship to X.D., and an NIH fellowship (F31 NS055488) to Y.K.H.
Footnotes
AUTHOR CONTRIBUTIONS
A.K., M.Y and J.R.S planned experiments, analyzed data and wrote the paper. A.K. performed electrophysiological and histological experiments, M.Y. performed genetic and histological experiments, X.D. developed methods and generated reagents and Y.K.H. generated reagents and performed in situ hybridization. The authors declare no competing interest.
ONLINE CONTENT
Methods and Extended Data display items are available in the online version of the paper.
REFERENCES
- 1.Sanes JR, Zipursky SL. Design principles of insect and vertebrate visual systems. Neuron. 2010;66:15–36. doi: 10.1016/j.neuron.2010.01.018. [DOI] [PMC free article] [PubMed] [Google Scholar]
- 2.Gollisch T, Meister M. Eye smarter than scientists believed: neural computations in circuits of the retina. Neuron. 2010;65:150–164. doi: 10.1016/j.neuron.2009.12.009. [DOI] [PMC free article] [PubMed] [Google Scholar]
- 3.Masland RH. The neuronal organization of the retina. Neuron. 2012;76:266–280. doi: 10.1016/j.neuron.2012.10.002. [DOI] [PMC free article] [PubMed] [Google Scholar]
- 4.Sanes JR, Masland RH. The types of retinal ganglion cells: current status and implications for neuronal classification. Annu. Rev. Neurosci. doi: 10.1146/annurev-neuro-071714-034120. (in press) [DOI] [PubMed] [Google Scholar]
- 5.Kim IJ, Zhang Y, Meister M, Sanes JR. Laminar restriction of retinal ganglion cell dendrites and axons: subtype-specific developmental patterns revealed with transgenic markers. J. Neurosci. 2010;30:1452–1462. doi: 10.1523/JNEUROSCI.4779-09.2010. [DOI] [PMC free article] [PubMed] [Google Scholar]
- 6.Zhang Y, Kim IJ, Sanes JR, Meister M. The most numerous ganglion cell type of the mouse retina is a selective feature detector. PNAS. 2012;109:E2391–2398. doi: 10.1073/pnas.1211547109. [DOI] [PMC free article] [PubMed] [Google Scholar]
- 7.Baccus SA, Olveczky BP, Manu M, Meister M. A retinal circuit that computes object motion. J. Neurosci. 2008;28:6807–6817. doi: 10.1523/JNEUROSCI.4206-07.2008. [DOI] [PMC free article] [PubMed] [Google Scholar]
- 8.Olveczky BP, Baccus SA, Meister M. Segregation of object and background motion in the retina. Nature. 2003;423:401–408. doi: 10.1038/nature01652. [DOI] [PubMed] [Google Scholar]
- 9.Venkataramani S, et al. Distinct roles for inhibition in spatial and temporal tuning of local edge detectors in the rabbit retina. PloS one. 2014;9:e88560. doi: 10.1371/journal.pone.0088560. [DOI] [PMC free article] [PubMed] [Google Scholar]
- 10.Russell TL, Werblin FS. Retinal synaptic pathways underlying the response of the rabbit local edge detector. Journal of neurophysiology. 2010;103:2757–2769. doi: 10.1152/jn.00987.2009. [DOI] [PMC free article] [PubMed] [Google Scholar]
- 11.van Wyk M, Taylor WR, Vaney DI. Local edge detectors: a substrate for fine spatial vision at low temporal frequencies in rabbit retina. J. Neurosci. 2006;26:13250–13263. doi: 10.1523/JNEUROSCI.1991-06.2006. [DOI] [PMC free article] [PubMed] [Google Scholar]
- 12.Levick WR. Receptive fields and trigger features of ganglion cells in the visual streak of the rabbits retina. The Journal of physiology. 1967;188:285–307. doi: 10.1113/jphysiol.1967.sp008140. [DOI] [PMC free article] [PubMed] [Google Scholar]
- 13.Yamagata M, Weiner JA, Sanes JR. Sidekicks: synaptic adhesion molecules that promote lamina-specific connectivity in the retina. Cell. 2002;110:649–660. doi: 10.1016/s0092-8674(02)00910-8. [DOI] [PubMed] [Google Scholar]
- 14.Yamagata M, Sanes JR. Dscam and Sidekick proteins direct lamina-specific synaptic connections in vertebrate retina. Nature. 2008;451:465–469. doi: 10.1038/nature06469. [DOI] [PubMed] [Google Scholar]
- 15.Yamagata M, Sanes JR. Synaptic localization and function of Sidekick recognition molecules require MAGI scaffolding proteins. J. Neurosci. 2010;30:3579–3588. doi: 10.1523/JNEUROSCI.6319-09.2010. [DOI] [PMC free article] [PubMed] [Google Scholar]
- 16.Haverkamp S, Wassle H. Characterization of an amacrine cell type of the mammalian retina immunoreactive for vesicular glutamate transporter 3. The Journal of comparative neurology. 2004;468:251–263. doi: 10.1002/cne.10962. [DOI] [PubMed] [Google Scholar]
- 17.Grimes WN, Seal RP, Oesch N, Edwards RH, Diamond JS. Genetic targeting and physiological features of VGLUT3+ amacrine cells. Visual neuroscience. 2011;28:381–392. doi: 10.1017/S0952523811000290. [DOI] [PMC free article] [PubMed] [Google Scholar]
- 18.Johnson J, et al. Vesicular glutamate transporter 3 expression identifies glutamatergic amacrine cells in the rodent retina. The Journal of comparative neurology. 2004;477:386–398. doi: 10.1002/cne.20250. [DOI] [PMC free article] [PubMed] [Google Scholar]
- 19.Lee S, et al. An unconventional glutamatergic circuit in the retina formed by vGluT3 amacrine cells. Neuron. 2014;84:708–715. doi: 10.1016/j.neuron.2014.10.021. [DOI] [PMC free article] [PubMed] [Google Scholar]
- 20.Kim T, Soto F, Kerschensteiner D. An excitatory amacrine cell detects object motion and provides feature-selective input to ganglion cells in the mouse retina. eLife. 2015 doi: 10.7554/eLife.08025. 10.7554/eLife.08025. [DOI] [PMC free article] [PubMed] [Google Scholar]
- 21.El Mestikawy S, et al. From glutamate co-release to vesicular synergy: vesicular glutamate transporters. Nature Rev. Neuroscience. 2011;12:204–216. doi: 10.1038/nrn2969. [DOI] [PubMed] [Google Scholar]
- 22.Peters A, Feldman ML. The projection of the lateral geniculate nucleus to area 17 of the rat cerebral cortex. I. General description. J Neurocytol. 1976;5:63–84. doi: 10.1007/BF01176183. [DOI] [PubMed] [Google Scholar]
- 23.Stepanyants A, Chklovskii DB. Neurogeometry and potential synaptic connectivity. Trends in neurosciences. 2005;28:387–394. doi: 10.1016/j.tins.2005.05.006. [DOI] [PubMed] [Google Scholar]
- 24.Shepherd GM, Stepanyants A, Bureau I, Chklovskii D, Svoboda K. Geometric and functional organization of cortical circuits. Nature neuroscience. 2005;8:782–790. doi: 10.1038/nn1447. [DOI] [PubMed] [Google Scholar]
- 25.Binzegger T, Douglas RJ, Martin KA. A quantitative map of the circuit of cat primary visual cortex. J. Neurosci. 2004;24:8441–8453. doi: 10.1523/JNEUROSCI.1400-04.2004. [DOI] [PMC free article] [PubMed] [Google Scholar]
- 26.Duan X, Krishnaswamy A, De la Huerta I, Sanes JR. Type II Cadherins Guide Assembly of a Direction-Selective Retinal Circuit. Cell. 2014;158:793–807. doi: 10.1016/j.cell.2014.06.047. [DOI] [PubMed] [Google Scholar]
- 27.Matsuoka RL, et al. Transmembrane semaphorin signalling controls laminar stratification in the mammalian retina. Nature. 2011;470:259–263. doi: 10.1038/nature09675. [DOI] [PMC free article] [PubMed] [Google Scholar]
- 28.Yamagata M, Sanes JR. Expanding the Ig superfamily code for laminar specificity in retina: expression and role of contactins. J. Neurosci. 2012;32:14402–14414. doi: 10.1523/JNEUROSCI.3193-12.2012. [DOI] [PMC free article] [PubMed] [Google Scholar]
- 29.Fuerst PG, Koizumi A, Masland RH, Burgess RW. Neurite arborization and mosaic spacing in the mouse retina require DSCAM. Nature. 2008;451:470–474. doi: 10.1038/nature06514. [DOI] [PMC free article] [PubMed] [Google Scholar]
- 30.Chan W, et al. A recombineering based approach for high-throughput conditional knockout targeting vector construction. Nucleic acids research. 2007;35:e64. doi: 10.1093/nar/gkm163. [DOI] [PMC free article] [PubMed] [Google Scholar]
- 31.Rodriguez CI, et al. High-efficiency deleter mice show that FLPe is an alternative to Cre-loxP. Nature genetics. 2000;25:139–140. doi: 10.1038/75973. [DOI] [PubMed] [Google Scholar]
- 32.Buffelli M, et al. Genetic evidence that relative synaptic efficacy biases the outcome of synaptic competition. Nature. 2003;424:430–434. doi: 10.1038/nature01844. [DOI] [PubMed] [Google Scholar]
- 33.Kay JN, et al. Retinal ganglion cells with distinct directional preferences differ in molecular identity, structure, and central projections. The Journal of neuroscience : the official journal of the Society for Neuroscience. 2011;31:7753–7762. doi: 10.1523/JNEUROSCI.0907-11.2011. [DOI] [PMC free article] [PubMed] [Google Scholar]
- 34.Duan X, Qiao M, Bei F, Kim IJ, He Z, Sanes JR. Subtype-Specific Regeneration of Retinal Ganglion Cells following Axotomy: Effects of Osteopontin and mTOR Signaling. Neuron. doi: 10.1016/j.neuron.2015.02.017. (in press) [DOI] [PMC free article] [PubMed] [Google Scholar]
- 35.Goebbels S, et al. Cre/loxP-mediated inactivation of the bHLH transcription factor gene NeuroD/BETA2. Genesis. 2005;42:247–252. doi: 10.1002/gene.20138. [DOI] [PubMed] [Google Scholar]
- 36.Kay JN, Voinescu PE, Chu MW, Sanes JR. Neurod6 expression defines new retinal amacrine cell subtypes and regulates their fate. Nature neuroscience. 2011;14:965–972. doi: 10.1038/nn.2859. [DOI] [PMC free article] [PubMed] [Google Scholar]
- 37.Zhuang X, Masson J, Gingrich JA, Rayport S, Hen R. Targeted gene expression in dopamine and serotonin neurons of the mouse brain. Journal of neuroscience methods. 2005;143:27–32. doi: 10.1016/j.jneumeth.2004.09.020. [DOI] [PubMed] [Google Scholar]
- 38.Rossi J, Balthasar N, Olson D, Scott M, Berglund E, Lee CE, Choi MJ, Lauzon D, Lowell BB, Elmquist JK. Melanocortin-4 receptors expressed by cholinergic neurons regulate energy balance and glucose homeostasis. Cell metabolism. 2011;13:195–204. doi: 10.1016/j.cmet.2011.01.010. [DOI] [PMC free article] [PubMed] [Google Scholar]
- 39.Trenholm S, Johnson K, Li X, Smith RG, Awatramani GB. Parallel mechanisms encode direction in the retina. Neuron. 2011;71:683–694. doi: 10.1016/j.neuron.2011.06.020. [DOI] [PMC free article] [PubMed] [Google Scholar]
- 40.Madisen L, et al. A toolbox of Cre-dependent optogenetic transgenic mice for light-induced activation and silencing. Nature neuroscience. 2012;15:793–802. doi: 10.1038/nn.3078. [DOI] [PMC free article] [PubMed] [Google Scholar]
- 41.Buch T, et al. A Cre-inducible diphtheria toxin receptor mediates cell lineage ablation after toxin administration. Nature methods. 2005;2:419–426. doi: 10.1038/nmeth762. [DOI] [PubMed] [Google Scholar]
- 42.Dymecki SM, Ray RS, Kim JC. Mapping cell fate and function using recombinase-based intersectional strategies. Methods in enzymology. 2010;477:183–213. doi: 10.1016/S0076-6879(10)77011-7. [DOI] [PubMed] [Google Scholar]
- 43.Furuta Y, Lagutin O, Hogan BL, Oliver GC. Retina- and ventral forebrain-specific Cre recombinase activity in transgenic mice. Genesis. 2000;26:130–132. [PubMed] [Google Scholar]
- 44.Yamagata M, Sanes JR. Transgenic strategy for identifying synaptic connections in mice by fluorescence complementation (GRASP). Frontiers in molecular neuroscience. 2012;5:18. doi: 10.3389/fnmol.2012.00018. [DOI] [PMC free article] [PubMed] [Google Scholar]
- 45.Lefebvre JL, Kostadinov D, Chen WV, Maniatis T, Sanes JR. Protocadherins mediate dendritic self-avoidance in the mammalian nervous system. Nature. 2012;488:517–521. doi: 10.1038/nature11305. [DOI] [PMC free article] [PubMed] [Google Scholar]
- 46.Cai D, Cohen KB, Luo T, Lichtman JW, Sanes JR. Improved tools for the Brainbow toolbox. Nat Methods. 2013;10:540–547. [PubMed] [Google Scholar]
- 46.Cuntz H, Forstner F, Borst A, Häusser M. One rule to grow them all: a general theory of neuronal branching and its practical application. PLoS Comput Biol. 2010;6 doi: 10.1371/journal.pcbi.1000877. doi: 10.1371/journal.pcbi.1000877. [DOI] [PMC free article] [PubMed] [Google Scholar]
- 47.Asari H, Meister M. The projective field of retinal bipolar cells and its modulation by visual context. Neuron. 2014;81:641–652. doi: 10.1016/j.neuron.2013.11.029. [DOI] [PubMed] [Google Scholar]
- 48.Rickgauer JP, Tank DW. Two-photon excitation of channelrhodopsin-2 at saturation. Proceedings of the National Academy of Sciences of the United States of America. 2009;106:15025–15030. doi: 10.1073/pnas.0907084106. [DOI] [PMC free article] [PubMed] [Google Scholar]
- 49.Prakash R, et al. Two-photon optogenetic toolbox for fast inhibition, excitation and bistable modulation. Nature methods. 2012;9:1171–1179. doi: 10.1038/nmeth.2215. [DOI] [PMC free article] [PubMed] [Google Scholar]
- 50.Andrasfalvy BK, Zemelman BV, Tang J, Vaziri A. Two-photon single-cell optogenetic control of neuronal activity by sculpted light. Proceedings of the National Academy of Sciences of the United States of America. 2010;107:11981–11986. doi: 10.1073/pnas.1006620107. [DOI] [PMC free article] [PubMed] [Google Scholar]
- 51.Katz B, Miledi R. The release of acetylcholine from nerve endings by graded electric pulses. Proceedings of the Royal Society of London. 1967;167:23–38. doi: 10.1098/rspb.1967.0011. [DOI] [PubMed] [Google Scholar]
- 52.Euler T, et al. Eyecup scope--optical recordings of light stimulus-evoked fluorescence signals in the retina. Pflugers Archiv : European journal of physiology. 2009;457:1393–1414. doi: 10.1007/s00424-008-0603-5. [DOI] [PMC free article] [PubMed] [Google Scholar]
- 53.Borghuis BG, Looger LL, Tomita S, Demb JB. Kainate receptors mediate signaling in both transient and sustained OFF bipolar cell pathways in mouse retina. J Neurosci. 34:6128–6139. doi: 10.1523/JNEUROSCI.4941-13.2014. [DOI] [PMC free article] [PubMed] [Google Scholar]


