Abstract
Intravascular photoacoustic imaging at 1.7 μm spectral band has shown promising capabilities for lipid-rich vulnerable atherosclerotic plaque detection. In this work, we report a high speed catheter-based integrated intravascular photoacoustic/intravascular ultrasound (IVPA/IVUS) imaging system with a 500 Hz optical parametric oscillator laser at 1725 nm. A lipid-mimicking phantom and atherosclerotic rabbit abdominal aorta were imaged at 1 frame per second, which is two orders of magnitude faster than previously reported in IVPA imaging with the same wavelength. Clear photoacoustic signals by the absorption of lipid rich deposition demonstrated the ability of the system for high speed vulnerable atherosclerotic plaques detection.
Acute cardiovascular events are mostly due to blood clots or thrombus induced by the sudden rupture of vulnerable atherosclerotic plaques within the coronary artery wall.1,2 Thin-cap fibroatheroma (TCFA) has a large, lipid-rich, necrotic core, which has been demonstrated as a primary type of vulnerable atherosclerotic plaque with a high risk to ruptures.3–5 Accurate quantification of both the morphology and composition of a plaque are essential for early detection and optimal treatment in clinics. Several catheter-based intravascular imaging techniques have been investigated. Intravascular ultrasound (IVUS) has been widely used in clinics4–6 and provides structural information of the atherosclerotic plaque with good penetration depth and axial resolutions of approximately 70 μm. However, the contrast between the lipid-rich region and other soft tissues is limited.6–8 Optical coherence tomography (OCT) has a higher axial resolution of ∼10 μm, which is ideal for thin fibrous cap thickness measurements, but the penetration depth is less than 2 mm and generally requires blood to be flushed from the imaging area.9,10 Intravascular near-infrared reflection spectroscopy (NIRS) identifies the presence of lipid-rich plaque by detection of the reflection spectrum of the vascular wall, but lacks depth resolution.11,12
Photoacoustic (PA) imaging is a hybrid imaging technique that detects the ultrasound signals generated by the absorption of short pulsed laser inside tissue.13–15 Based on the optical absorption contrast of the tissues within the vessel wall, intravascular photoacoustic (IVPA) imaging for characterizing plaque compositions has been studied.16–27 Recently, due to the high optical absorption by first overtone of C-H bonds around 1720 nm, IVPA imaging of lipid-rich atherosclerotic plaque at 1.7 μm spectral band has been attracting great attention.21,28 However, current IVPA imaging speed is limited by the repetition rate of commercial nanosecond lasers at 1.7 μm. Using a laser with 10 Hz repetition rate, one cross-sectional image requires tens of seconds to finish, which limits the translation of the technology for in vivo application.16,18,21,23,24 In this letter, we report on a two orders of magnitude faster integrated IVPA/IVUS hybrid imaging system with a 500 Hz nanosecond-pulsed optical parametric oscillator (OPO) laser at 1.7 μm. An IVPA catheter with 1.0 mm outer diameter (OD) was designed and tested by a lipid-mimicking phantom. Finally, three-dimensional (3-D) ex vivo IVPA/IVUS imaging of an atherosclerotic rabbit abdominal aorta has been demonstrated.
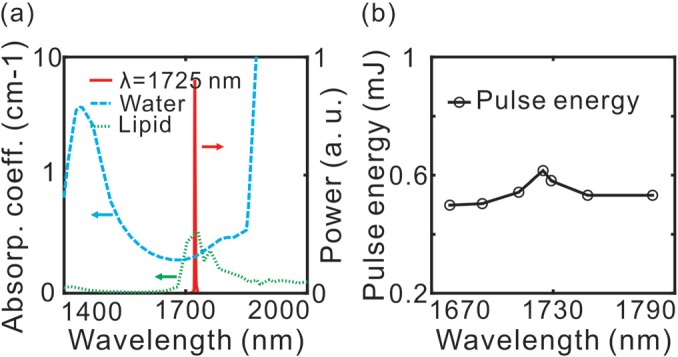
We have collaborated with Elforlight Ltd. and AdvR Inc. to develop a high repetition rate light source for high speed IVPA at 1725 nm. In the custom-made OPO laser, a Q-switched Nd: YAG laser at 1064 nm was used to pump a periodically poled magnesium-doped lithium niobate (PPLN) crystal (2 × 2 mm2 aperture, 31.15 μm poling period) inside a resonating cavity which was composed of a highly reflective rear mirror and a 30% reflectivity output coupling mirror. The resonating signal was optimized at 1725 nm wavelength while the idler at 2.8 μm was dumped. Fig. 1(a) shows that the measured laser output at 1725 nm with a 5 nm spectral linewidth (solid red line) is located within the high lipid (dotted green line) and water (dashed blue line) absorption contrast window. Wavelength of the laser was tunable from 1679 nm to 1779 nm. The repetition rate was adjustable from 1 to 500 Hz with a pulse duration of 6 ns. At 500 Hz repetition rate, the output energies as a function of the central wavelength were measured as shown in Fig. 1(b); the maximum pulse energy was measured as 0.6 mJ at 1725 nm.
FIG. 1.

(a) Laser output spectrum at 1725 nm with 5 nm spectral linewidth (solid red line), absorption spectrum of lipid (dotted green line) and water (dashed blue line). (b) Measured pulse energy (circles) at 1679 nm, 1695 nm, 1713 nm, 1725 nm, 1729 nm, 1747 nm, and 1779 nm under the same pump power.
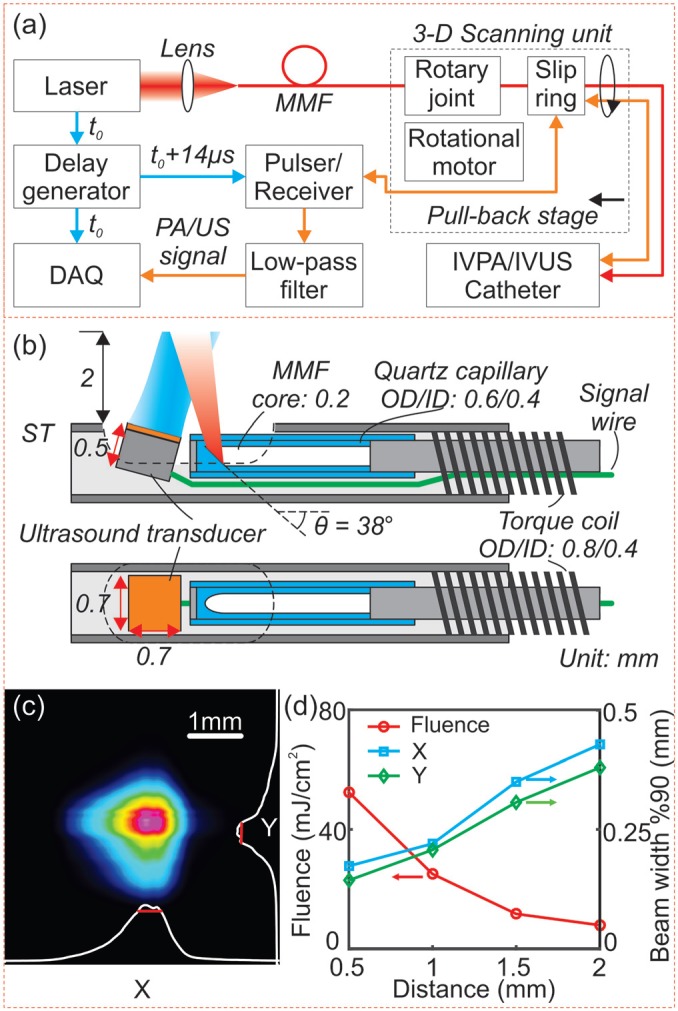
The block diagram of the IVPA/IVUS imaging system is illustrated in Fig. 2(a). A 3-D scanning unit composed of a linear pull-back stage for linear scanning, an optical rotary joint for laser coupling, and an electrical slip ring for electrical signal coupling was applied for motion control and optical/electrical coupling between the stationary components and the rotational IVPA/IVUS catheter.26,29 The laser was coupled into the rotary joint through a 200-μm core multimode fiber. The rotation was generated by a rotational motor and transmitted to the distal end of the catheter by a torque coil (OD/ID: 0.8 mm/0.4 mm).29 The master trigger (t0) from the laser was delayed (t0 + 14 μs) by a delay generator to activate the US pulser/receiver. The IVPA and IVUS signals were amplified by the receiver (+39 dB) and filtered (10 MHz high-pass filter, 60 MHz low-pass filter). A 12 bit, 500 MS/s data acquisition board, synchronized with the master trigger (t0), was used to digitize the IVPA/IVUS signals at a 250 MS/s sampling rate. The data acquisition time for one set of IVPA/IVUS signals was 30 μs. The data were post processed by a Matlab-based program and rendered in 3-D.
FIG. 2.

(a) A block diagram of the IVPA/IVUS imaging system. (b) Detailed schematic in side/top view of the distal section of the catheter. (c) Laser intensity distribution measured at 2 mm distance from the catheter surface. (d) Measured 90% clip beam width (perpendicular, X, blue square; parallel, Y, green diamond), and calculated laser fluence at 0.5 mm, 1 mm, 1.5 mm, and 2 mm (red circle). DAQ: data acquisition board; MMF: multimode fiber; ST: stainless steel tubing.
The design of the integrated IVPA/IVUS catheter is illustrated in Fig. 2(b). The catheter was composed of a 200–μm core MMF and a home-built ultrasonic transducer (0.7 × 0.7 × 0.5 mm3 with an active element area of 0.5 × 0.5 mm2, 45 MHz center frequency). As shown in Fig. 2(b), the tip of the MMF was 38-degrees polished and enclosed in a quartz capillary for total internal reflection. The distal portion was encased in a 1 mm OD, 6 mm long stainless steel tubing. The transducer was slightly tilted toward the fiber to avoid ultrasonic reflections and to achieve a maximized optical/acoustic beam overlap within 2 mm from the catheter surface. The MMF and signal wire were inserted in the torque coil and connected to the rotating terminal of the rotary joint and the slip ring, respectively. The optical insertion loss of rotary joint was measured to be −2 dB with a ±0.15 dB variance. Considering the −1 dB coupling loss from the laser to the MMF, the total loss was estimated to be −3 dB. Even at the maximum laser power, the peak power density on the fiber air interface (∼0.4 GW/cm2) was lower than the fiber damage threshold (1 GW/cm2).
We used a 200-μm core MMF instead of the widely used larger core MMFs.16,19 Reduction of core diameter enabled laser illumination with higher laser fluence over the reduced spot size on the tissue. In the current study, the pulse energy was adjusted to 0.1 mJ for IVPA imaging. The laser intensity distribution was measured with a beam profiler. From Fig. 2(c), we can see that the laser beam at 2 mm was slightly elliptical with a 90% clip beam width of 428 μm and 380 μm on the X- and Y-axis (x: perpendicular, y: parallel to the catheter longitudinal axis, respectively). The beam-width in both directions (X, blue square; Y, green diamond) and the calculated laser fluence vs. the distance from the catheter's longitudinal axis are shown in Fig. 2(d). Laser fluence of ∼28 mJ/cm2 and ∼8 mJ/cm2 at 1 mm and 2 mm, respectively, were within the ANSI allowed safety range (at 1.7 μm, single pulse MPE = 1 J/cm2).30
Since there was no optical or acoustic focusing, the lateral resolution was determined by the beam width while the axial resolution was determined by the frequency of the US transducer. We measured the resolution of the IVPA/IVUS imaging system with a 25-μm diameter tungsten wire in deionized water. The axial resolutions of IVPA and IVUS were determined to be 60 μm and 52 μm, respectively. The transverse resolutions of IVPA and IVUS were measured as 350 μm and 300 μm, respectively, at a distance of 1.5 mm from the catheter.
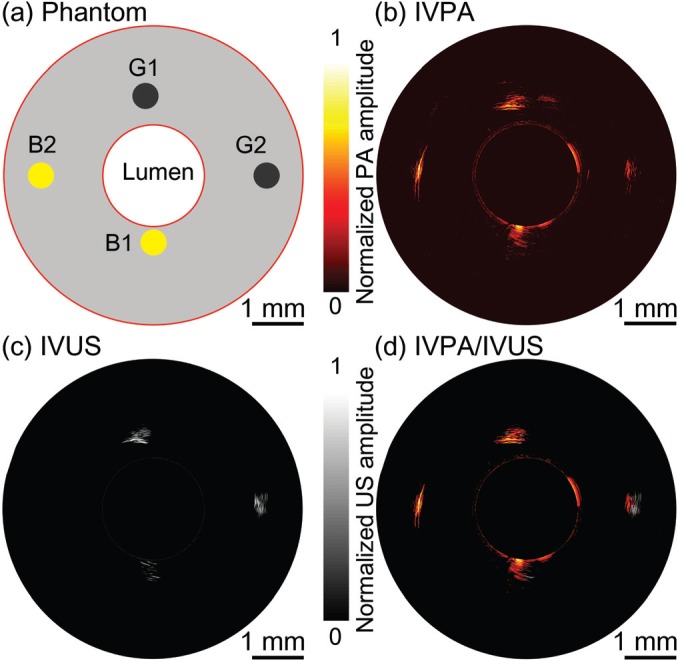
A lipid-mimicking vessel phantom was imaged using the laser at 1725 nm. The phantom with a 2 mm-diameter lumen was molded from a solution containing 5% gelatin and 2% silica particles (5-μm average diameter) as an acoustic scattering agent.27,31 As shown in Fig. 3(a), four 0.5-mm diameter cylindrical cavities were located at 0.2 mm (B1), 0.5 mm (G1), 1.0 mm (B2), and 1.0 mm (G2) from the lumen and filled with inclusions of butter (B1, B2) and graphite rods (G1, G2). In a deionized water bath, the phantom was imaged at 1 frame per second without averaging of IVPA and IVUS signals. The obtained IVPA and IVUS images are shown in Figs. 3(b) and 3(c), respectively, with both images displayed on 25 dB dynamic range. The co-registration of IVPA and IVUS images is confirmed in the overlaid image in Fig. 3(d). Two graphite rod inclusions can be observed using both imaging modalities. Strong absorption of the laser was observed in butter, and both butter inclusions were clearly detectable in the IVPA image. However, in the IVUS image, only the butter inclusion at 0.2 mm (B1) was observed. In addition, the butter inclusions appeared to induce much higher signal contrast in the IVPA image than in the IVUS image. This demonstrated that the imaging system with 1725 nm laser is capable of lipid rich tissue detection in scattering medium with high imaging contrast.
FIG. 3.

(a) A diagram of lipid-mimicking phantom with graphite rod and butter inclusions. (b) IVPA, (c) IVUS, and (d) overlaid IVPA/IVUS cross-sectional image of lipid-mimicking vessel phantom. G1, G2: graphite rods; B1, B2: butter inclusions. Both IVPA and IVUS images are displayed at 25 dB.
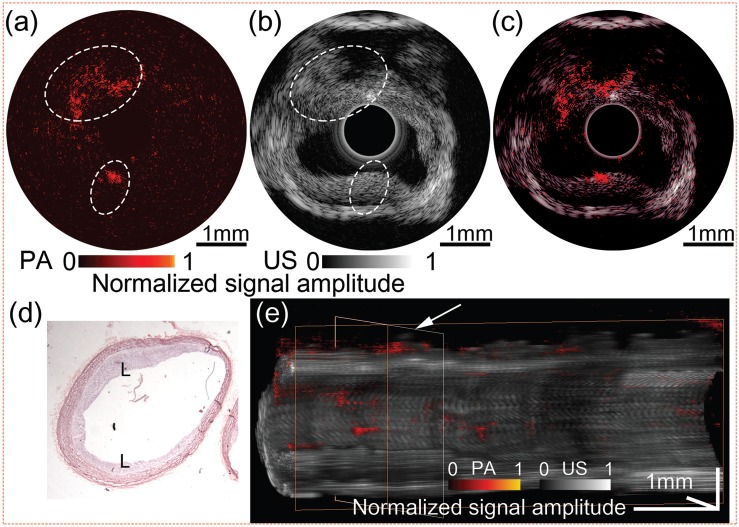
To demonstrate the high speed IVPA/IVUS imaging system for lipid-rich atherosclerotic plaque detection, a fresh abdominal aorta sample from an atherosclerotic New-Zealand White rabbit was imaged at 1725 nm wavelength. An abdominal aorta de-endothelialization procedure was performed on the rabbit, followed by 12 weeks of high cholesterol diet for formation of atherosclerotic plaque (according to the UC Irvine IACUC protocol 2013-3113). In a saline bath, a 5-mm long section of aorta was imaged with 1 Hz cross-sectional imaging speed and 0.1 mm per second pull-back rate. The IVPA and IVUS images captured from a same cross-section in the aorta are shown in Figs. 4(a) and 4(b), respectively. From the IVPA image, a clear photoacoustic signal was observed at the upper-left and lower region (encircled), where the intimal thickening can be found in the corresponding locations (encircled) in the IVUS image. However, regions with lipid depositions were difficult to distinguish in the IVUS. From the overlaid IVPA/IVUS image in Fig. 4(c), and the hematoxylin and eosin (H & E) stained histology image in Fig. 4(d), the co-registered lipid deposits regions on the intimal layer were confirmed. Furthermore, 3-D volume was rendered with 50 cross-sectional IVPA/IVUS images, as shown in Fig. 4(e). A white arrow indicates the cross-section of the aorta which is displayed in Figs. 4(a)–4(c). The distributions of lipid depositions on the inner wall of the vessel were clearly visible, demonstrating that the IVPA/IVUS imaging system is capable of detection of the lipid deposition within the atherosclerotic aorta.
FIG. 4.
Ex vivo IVPA/IVUS image of the atherosclerotic rabbit abdominal aorta. (a) IVPA, (b) IVUS, and (c) overlaid IVPA/IVUS image. (d) H & E stained histology. (e) 3D rendered volume from a 5 mm-long rabbit abdominal aorta, cut along the longitudinal axis. IVPA and IVUS images are displayed at 20 dB and 50 dB, respectively. L: lipid deposition.
In summary, we have demonstrated an IVPA/IVUS imaging system with a 500 Hz OPO laser at 1725 nm, almost two orders of magnitude faster than previously reported. Images from both the phantom and atherosclerotic rabbit abdominal aorta indicated that the IVPA/IVUS imaging system is a promising tool for lipid-rich atherosclerotic plaque detection. Although current imaging speed is still insufficient for clinical applications, where a frame rate of over 20 Hz is needed for real-time imaging, we are currently developing a 10 kHz repetition rate, 1725 nm laser, which would allow for real time imaging in the near future.
Acknowledgments
The authors gratefully acknowledge Mr. Keith Oakes from Elforlight Ltd. and Mr. Bob Tamosaitis from AdvR Inc., for their cooperation and involvement in configuring a custom system. We also acknowledge Mr. Earl Steward for his assistance in collecting rabbit aorta samples. This work was supported by the National Institutes of Health (R01HL-125084, R01HL-127271, R01EY-021529, and P41EB-015890), AFOSR (FA9550-14-1-0034), and Basic Science Research Program through the National Research Foundation of Korea (NRF-2013R1A1A1005761). Professor Chen has a financial interest in OCT Medical, Inc., which, however, did not provide support for this work.
References
- 1. Arbab-Zadeh A., Nakano M., Virmani R., and Fuster V., Circulation 125, 1147 (2012). 10.1161/CIRCULATIONAHA.111.047431 [DOI] [PMC free article] [PubMed] [Google Scholar]
- 2. Narula J. and Strauss H. W., Nat. Med. 13, 532 (2007). 10.1038/nm0507-532 [DOI] [PubMed] [Google Scholar]
- 3. Finn A. V., Nakano M., Narula J., Kolodgie F. D., and Virmani R., Arterioscler., Thromb., Vasc. Biol. 30, 1282 (2010). 10.1161/ATVBAHA.108.179739 [DOI] [PubMed] [Google Scholar]
- 4. Puri R., Worthley M. I., and Nicholls S. J., Nat. Rev. Cardiol. 8, 131 (2011) 10.1038/nrcardio.2010.210. [DOI] [PubMed] [Google Scholar]
- 5. Schaar J. A., Muller J. E., Falk E., Virmani R., Fuster V., Serruys P. W., Colombo A., Stefanadis C., Cassells S. W., Moreno P. R., Maseri A., and van der Steen A. F. W., Eur. Heart J. 25, 1077 (2004). 10.1016/j.ehj.2004.01.002 [DOI] [PubMed] [Google Scholar]
- 6. Li J., Li X., Mohar D., Raney A., Jing J., Zhang J., Johnston A., Liang S., Ma T., Shung K. K., Mahon S., Brenner M., Narula J., Zhou Q., Patel P. M., and Chen Z., JACC Cardiovasc. Imag. 7, 101 (2014). 10.1016/j.jcmg.2013.07.012 [DOI] [PMC free article] [PubMed] [Google Scholar]
- 7. Nair A., Kuban B. D., Tuzcu E. M., Schoenhagen P., Nissen S. E., and Vince D. G., Circulation 106, 2200 (2002). 10.1161/01.CIR.0000035654.18341.5E [DOI] [PubMed] [Google Scholar]
- 8. Li X., Yin J. C., Hu C. H., Zhou Q. F., Shung K. K., and Chen Z. P., Appl. Phys. Lett. 97, 133702 (2010) 10.1063/1.3493659. [DOI] [PMC free article] [PubMed] [Google Scholar]
- 9. Tearney G. J., Yabushita H., Houser S. L., Aretz H. T., Jang I. K., Schlendorf K. H., Kauffman C. R., Shishkov M., Halpern E. F., and Bouma B. E., Circulation 107, 113 (2003). 10.1161/01.CIR.0000044384.41037.43 [DOI] [PubMed] [Google Scholar]
- 10. Low A. F., Kawase Y., Chan Y. H., Tearney G. J., Bouma B. E., and Jang I. K., EuroIntervention 4, 626 (2009). 10.4244/EIJV4I5A105 [DOI] [PMC free article] [PubMed] [Google Scholar]
- 11. Moreno P. R., Lodder R. A., Purushothaman K. R., Charash W. E., O'Connor W. N., and Muller J. E., Circulation 105, 923 (2002). 10.1161/hc0802.104291 [DOI] [PubMed] [Google Scholar]
- 12. Gardner C. M., Tan H. W., Hull E. L., Lisauskas J. B., Sum S. T., Meese T. M., Jiang C. S., Madden S. P., Caplan J. D., Burke A. P., Virmani R., Goldstein J., and Muller J. E., JACC Cardiovasc. Imag. 1, 638 (2008). 10.1016/j.jcmg.2008.06.001 [DOI] [PubMed] [Google Scholar]
- 13. Wang L. V. and Hu S., Science 335, 1458 (2012). 10.1126/science.1216210 [DOI] [PMC free article] [PubMed] [Google Scholar]
- 14. Yang J. M., Maslov K., Yang H. C., Zhou Q. F., Shung K. K., and Wang L. H. V., Opt. Lett. 34, 1591 (2009). 10.1364/OL.34.001591 [DOI] [PMC free article] [PubMed] [Google Scholar]
- 15. Yang J. M., Li C. Y., Chen R. M., Zhou Q. F., Shung K. K., and Wang L. V., J. Biomed. Opt. 19, 066001 (2014) 10.1117/1.JBO.19.6.066001. [DOI] [PMC free article] [PubMed] [Google Scholar]
- 16. Wang B., Su J. L., Karpiouk A. B., Sokolov K. V., Smalling R. W., and Emelianov S. Y., IEEE J. Sel. Top. Quantum Electron. 16, 588 (2010). 10.1109/JSTQE.2009.2037023 [DOI] [PMC free article] [PubMed] [Google Scholar]
- 17. Allen T. J., Hall A., Dhillon A., Owen J. S., and Beard P. C., Proc. SPIE 7564, 75640C (2010) 10.1117/12.842205. [DOI] [Google Scholar]
- 18. Karpiouk A. B., Wang B., and Emelianov S. Y., Rev. Sci. Instrum. 81, 014901 (2010). 10.1063/1.3274197 [DOI] [PMC free article] [PubMed] [Google Scholar]
- 19. Jansen K., van der Steen A. F., van Beusekom H. M., Oosterhuis J. W., and van Soest G., Opt. Lett. 36, 597 (2011). 10.1364/OL.36.000597 [DOI] [PubMed] [Google Scholar]
- 20. Wei W., Li X., Zhou Q., Shung K. K., and Chen Z., J. Biomed. Opt. 16, 106001 (2011). 10.1117/1.3631798 [DOI] [PMC free article] [PubMed] [Google Scholar]
- 21. Wang B., Karpiouk A., Yeager D., Amirian J., Litovsky S., Smalling R., and Emelianov S., Opt. Lett. 37, 1244 (2012). 10.1364/OL.37.001244 [DOI] [PubMed] [Google Scholar]
- 22. Karpiouk A. B., Wang B., Amirian J., Smalling R. W., and Emelianov S. Y., J. Biomed. Opt. 17, 096008 (2012). 10.1117/1.JBO.17.9.096008 [DOI] [Google Scholar]
- 23. Zhang J., Yang S., Ji X., Zhou Q., and Xing D., J. Am. Coll Cardiol 64, 385 (2014). 10.1016/j.jacc.2014.04.053 [DOI] [PubMed] [Google Scholar]
- 24. Bai X., Gong X., Hau W., Lin R., Zheng J., Liu C., Zeng C., Zou X., Zheng H., and Song L., PLoS ONE 9, e92463 (2014). 10.1371/journal.pone.0092463 [DOI] [PMC free article] [PubMed] [Google Scholar]
- 25. Ji X., Xiong K., Yang S., and Xing D., Opt. Express 23, 9130 (2015). 10.1364/OE.23.009130 [DOI] [PubMed] [Google Scholar]
- 26. Wang P., Ma T., Slipchenko M. N., Liang S., Hui J., Shung K. K., Roy S., Sturek M., Zhou Q., Chen Z., and Cheng J. X., Sci. Rep. 4, 6889 (2014). 10.1038/srep06889 [DOI] [PMC free article] [PubMed] [Google Scholar]
- 27. Yeager D., Chen Y. S., Litovsky S., and Emelianov S., Theranostics 4, 36 (2014). 10.7150/thno.7143 [DOI] [PMC free article] [PubMed] [Google Scholar]
- 28. Wang P., Wang H. W., Sturek M., and Cheng J. X., J. Biophotonics 5, 25 (2012). 10.1002/jbio.201100102 [DOI] [PMC free article] [PubMed] [Google Scholar]
- 29. Li X., Li J. W., Jing J., Ma T., Liang S. S., Zhang J., Mohar D., Raney A., Mahon S., Brenner M., Patel P., Shung K. K., Zhou Q. F., and Chen Z. P., IEEE J. Sel. Top. Quantum Electron. 20, 7100108 (2014) 10.1109/JSTQE.2013.2274724. [DOI] [PMC free article] [PubMed] [Google Scholar]
- 30. America L. I. o., Vol. ANSI Z136.1–2007 ( American National Standards Institute, Inc., New York, 2007). [Google Scholar]
- 31. Cook J. R., Bouchard R. R., and Emelianov S. Y., Biomed. Opt. Express 2, 3193 (2011). 10.1364/BOE.2.003193 [DOI] [PMC free article] [PubMed] [Google Scholar]


