

Summary
Background
Comprehensive long-term data on atrial fibrillation trends in men and women are scant.
Methods
We investigated trends in atrial fibrillation incidence, prevalence, and risk factors, and in stroke and mortality following its onset in Framingham Heart Study participants (n=9511) from 1958 to 2007. To accommodate sex differences in atrial fibrillation risk factors and disease manifestations, sex-stratified analyses were performed.
Findings
During 50 years of observation (202,417 person-years), there were 1,544 new-onset atrial fibrillation cases (46.8% women). We observed about a fourfold increase in the age-adjusted prevalence and more than a tripling in age-adjusted incidence of atrial fibrillation (prevalence 20.4 versus 96.2 per 1000 person-years in men; 13.7 versus 49.4 in women; incidence rates in first versus last decade 3.7 versus 13.4 per 1000 person-years in men; 2.5 versus 8.6 in women, ptrend<0.0001).
For atrial fibrillation diagnosed by ECG during routine Framingham examinations, age-adjusted prevalence increased (12.6versus 25.7 per 1000 person-years in men; 8.1 versus 11.8 in women, ptrend<0.0001). The age-adjusted incidence increased, but did not achieve statistical significance. Although the prevalence of most risk factors changed over time, their associated hazards for atrial fibrillation changed little. Multivariable-adjusted proportional hazards models revealed a 73.5% decline in stroke and a 25.4% decline in mortality following atrial fibrillation onset (ptrend=0.0001, ptrend=0.003, respectively).
Interpretation
Our data suggest that observed trends of increased incidence of atrial fibrillation in the community were partially due to enhanced surveillance. Stroke occurrence and mortality following atrial fibrillation onset declined over the decades, and prevalence increased approximately fourfold. The hazards for atrial fibrillation risk factors remained fairly constant. Our data indicate a need for measures to enhance early detection of atrial fibrillation through increased awareness coupled with targeted screening programs, and risk factor-specific prevention.
Keywords: atrial fibrillation, secular trends, mortality
Introduction
With the aging of the population an epidemic of atrial fibrillation was predicted with 6-12 million people projected to be affected by the year 2050 in the United States, and 17.9 million in Europe by 2060.1-3 Atrial fibrillation represents a major public health problem with high comorbidity,4 increased mortality risk,5 and soaring health care costs.6
The reasons for the observed increase in atrial fibrillation prevalence are incompletely understood,7,8 but may include enhanced detection, rising incidence, improved survival in patients with cardiovascular conditions predisposing to atrial fibrillation, and greater survival following atrial fibrillation onset.9 Many prior studies of trends in atrial fibrillation were based on administrative or hospital databases, which may be subject to ascertainment biases. They provide evidence for an increase in prevalence1,2,7,8 and reduced mortality after atrial fibrillation onset.9 Some administrative data suggest increasing incidence of atrial fibrillation.1,8 But recent investigations of the incidence and prevalence of atrial fibrillation have varied widely.10,11 Whereas trends in atrial fibrillation epidemiology have been reported to be similar in direction in both sexes, the exact estimates have differed by sex with higher prevalence in men and variable incidence estimates in women.1,8
Greater awareness of atrial fibrillation and increased use of routine electrocardiograms (ECG) and extended electrocardiographic monitoring devices enhance the detection of atrial fibrillation, and thereby may increase the number of identified cases in the community, resulting in increases in incidence and prevalence due to enhanced surveillance. Long-term trends for atrial fibrillation prevalence, incidence, risk factors, and in stroke and mortality following the onset of atrial fibrillation in community-based cohorts have not been investigated systematically. With routine assessment of atrial fibrillation and its risk factors as well as cardiovascular outcomes during more than half a century of observation, the Framingham Heart Study provides a unique resource to monitor long-term trends in atrial fibrillation prevalence and incidence, risk factors, and outcomes in the community and may provide insights to guide future prevention strategies.
Methods
Study Sample and Oversight
The Framingham Heart Study began in 1948 with enrollment of the Original cohort (n=5209).12 The Offspring cohort (n=5124), comprising adult children of Original cohort participants and spouses of offspring, was enrolled in the early 1970s.13 Individuals who were between the ages of 50 and 89 years at the beginning of follow-up and free of atrial fibrillation were eligible for analyses (Original cohort n=4420, Offspring cohort n=5091). Due to small numbers, we did not include atrial fibrillation cases that occurred during the first decade (1948-1957) of study. Baseline risk factors, follow-up times, and incidence data were assigned to the decade of the index examination, i.e. the last examination prior to AF or censoring date but no more than 10 years earlier. Individuals contributed to time periods if they were free of atrial fibrillation at the beginning of a time period and contributed follow up during that period. The date of last follow-up was December 31, 2011.
All clinical characteristics were assessed from the index examination, which was identified for each individual for each time period. Study protocols were approved by the Boston University Medical Center Institutional Review Board. Participants provided informed consent.
Clinical Evaluations
During routine periodic Framingham clinic visits (about every two years in the Original cohort and every four to eight years in the Offspring cohort), participants completed standardized questionnaires, and a physical examination, and 12-lead ECG were obtained. Regular health status updates for cardiovascular disease included requests for hospitalization or outpatient records and ECGs. The diagnosis of atrial fibrillation (or atrial flutter) was made if at least two Framingham Heart Study cardiologists verified the rhythm abnormality on a collected ECG including Holter ECGs, telemetry or other monitoring information; whenever provided the actual tracings were reviewed. Efforts were made to collect outside ECGs of atrial fibrillation in all participants with the suspicion of the rhythm disorder. Stroke was diagnosed as a focal neurologic deficit characterized by a sudden onset and lasting for a minimum of 24 hours or until death if death occurred within 24 hours of symptom onset. Methods used to document, diagnose, ascertain, and classify cardiovascular diseases in the Framingham Heart Study have been published.14 We focused on consistently reported risk factors for atrial fibrillation that are easily obtainable and have been available over the total period of observation. We provide detailed information on ascertainment of other covariates in the Supplement.
Statistical Analysis
Individuals free of atrial fibrillation at the index examination were included in the analyses. The time periods examined were 1958-1967, 1968-1977, 1978-1987, 1988-1997, and 1998-2007. Age-adjusted period prevalence of atrial fibrillation was calculated using the number of prevalent atrial fibrillation cases divided by the person-time of follow up during each respective time period. We tested for statistical significance of trends over time periods by Poisson regression.15 We used the SAS procedure PROC GENMOD for trend testing. We calculated incidence rates for each 10-year age group, and for each time period. We performed sex-stratified analyses to understand possible differences by sex. In each cell, the incidence rate was calculated by dividing the number of atrial fibrillation events by the corresponding exposure time. We directly standardized incidence rates using the overall (sex- and time-pooled) age distribution grouped into 10-year intervals as the constant reference age distribution. We repeated calculations restricting atrial fibrillation cases to those diagnosed on routine Framingham clinic visit ECGs to account for potential ascertainment bias over time.
The distributions of atrial fibrillation risk factors among cases were calculated based on the last routine clinic visit attended prior to atrial fibrillation onset but no more than 10 years earlier. For individuals without atrial fibrillation, risk factors were assessed from the last clinic visit attended prior to the censoring date also within 10 years of the respective time period; the censoring date was either end of a decade, or last contact date or death date, whichever came first. The following risk factors were considered: age, current smoking, alcohol consumption, body mass index, systolic blood pressure, hypertension treatment, diabetes mellitus, electrocardiographic left ventricular hypertrophy, significant heart murmur with at least 3/6 systolic or any diastolic murmur, diagnosed heart failure, and myocardial infarction. For each risk factor a trend test was conducted to determine whether its prevalence (or mean) increased or decreased over time adjusting for age and sex using logistic regression models.
Proportional hazards models were applied (separately, for each time period and pooled by sex) to evaluate the association of each clinical risk factor with the development of atrial fibrillation after the proportionality assumption was tested and confirmed. We tested for linear trend over time periods in the log-hazards of risk factors for incident atrial fibrillation by including an interaction term between risk factor and period in the proportional hazard model. If the interaction term was significant (p<0.05), we concluded there was a trend in the log-hazard across decades, and vice versa.
Population attributable risk for each risk factor was calculated using the Rockhill approach modified for adjusted hazards ratios as outlined in the Supplement. Inputs were age- and sex-adjusted risk factor prevalence in cases and age- and sex-adjusted risk factor hazards ratios for atrial fibrillation incidence by time period. Each input was either constant or allowed to trend over time according to its statistical significance from trend tests mentioned above. Age- and sex-adjusted and multivariable-adjusted proportional hazards analyses were used to calculate hazards ratios for mortality after atrial fibrillation onset according to time period for the total sample and stratified by sex. Survival curves were adjusted for age of atrial fibrillation diagnosis.16 In secondary analyses we calculated adjusted hazards ratios for stroke after atrial fibrillation onset according to time period of atrial fibrillation onset. We used SAS version 9.2 for analyses. A two-tailed p-value of <0.05 was considered to indicate statistical significance.
Role of the funding source
The funder had no role in the design and conduct of the study; collection, management, analysis, and interpretation of the data; preparation, review, or approval of manuscript; or decision to submit the manuscript for publication. EJB, RBS and DL had full access to all the data in the study and had final responsibility for the decision to submit for publication.
Results
Participant Characteristics
Trends in incidence and prevalence
The 50-year observation period extended from 1958 to 2007 and comprised 202,417 person-years of follow up during which 1544 individuals (n=821 men, n=723 women) experienced new-onset atrial fibrillation ascertained from routine Framingham clinic visits and outside medical records. Period prevalence and incidence rates are shown in Table 1. Examining atrial fibrillation ascertained from all sources there was approximately a fourfold increase in age-adjusted period prevalence from the first to the last time period, 1958-1967 versus 1998-2007 (20.4 versus 96.2 per thousand in men; 13.7 versus 49.4 per thousand in women) with a statistically significant trend across time periods, ptrend<0.0001.
Table 1. Atrial Fibrillation Incidence Rates and Age-adjusted Period Prevalence by Sex and Decade.
| Decade of Atrial Fibrillation | ||||||
|---|---|---|---|---|---|---|
|
| ||||||
| 1958-1967 | 1968-1977 | 1978-1987 | 1988-1997 | 1998-2007 | P for Trend* | |
| Men | ||||||
| No. at risk | 1925 | 2399 | 2569 | 2595 | 2128 | |
| Person-years at risk | 14044 | 17448 | 19223 | 19196 | 17270 | |
| Mean age, years† | 55·0±5•8 | 58•6±8•1 | 60•4±9•9 | 60•8±10•6 | 63•1±10•5 | |
| Atrial fibrillation cases, no. | 40 | 101 | 166 | 266 | 248 | |
| Crude incidence rate | 2•85 | 5•79 | 8•64 | 13•86 | 14•36 | <0•0001 |
| Age-adjusted incidence rate§ | 3•70 | 7•31 | 9•07 | 14•32 | 13•37 | <0•0001 |
| Age-adjusted period prevalence | 20•4 | 37•7 | 52•3 | 81•8 | 96•2 | <0•0001 |
| Atrial fibrillation based on Framingham Heart Study clinic ECGs | ||||||
| Atrial fibrillation cases, no. | 23 | 38 | 56 | 70 | 81 | |
| Crude incidence rate | 1•61 | 2•12 | 2•81 | 3•43 | 4•30 | <0•0001 |
| Age-adjusted incidence rate§ | 1•83 | 2•55 | 2•86 | 3•35 | 3•75 | 0•06 |
| Age-adjusted period prevalence | 12•6 | 19•1 | 24•0 | 25•7 | 25•7 | 0•0007 |
|
| ||||||
| Women | ||||||
| No. at risk | 2401 | 2924 | 3174 | 3315 | 2857 | |
| Person-years at risk | 18356 | 23360 | 25254 | 25046 | 23220 | |
| Mean age, years† | 55•0±5•8 | 59•6±8•4 | 62•7±10•7 | 62•9±11•8 | 64•7±11•9 | |
| Atrial fibrillation cases, no. | 35 | 90 | 161 | 194 | 243 | |
| Crude incidence rate | 1•91 | 3•85 | 6•38 | 7•75 | 10•47 | <0•0001 |
| Age-adjusted incidence rate§ | 2•52 | 4•69 | 5•47 | 6•14 | 8•55 | <0•0001 |
| Age-adjusted period prevalence | 13•7 | 25•1 | 29•5 | 34•3 | 49•4 | <0.0001 |
| Atrial fibrillation based on Framingham Heart Study clinic ECGs | ||||||
| Atrial fibrillation cases, no. | 21 | 46 | 51 | 50 | 52 | |
| Crude incidence rate | 1•10 | 1•88 | 1•93 | 1•91 | 2•13 | 0•03 |
| Age-adjusted incidence rate§ | 1•31 | 2•11 | 1•64 | 1•40 | 1•58 | 0•13 |
| Age-adjusted period prevalence | 8•1 | 14•8 | 13•9 | 12•6 | 11•8 | 0•009 |
Age 50-89 years, free of atrial fibrillation.
P for trend was obtained using Poisson Regression.
Mean age is for the population at risk for development of atrial fibrillation. Age is the earliest eligible age within a decade.
Atrial fibrillation incidence rates are per 1000 person-years of follow up.
Atrial fibrillation prevalence rates are person-years lived by atrial fibrillation individuals per 1000 total person-years lived during each period, i.e. by all person-years contributed by survivors at the beginning of the period. Atrial fibrillation cases include all those participants who developed atrial fibrillation in or before the corresponding period.
Adjusted incidence rates were calculated using direct standardization of sex-pooled and time-pooled 10-year age groups. For the first period, given that there was no subject in the 80-90 age group, the incidence rates were standardized to the overall distribution among the remaining age groups only.
Similarly, the age-adjusted incidence of atrial fibrillation identified from all sources increased progressively over time (ptrend<0.0001). Age-adjusted incidence was 3.7 in the first versus 13.4 per 1000 person-years in the most recent time period in men and 2.5 versus 8.5 per 1000 person-years in women, respectively. A visual summary of trends in incidence and prevalence of atrial fibrillation is provided in Supplementary Figure 1. The sources of first diagnosis of atrial fibrillation are presented in Supplementary Table 1. Whereas the first diagnosis on Framingham clinic electrocardiograms decreased, first detection on outside records markedly increased over decades.
Trends in prevalence and incidence in Framingham clinic ECG diagnosed atrial fibrillation
In secondary analyses, increases over time in period prevalence were less pronounced but remained significant when analyses were restricted to atrial fibrillation detected on Framingham Study clinic visit ECGs (ptrend=0.0007 in men, ptrend=0.009 in women) (Table 1). In contrast, trends in incidence of atrial fibrillation also increased but did not reach statistical significance among cases observed on routine Framingham clinic visit ECGs (ptrend=0.06 in men, ptrend=0.13 in women).
The age-adjusted prevalence of risk factors at time of atrial fibrillation onset for both sexes is reported in Table 2. Individuals who had no eligible index clinic visits were excluded from this analysis (n=179). The admixture of underlying risk factors changed substantially over the decades. Smoking and heavy alcohol consumption decreased over time. The prevalence of obesity and diabetes increased. The distribution of hypertension categories preceding atrial fibrillation cases shifted downward (less hypertensive), whereas rates of hypertension treatment increased. Prevalence of electrocardiographic left ventricular hypertrophy, significant murmur, and heart failure declined over time whereas the proportion of atrial fibrillation cases with prior myocardial infarction remained fairly constant. Sex-specific results for risk factor prevalence at the start of each time period for participants with atrial fibrillation are provided in Supplementary Table 2. Women with atrial fibrillation were older and tended to have a more beneficial risk factor profile except for blood pressure despite a higher proportion of hypertension treatment. Trends in risk factors were very similar in both sexes except for smoking which showed a decline in men, but not in women.
Table 2. Prevalence (%) of Baseline Characteristics in Individuals with New Onset Atrial Fibrillation.
| No. atrial fibrillation | Decade | P for Trend† | Trend Direction | ||||
|---|---|---|---|---|---|---|---|
| 1958-1967 | 1968-1977 | 1978-1987 | 1988-1997 | 1998-2007 | |||
| 70 | 178 | 284 | 399 | 434 | |||
| Current smoking | 27(40•9) | 35(22•3) | 60(21•7) | 62(15•6) | 55(12•7) | 0•0002 | ↓ |
| Alcohol consumption | |||||||
| None | 25(42•4) | 53(31•7) | 127(46•7) | 168(42•7) | 186(44•0) | 0•64 | - |
| Mild | 28(47•5) | 92(55•1) | 122(44•9) | 200(50•9) | 214(50•6) | 0•28 | - |
| Moderate or heavy | 6(10•2) | 22(13•2) | 23(8•5) | 25(6•4) | 23(5•4) | 0•005 | ↓ |
| Body mass index, kg/m2 | |||||||
| Normal, <25 | 20(30•3) | 56(35•7) | 107(39•9) | 115(30•4) | 105(27•7) | 0•0009 | ↓ |
| Overweight, 25 to <30 | 28(42•4) | 68(43•3) | 101(37•7) | 173(45•8) | 140(36•9) | 0•42 | - |
| Obese, ≥30 | 18(27•3) | 33(21•0) | 60(22•4) | 90(23•8) | 134(35•4) | <0•0001 | ↑ |
| Systolic blood pressure, mm Hg | |||||||
| Optimal, <120 | 20(30•3) | 56(35•7) | 107(39•9) | 115(30•4) | 105(27•7) | <0•0001 | ↑ |
| Normal, 120-129 | 28(42•4) | 68(43•3) | 101(37•7) | 173(45•8) | 140(36•9) | 0•001 | ↑ |
| High-normal 130-139 | 18(27•3) | 33(21•0) | 60(22•4) | 90(23•8) | 134(35•4) | 0•009 | ↑ |
| Stage I hypertension, 140-159 | 20(30•3) | 56(35•7) | 107(39•9) | 115(30•4) | 105(27•7) | 0•001 | ↓ |
| Stage II-IV hypertension ≥160 | 28(42•4) | 68(43•3) | 101(37•7) | 173(45•8) | 140(36•9) | <0•0001 | ↓ |
| Hypertension treatment | 15(22•1) | 55(32•9) | 135(47•7) | 219(55•4) | 257(59•8) | <0•0001 | ↑ |
| Diabetes | 4(5•7) | 25(14•0) | 44(15•7) | 66(16•7) | 80(19•6) | 0•004 | ↑ |
| Electrocardiographic left ventricular hypertrophy | 9(12•9) | 21(11•8) | 19(6•9) | 23(6•2) | 12(2•9) | <0•0001 | ↓ |
| Significant heart murmur | 14(20•0) | 32(18•9) | 52(19•2) | 42(10•7) | 31(8•1) | <0•0001 | ↓ |
| Prevalent heart failure | 4(5•7) | 15(8•4) | 17(6•0) | 23(5•8) | 15(3•5) | 0•009 | ↓ |
| Prevalent myocardial infarction | 6(8•6) | 16(9•0) | 27(9•5) | 45(11•3) | 47(10•8) | 0•27 | - |
All entries are in percentages.
In total 1365 (88•4%) atrial fibrillation cases were identified with index exams. The remaining 179 were excluded from this analysis for missing eligible index exams.
This table presents the age- and sex-adjusted prevalence of baseline characteristics for atrial fibrillation cases with index examination. For each characteristic, prevalence in different decades are predicted values from a logistic model where the characteristic is the outcome variable, decade as main predictor if the trend test is significant, with age and sex as covariates. The observed prevalence by sex is presented in Supplementary Table 2.
P-values are obtained from logistic models adjusting for age and sex fitted on observed data.
The prevalence may not add up to exactly 1 for multiple categorical variables because of rounding.
Age- and sex-adjusted hazards ratios for clinical risk factors in relation to atrial fibrillation incidence by time period are provided in Table 3. Hazards ratios of most risk factors in relation to their association with atrial fibrillation remained similar across the time periods; advancing age carried the highest risk of developing atrial fibrillation. The unstable estimates in the first decades are due to a limited number of atrial fibrillation cases in the earliest time periods. Over time we observed declining hazards for hypertension, significant heart murmur and heart failure.
Table 3. Trends in Hazards Ratios of Incident Atrial Fibrillation for Risk Factors Across Time Periods.
| No. individuals | Decade of Atrial Fibrillation Onset Age- and Sex-Adjusted Hazards Ratios (95% Confidence Interval) |
P for Trend | ||||
|---|---|---|---|---|---|---|
| 1958-1967 4292 |
1968-1977 5119 |
1978-1987 5151 |
1988-1997 5235 |
1998-2007 4295 |
||
| Male vs. Female | 1•60(1•00-2•57) | 1•84(1•36-2•47) | 1•67(1•32-2•11) | 2•10(1•71-2•57) | 1•49(1•23-1•80) | 0•76 |
| Age, years | ||||||
| 50-59 (referent) | 1•00 | 1•00 | 1•00 | 1•00 | 1•00 | |
| 60-69 | 3•48(1•96-6•19) | 9•38(5•49-16•0) | 3•89(2•57-5•89) | 2•42(1•67-3•50) | 4•98(3•49-7•10) | 0•56 |
| 70-79 | 3•00(1•42-6•36) | 12•3(7•20-21•0) | 4•53(3•00-6•85) | 6•05(4•34-8•43) | 7•35(5•28-10•2) | 0•27 |
| 80-89 | -- | -- | 7•39(4•80-11•4) | 7•83(5•49-11•2) | 9•33(6•68-13•0) | 0•59 |
| Current smoking | 0•96(0•57-1•62) | 0•74(0•50-1•10) | 1•00(0•74-1•34) | 1•01(0•77-1•34) | 0•99(0•74-1•32) | 0•18 |
| Alcohol consumption, % | ||||||
| None (referent) | 1•00 | 1•00 | 1•00 | 1•00 | 1•00 | |
| Mild | 0•82(0•47-1•44) | 1•04(0•73-1•48) | 0•85(0•66-1•11) | 1•21(0•98-1•50) | 1•07(0•88-1•31) | 0•07 |
| Moderate or heavy | 0•82(0•33-2•04) | 2•20(1•31-3•72) | 0•86(0•55-1•35) | 1•31(0•85-2•03) | 1•10(0•71-1•69) | 0•91 |
| Body mass index, kg/m2 | ||||||
| Normal, <25 (referent) | 1•00 | 1•00 | 1•00 | 1•00 | 1•00 | |
| Overweight, 25 to <30 | 1•43(0•81-2•56) | 1•17(0•82-1•67) | 1•02(0•77-1•34) | 1•27(1•00-1•62) | 1•13(0•87-1•46) | 0•92 |
| Obese, ≥30 | 2•63(1•39-4•99) | 2•04(1•32-3•15) | 1•47(1•07-2•03) | 1•33(1•01-1•76) | 1•37(1•05-1•78) | 0•19 |
| Systolic blood pressure, mm Hg | ||||||
| Optimal, <120 (referent) | 1•00 | 1•00 | 1•00 | 1•00 | 1•00 | |
| Normal, 120-129 | 1•76(0•59-5•25) | 0•53(0•26-1•07) | 0•75(0•46-1•21) | 1•11(0•76-1•61) | 0•94(0•69-1•29) | 0•71 |
| High-normal 130-139 | 1•29(0•42-3•95) | 0•79(0•43-1•45) | 0•97(0•63-1•49) | 1•27(0•89-1•81) | 1•19(0•89-1•60) | 0•53 |
| Stage I Hypertension, 140-159 | 1•95(0•73-5•21) | 1•39(0•83-2•34) | 1•16(0•79-1•72) | 1•47(1•06-2•03) | 0•89(0•67-1•19) | 0•01* |
| Stage II-IV Hypertension ≥160 | 2•63(1•00-6•93) | 1•36(0•79-2•32) | 1•21(0•79-1•85) | 1•28(0•89-1•83) | 1•15(0•84-1•58) | 0•02* |
| Hypertension treatment | 1•71(0•96-3•06) | 1•63(1•18-2•27) | 1•35(1•06-1•71) | 1•68(1•37-2•06) | 1•32(1•08-1•60) | 0•31 |
| Diabetes | 1•06(0•38-2•90) | 1•42(0•93-2•17) | 1•59(1•15-2•20) | 1•49(1•15-1•95) | 1•25(0•98-1•60) | 0•58 |
| Electrocardiographic LVH | 3•12(1•54-6•33) | 2•41(1•52-3•81) | 1•95(1•22-3•13) | 2•49(1•63-3•82) | 2•15(1•21-3•83) | 0•40 |
| Significant heart murmur | 6•19(3•43-11•2) | 2•84(1•92-4•20) | 3•31(2•41-4•54) | 1•92(1•39-2•67) | 1•58(1•09-2•29) | 0•0003* |
| Heart failure | 2•62(0•95-7•25) | 3•15(1•84-5•41) | 2•33(1•42-3•82) | 2•36(1•54-3•62) | 1•43(0•85-2•40) | 0•01* |
| Myocardial infarction | 2•45(1•04-5•79) | 1•70(1•01-2•86) | 1•66(1•11-2•49) | 1•58(1•16-2•16) | 1•46(1•07-1•98) | 0•19 |
Decreasing hazards ratios over decades.
Characteristics were assessed at index examinations. For atrial fibrillation cases, the index examination was the last examination attended prior to atrial fibrillation diagnosis but no more than 10 years earlier; For individuals without atrial fibrillation, it was the last examination prior to censoring date also within 10 years, where censoring date was either end of a decade, or last contact date or death date whichever came first.
Hazard ratios are expressed for the condition present in dichotomous variables.
Categories for alcohol consumption were mild alcohol consumption: 1-7 drinks per week in women, 1-14 drinks per week in men, moderate or heavy alcohol consumption: >7 drinks per week in women, >14 drinks per week in men.
P for trend was obtained by testing whether the regression coefficient of interaction term of risk factor and period in Cox model equals 0. For trend time periods were coded 1(1958-1967), 2(1968-1977), 3(1978-1987), 4(1989-1997) and 5(1998-2007). For details on the statistics please see the Supplementary Material.
Due to fairly stable hazards ratios over time, trends in population attributable risk largely reflected changes in prevalence of risk factors (Table 4). We observed increases over time in population attributable risks for higher body mass index and diabetes. We noted a decrease in attributable risk for higher blood pressure whereas a substantial increase in population attributable risk for hypertension treatment was seen. In addition, decreases in electrocardiographic left ventricular hypertrophy, valvular heart disease, and heart failure. Among modifiable atrial fibrillation risk factors, body mass index and blood pressure combined with antihypertensive treatment carried the greatest population attributable risks in the most recent data.
Table 4. Population Attributable Risks of Incident Atrial Fibrillation Risk Factors Across Time Periods.
| Decade of Atrial Fibrillation Onset Age- and Sex-Adjusted Hazards Ratios (95% CI) |
Trend | |||||
|---|---|---|---|---|---|---|
| 1958-1967 | 1968-1977 | 1978-1987 | 1988-1997 | 1998-2007 | ||
| Current smoking | Not contributing | Not contributing | Not contributing | Not contributing | Not contributing | |
| Alcohol consumption | Not contributing | Not contributing | Not contributing | Not contributing | Not contributing | |
| Body mass index | 12•0 | 12•9 | 14•1 | 15•4 | 16•9 | ↑ |
| Systolic blood pressure | 47•3 | 33•0 | 19•9 | 8•3 | -2•1 | ↓ |
| Hypertension treatment | 9•8 | 12•0 | 14•5 | 17•0 | 19•5 | ↑ |
| Diabetes | 3•2 | 3•7 | 4•4 | 5•1 | 5•9 | ↑ |
| Electrocardiographic LVH | 10•4 | 6•9 | 4•5 | 2•9 | 1•8 | ↓ |
| Significant heart murmur | 21•9 | 15•4 | 10•1 | 6•1 | 3•1 | ↓ |
| Heart failure | 7•8 | 5•6 | 3•9 | 2•5 | 1•4 | ↓ |
| Myocardial infarction | 3•6 | 3•6 | 3•6 | 3•6 | 3•6 | - |
For risk factors without trend in prevalence, the average predicted prevalence from logistic models with age and sex as predictors (Table 2) were used in population attributable risk calculation; for factors with trend in prevalence, the average predicted prevalence from logistic models with age, sex and period as predictors were used in population attributable risk.
Risk factors with non-significant hazards ratios (p-value >0.05) were deemed not contributing (Supplementary Table 3-1). For risk factors without trend in hazards ratio, the constant hazards ratio estimated from Cox models with age, sex, period and risk factors as predictors (Supplementary Table 3-1) were used in population attributable risk calculation; for factors with trend in hazards ratio, the hazards ratios from Cox models with age, sex, period, risk factors, and period and risk factor interaction as predictors (Supplementary Table 3-2) were used in population attributable risk.
Mortality after atrial fibrillation onset
Survival following new onset atrial fibrillationis presented in Figure 1. Improvements over time in age-adjusted survival following the onset of atrial fibrillation were observed in men and women (p<0.0001 for both sexes). Risk factor-adjusted hazards ratios for mortality are depicted in Supplementary Table 4. We observed a 25.4% (hazard ratio from 1.34 to 1.0, p=0.003) decrease over time in multivariable-adjusted mortality following atrial fibrillation onset comparing the first with the most current time period. Trends were similar in sex-stratified analyses. Age-adjusted survival rates for 5 year intervals by decade of atrial fibrillation onset are presented in Supplementary Table 5. They showed enhanced survival rates over the observational periods in both sexes.
Figure 1.
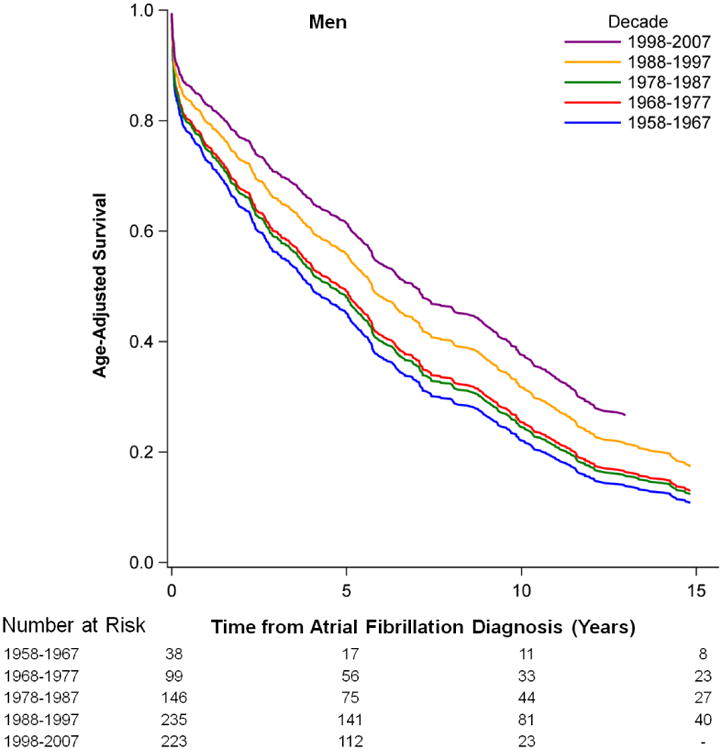

Age-adjusted Survival after the New Onset of Atrial Fibrillation by Sex and Time Period.
Stroke incidence after atrial fibrillation onset
Adjusted hazards ratios for stroke in 20 years after atrial fibrillation onset revealed a decline in stroke riskof 73.5% in the most recent compared with the earliest time period. (Supplementary Table 6). Multivariable-adjusted hazards ratios significantly declined from 3.77 in the earliest time period to 1.0 in the most current time period, p=0.0001. Trends were similar in sex-stratified analyses, but did not reach statistical significance in men.
Discussion
Over the course of 50 years of observation of a community-based sample, we observed an increasing prevalence and incidence of atrial fibrillation cases accompanied by improved survival and lower risk for stroke following its onset. When restricting our analyses to atrial fibrillation cases detected during routine Framingham Heart Study clinic visits (i.e. uniform ascertainment), the increase in prevalence of atrial fibrillation persisted, but the trend in incidence was far less pronounced and did not reach statistical significance. Whereas the prevalence of atrial fibrillation risk factors has changed over time, their hazards ratios for atrial fibrillation changed only modestly. We analyzed population attributable risk over time and observed increases in the attributable risk for atrial fibrillation due to higher body mass index and diabetes. We found significant declines in the attributable risks due to electrocardiographic left ventricular hypertrophy, significant heart murmurs, and heart failure. Trends were similar in both sexes. In addition, we observed an approximately 25.4% decline in fatality and a 73.5% decline in stroke risk following the onset of atrial fibrillation in the earliest compared to the most contemporary time period.
Prior investigations have shown an increase in atrial fibrillation prevalence in the industrialized world from the 1970s to the turn of the 21st century,7,8 and our data suggest that this trend is continuing. In parallel, hospital admissions and health care utilization due to atrial fibrillation have risen,9 potentially as a result of better awareness of atrial fibrillation as a life threatening disorder. In addition, prevalence may have increased due to declining atrial fibrillation case fatality,9 with improved therapies for cardiovascular disease (e.g. myocardial infarction and heart failure),17 and increasing use of anticoagulation18 in patients with atrial fibrillation. Despite a limited number of individuals with atrial fibrillation and secondary stroke in the current sample we demonstrateda decline across decades in strokes occurring in individuals diagnosed with atrial fibrillation. Our findings are in line with recently published data on a decline in stroke rates including thromboembolic strokes during the last few decades.19 These results may indicate that specific treatment of atrial fibrillation patients may have reduced adverse outcomes including stroke and mortality.
The dual findings of rising prevalence and longer survival following atrial fibrillation onset may be attributable, in part, to earlier detection of the disease due to better surveillance methods (i.e. lead-time bias due to more frequent electrocardiographic monitoring in recent decades). To account for this potential ascertainment bias, we repeated analyses using only the ECGs from routine periodic Framingham Heart Study clinic visit ECGs. Routinely registered ECGs confirmed the increase in prevalence of atrial fibrillation; however, the trend in incidence rates was no longer statistically significant. Trends in atrial fibrillation frequency in men were paralleled in women with lower absolute numbers. Similar sex differences have been reported in recent projections of atrial fibrillation disease distribution,1,2 In contrast to Icelandic data, in our cohort atrial fibrillation incidence showed an increase in trend in both, men and women.8 Of note, mortality rates in women with manifest atrial fibrillation were almost as high as in men consistent with prior publications.20
Changes in prevalence and hazards of risk factors
We confirmed an approximate doubling of incidence of atrial fibrillation with each decade of advancing age above 60 years. We observed notable trends in prevalence of several atrial fibrillation risk factors over time in both sexes; in contrast, the strength of association of risk factors with incidence of atrial fibrillation changed only modestly over time. Sex differences in classical atrial fibrillation risk factors known from prior reports persisted during the observational period.21 Early diagnosis and effective treatments for valvular heart disease and heart failure22,23 may have contributed to a decrease in the risk of developing atrial fibrillation and a decline in attributable risk.
The greatest attributable risk of all modifiable risk factors was observed for hypertension and its treatment. Across the decades of follow up, mean systolic blood pressure levels and prevalence of electrocardiographic left ventricular hypertrophy, an indicator of hypertensive target-organ damage, declined, likely due to a doubling in hypertension treatment.24 Such trends may be a result of better awareness, treatment, and control of hypertension.25 Observational data indicate that improved blood pressure control is associated with reduced incidence of atrial fibrillation.26 Clinical trials suggest a decline in atrial fibrillation incidence with blood pressure control and regression of electrocardiographic left ventricular hypertrophy.27 But atrial fibrillation was not systematically collected as a primary endpoint in prior hypertension treatment trials and more randomized data need to be collected to determine the consequences and optimal levels of blood pressure lowering on atrial fibrillation prevention. The continuing trend of rising body mass index and diabetes, which contributed to the increases in population attributable risks for atrial fibrillation, may be a harbinger of future trends. The extent to which changes in population attributable risk may explain observed trends in atrial fibrillation prevalence needs to be investigated in larger data sets.
Limitations and Strengths
The number of atrial fibrillation cases in the first decades of observation was small and may provide unstable estimates. For low frequency conditions the standard errors of the hazards ratios were large and we had limited power to detect trends across decades. Different inter-examination intervals for Original cohort and Offspring participants may be related to the number of atrial fibrillation cases observed in Framingham clinic ECGs and thus, may have biased estimates of disease distribution. We did not distinguish between atrial fibrillation and atrial flutter, or until recent years between atrial fibrillation patterns (e.g. paroxysmal vs. persistent), so we cannot comment on temporal trends among these atrial fibrillation subsets. We acknowledge that our ascertainment of atrial fibrillation may be biased towards longer-lasting atrial fibrillation and more severely affected individuals; there is increasing awareness of clinically unrecognized atrial fibrillation.28 Since the Framingham sample used for this analysis is of European descent, our results may not be representative for other races/ethnicities. Whereas prior investigations assessing trends in prevalence and incidence of atrial fibrillation were mainly referral-based or used administrative databases, the Framingham Heart Study provides a unique setting with continuous data collection and outcome ascertainment in a community-based sample.
Assessment of variation in the risk factors associated with atrial fibrillation is an important step in understanding the changes in atrial fibrillation prevalence over time. Increased body mass index, for example, carries one of the largest attributable risk of all modifiable atrial fibrillation risk factors and suggests a potential preventive treatment strategy through weight loss. Public efforts have been successful in reducing the risk factor burden for cardiovascular disease.29 Lower incidence of coronary heart disease, better control of risk factors, and evidence-based therapies seem to have effectively lowered hospitalizations for heart failure.30 Although longer survival following atrial fibrillation onset may indicate therapeutic successes for atrial fibrillation and its underlying risk factors, the increase in atrial fibrillation prevalence is indicative of a mounting future burden.
Given the increasing prevalence of atrial fibrillation our study can suggest three major goals in clinic and public health: The awareness of atrial fibrillation as a serious disease needs to be further enhanced, efficient screening needs to be implemented, and modifiable risk factors, before all hypertension and body mass index, should be explored as potential preventive targets.
In conclusion, our data from a large community-based cohort show that increases in prevalence of atrial fibrillation in both sexes may be explained by longer survival following atrial fibrillation onset. In contrast, increasing incidence rates appear to be due, in part, to changes in awareness, ascertainment, and coding practices over the past 50 years. The significant trend in increasing prevalence underscores the need for additional research into better screening and interventions to prevent atrial fibrillation and its adverse consequences.
Supplementary Material
Research In Context.
Systematic review
For over a decade it has become apparent that atrial fibrillation is a disease of increasing importance in aging populations worldwide.1-3 Related morbidity and healthcare costs are substantial.4-6 However, it is not completely clear why atrial fibrillation prevalence is increasing. Higher prevalence may be related to increased incidence and lower case fatality. Over the last years the recognition of atrial fibrillation as a relevant cardiac disease may have contributed to increased awareness of the problem. Detection of an often intermittent disease is central for the diagnosis, and the number of identified cases in the community may have increased due to better screening. Furthermore, survival following atrial fibrillation manifestation may have improved.9
Most prior reports on trends in atrial fibrillation were based on administrative or hospital databases, which are subject to ascertainment biases,1,7-9 leading to a wide variation in incidence and prevalence estimates.10,11 Whereas the growing burden of atrial fibrillation has identified in many studies, true long-term trends in atrial fibrillation incidence and mortality in a community-based cohort have not been investigated systematically.
To target preventive measures, a critical first step is understanding risk factor associations and their population attributable risk. The population attributable risk of known risk indicators for atrial fibrillation and the change in that risk over decades have not been investigated in depth. The community-based Framingham Heart Study provides a unique setting with continuous risk factor and atrial fibrillation ascertainment over more than five decades.
Interpretation
Our data reveal several important observations. The likely contribution of improved atrial fibrillation awareness to trends in incidence and prevalence is suggested by a comparison of results from all newly diagnosed AF cases versus those detected using routine ascertainment based on the Framingham clinic visit ECG only. The prevalence of most modifiable risk factors has changed over time; but the associated hazards for atrial fibrillation have remained fairly constant. Atrial fibrillation incidence rates are not declining and survival of patients with AF is longer. Improved outcomes may arise from successful although often complex and costly treatment of atrial fibrillation and from earlier detection (lead time) due to heightened awareness and improved surveillance. Although many AF cases still suffer complications such as stroke and heart failure, based on the current study we speculate that earlier detection and successful prevention of AF sequelae may reduce mortality.
The growing burden of AF merits consideration of public health approaches to enhance early detection through increased awareness coupled with targeted screening programs, as well as risk factor-specific prevention.
Acknowledgments
Funding: Supported by NIH/NHLBI contract N01-HC-25195 and NIH grants 1RC1HL101056; HL102214; AG028321 (EJB); 2R01HL092577 (EJB, PTE); 1R01HL092577; 1RC1HL101056; 1R01HL102214; 1R01AG028321 R01HL104156, 1K24HL105780 (PTE); HL080124, HL077477, HL71039, HL093328 (RSV); 6RO1-NS-17950 (PAW, SS, AB); American Heart Association Established Investigator Award 13EIA14220013 (PTE), and the Division of Intramural Research of the National Heart, Lung, and Blood Institute, National Institutes of Health (DL). Deutsche Forschungsgemeinschaft (German Research Foundation) Emmy Noether Program SCHN 1149/3-2 (RBS); HL080025, Doris Duke Charitable Foundation Clinical Scientist Development Award and Burroughs Wellcome Fund Career Award for Medical Scientists (CNC); NIH/NHLBI 1K23HL114724 (SAL). Partial salary support is additionally provided by National Institute of Health grants 1U01HL105268-01 (DDM) and KL2RR031981 (DDM).
Footnotes
Contributors: Drs Benjamin and Levy had full access to all of the data in the study and take responsibility for the integrity of the data and the accuracy of the data analysis. RBS, XY, PG, MGL, EJB, DL designed the study. RBS, CNC, PAW, SAL, SS, PAW, EJB, DL acquired the data. RBS, XY, PG, MGL, ASB, DDM, SAL, JMM, RSV, EJB, DL analyzed and interpreted the data. XY, MGL, DDM, CNC, SAL, JMM, PTE, SS, PAW, EJB critically revised the manuscript for important intellectual content; XY, PG, MGL, ASB performed the statistical analyses of the data. EJB, DL obtained the funding. RBS wrote the first draft and submitted the final version of the report. All authors have seen the final submitted article and agree with its contents.
Declaration of interests: We declare that we have no competing interests.
Publisher's Disclaimer: This is a PDF file of an unedited manuscript that has been accepted for publication. As a service to our customers we are providing this early version of the manuscript. The manuscript will undergo copyediting, typesetting, and review of the resulting proof before it is published in its final citable form. Please note that during the production process errors may be discovered which could affect the content, and all legal disclaimers that apply to the journal pertain.
References
- 1.Miyasaka Y, Barnes ME, Gersh BJ, Cha SS, Bailey KR, Abhayaratna WP, et al. Secular trends in incidence of atrial fibrillation in Olmsted County, Minnesota, 1980 to 2000, and implications on the projections for future prevalence. Circulation. 2006;114:119–25. doi: 10.1161/CIRCULATIONAHA.105.595140. [DOI] [PubMed] [Google Scholar]
- 2.Krijthe BP, Kunst A, Benjamin EJ, Lip GY, Franco OH, Hofman A, et al. Projections on the number of individuals with atrial fibrillation in the European Union, from 2000 to 2060. Eur Heart J. 2013;34:2746–51. doi: 10.1093/eurheartj/eht280. [DOI] [PMC free article] [PubMed] [Google Scholar]
- 3.Chugh SS, Havmoeller R, Narayanan K, Singh D, Rienstra M, Benjamin EJ, et al. Worldwide epidemiology of atrial fibrillation: a Global Burden of Disease 2010 Study. Circulation. 2014;129:837–47. doi: 10.1161/CIRCULATIONAHA.113.005119. [DOI] [PMC free article] [PubMed] [Google Scholar]
- 4.Andersson T, Magnuson A, Bryngelsson IL, Frobert O, Henriksson KM, Edvardsson N, et al. All-cause mortality in 272,186 patients hospitalized with incident atrial fibrillation 1995-2008: a Swedish nationwide long-term case-control study. Eur Heart J. 2013;34:1061–7. doi: 10.1093/eurheartj/ehs469. [DOI] [PMC free article] [PubMed] [Google Scholar]
- 5.Wattigney WA, Mensah GA, Croft JB. Increased atrial fibrillation mortality: United States, 1980-1998. Am J Epidemiol. 2002;155:819–26. doi: 10.1093/aje/155.9.819. [DOI] [PubMed] [Google Scholar]
- 6.Kim MH, Johnston SS, Chu BC, Dalal MR, Schulman KL. Estimation of total incremental health care costs in patients with atrial fibrillation in the United States. Circ Cardiovasc Qual Outcomes. 2011;4:313–20. doi: 10.1161/CIRCOUTCOMES.110.958165. [DOI] [PubMed] [Google Scholar]
- 7.Go AS, Hylek EM, Phillips KA, Chang Y, Henault LE, Selby JV, et al. Prevalence of diagnosed atrial fibrillation in adults: national implications for rhythm management and stroke prevention: the AnTicoagulation and Risk Factors in Atrial Fibrillation (ATRIA) Study. JAMA. 2001;285:2370–5. doi: 10.1001/jama.285.18.2370. [DOI] [PubMed] [Google Scholar]
- 8.Stefansdottir H, Aspelund T, Gudnason V, Arnar DO. Trends in the incidence and prevalence of atrial fibrillation in Iceland and future projections. Europace. 2011;13:1110–7. doi: 10.1093/europace/eur132. [DOI] [PubMed] [Google Scholar]
- 9.Frost L, Vestergaard P, Mosekilde L, Mortensen LS. Trends in incidence and mortality in the hospital diagnosis of atrial fibrillation or flutter in Denmark, 1980-1999. Int J Cardiol. 2005;103:78–84. doi: 10.1016/j.ijcard.2004.08.024. [DOI] [PubMed] [Google Scholar]
- 10.Piccini JP, Hammill BG, Sinner MF, Jensen PN, Hernandez AF, Heckbert SR, et al. Incidence and prevalence of atrial fibrillation and associated mortality among Medicare beneficiaries, 1993-2007. Circ Cardiovasc Qual Outcomes. 2012;5:85–93. doi: 10.1161/CIRCOUTCOMES.111.962688. [DOI] [PMC free article] [PubMed] [Google Scholar]
- 11.Colilla S, Crow A, Petkun W, Singer DE, Simon T, Liu X. Estimates of current and future incidence and prevalence of atrial fibrillation in the U.S. adult population. Am J Cardiol. 2013;112:1142–7. doi: 10.1016/j.amjcard.2013.05.063. [DOI] [PubMed] [Google Scholar]
- 12.Dawber T, Meadors G, Moore F., Jr Epidemiological approaches to heart disease: the Framingham Study. Am J Public Health Nations Health. 1951;41:279–81. doi: 10.2105/ajph.41.3.279. [DOI] [PMC free article] [PubMed] [Google Scholar]
- 13.Feinleib M, Kannel WB, Garrison RJ, McNamara PM, Castelli WP. The Framingham Offspring Study. Design and preliminary data. Prev Med. 1975;4:518–25. doi: 10.1016/0091-7435(75)90037-7. [DOI] [PubMed] [Google Scholar]
- 14.Abbott RD, McGee DL. The Framingham Study: An Epidemiological Investigation of Cardiovascular Disease Section 37: The Probability of Developing Certain cardiovascular Diseases in Eight Years at Specified Values of Some Characteristics. 1987 [Google Scholar]
- 15.Cameron AC, Trivedi PK. Regression Analysis of Count Data. New York: Cambridge Press; 1998. [Google Scholar]
- 16.Ghali WA, Quan H, Brant R, van MG, Norris CM, Faris PD, et al. Comparison of 2 methods for calculating adjusted survival curves from proportional hazards models. JAMA. 2001;286:1494–7. doi: 10.1001/jama.286.12.1494. [DOI] [PubMed] [Google Scholar]
- 17.Friberg L, Hammar N, Pettersson H, Rosenqvist M. Increased mortality in paroxysmal atrial fibrillation: report from the Stockholm Cohort-Study of Atrial Fibrillation (SCAF) Eur Heart J. 2007;28:2346–53. doi: 10.1093/eurheartj/ehm308. [DOI] [PubMed] [Google Scholar]
- 18.Rowan SB, Bailey DN, Bublitz CE, Anderson RJ. Trends in anticoagulation for atrial fibrillation in the U.S.: an analysis of the national ambulatory medical care survey database. J Am Coll Cardiol. 2007;49:1561–5. doi: 10.1016/j.jacc.2006.11.045. [DOI] [PubMed] [Google Scholar]
- 19.Koton S, Schneider AL, Rosamond WD, Shahar E, Sang Y, Gottesman RF, et al. Stroke incidence and mortality trends in US communities, 1987 to 2011. JAMA. 2014;312:259–68. doi: 10.1001/jama.2014.7692. [DOI] [PubMed] [Google Scholar]
- 20.Benjamin EJ, Wolf PA, D'Agostino RB, Silbershatz H, Kannel WB, Levy D. Impact of atrial fibrillation on the risk of death: the Framingham Heart Study. Circulation. 1998;98:946–52. doi: 10.1161/01.cir.98.10.946. [DOI] [PubMed] [Google Scholar]
- 21.Benjamin EJ, Levy D, Vaziri SM, D'Agostino RB, Belanger AJ, Wolf PA. Independent risk factors for atrial fibrillation in a population-based cohort. The Framingham Heart Study. JAMA. 1994;271:840–4. [PubMed] [Google Scholar]
- 22.Nkomo VT, Gardin JM, Skelton TN, Gottdiener JS, Scott CG, Enriquez-Sarano M. Burden of valvular heart diseases: a population-based study. Lancet. 2006;368:1005–11. doi: 10.1016/S0140-6736(06)69208-8. [DOI] [PubMed] [Google Scholar]
- 23.Levy D, Kenchaiah S, Larson MG, Benjamin EJ, Kupka MJ, Ho KK, et al. Long-term trends in the incidence of and survival with heart failure. N Engl J Med. 2002;347:1397–402. doi: 10.1056/NEJMoa020265. [DOI] [PubMed] [Google Scholar]
- 24.Mosterd A, D'Agostino RB, Silbershatz H, Sytkowski PA, Kannel WB, Grobbee DE, et al. Trends in the prevalence of hypertension, antihypertensive therapy, and left ventricular hypertrophy from 1950 to 1989. N Engl J Med. 1999;340:1221–7. doi: 10.1056/NEJM199904223401601. [DOI] [PubMed] [Google Scholar]
- 25.Egan BM, Zhao Y, Axon RN. US trends in prevalence, awareness, treatment, and control of hypertension, 1988-2008. JAMA. 2010;303:2043–50. doi: 10.1001/jama.2010.650. [DOI] [PubMed] [Google Scholar]
- 26.Conen D, Chae CU, Glynn RJ, Tedrow UB, Everett BM, Buring JE, et al. Risk of death and cardiovascular events in initially healthy women with new-onset atrial fibrillation. JAMA. 2011;305:2080–7. doi: 10.1001/jama.2011.659. [DOI] [PMC free article] [PubMed] [Google Scholar]
- 27.Okin PM, Wachtell K, Devereux RB, Harris KE, Jern S, Kjeldsen SE, et al. Regression of electrocardiographic left ventricular hypertrophy and decreased incidence of new-onset atrial fibrillation in patients with hypertension. JAMA. 2006;296:1242–8. doi: 10.1001/jama.296.10.1242. [DOI] [PubMed] [Google Scholar]
- 28.Healey JS, Connolly SJ, Gold MR, Israel CW, van G I, Capucci A, et al. Subclinical atrial fibrillation and the risk of stroke. N Engl J Med. 2012;366:120–9. doi: 10.1056/NEJMoa1105575. [DOI] [PubMed] [Google Scholar]
- 29.Ford ES, Ajani UA, Croft JB, Critchley JA, Labarthe DR, Kottke TE, et al. Explaining the decrease in U.S. deaths from coronary disease, 1980-2000. N Engl J Med. 2007;356:2388–98. doi: 10.1056/NEJMsa053935. [DOI] [PubMed] [Google Scholar]
- 30.Chen J, Normand SLT, Wang Y, Krumholz HM. National and Regional Trends in Heart Failure Hospitalization and Mortality Rates for Medicare Beneficiaries, 1998-2008. JAMA. 2011;306:1669–78. doi: 10.1001/jama.2011.1474. [DOI] [PMC free article] [PubMed] [Google Scholar]
Associated Data
This section collects any data citations, data availability statements, or supplementary materials included in this article.