

Abstract
1. We investigated the mechanisms responsible for the in vivo instability of a benzofurazan compound BI-94 (NSC228148) with potent anti-cancer activity.
2. BI-94 was stable in MeOH, water, and in various buffers at pHs 2.5–5, regardless of the buffer composition. In contrast, BI-94 was unstable in NaOH and at pHs 7–9, regardless of the buffer composition. BI-94 disappeared immediately after spiking into mice, rat, monkey, and human plasma. BI-94 stability in plasma can be only partially restored by acidifying it, which indicated other mechanisms in addition to pH for BI-94 instability in plasma.
3. BI-94 formed adducts with the trapping agents, glutathione (GSH) and N-acetylcysteine (NAC), in vivo and in vitro via nucleophilic aromatic substitution reaction. The kinetics of adduct formation showed that neutral or physiological pHs enhanced and accelerated GSH and NAC adduct formation with BI-94, whereas acidic pHs prevented it. Therefore, physiological pHs not only altered BI-94 chemical stability but also enhanced adduct formation with endogenous nucleophiles. In addition, adduct formation with human serum albumin-peptide 3 (HSA-T3) at the Cys34 position was demonstrated.
4. In conclusion, BI-94 was unstable at physiological conditions due to chemical instability and irreversible binding to plasma proteins.
Keywords: Glutathione, irreversible protein binding, isotopic filtering, LC-MS/MS, N-acetylcysteine
Introduction
The effects of binding to plasma proteins on the pharmaco-kinetic, pharmacological, and toxicological profiles of therapeutic molecules are well established. Only the free (unbound) fractions of drugs are available for distribution, metabolism, excretion, and to exert pharmacological and toxicological effects (Schmidt et al., 2010). In addition, plasma protein binding plays a role in drug–drug interactions, non-linear and stereoselective pharmacokinetics, and inter-and intra-individual variabilities in pharmacological effects (Ito et al., 1998; Paliwal et al., 1993). Therefore, the kinetics of plasma protein binding is determined at early stages in drug discovery and an increasing number of drugs are monitored by measuring the unbound, rather than the total, plasma concentrations as a part of their therapeutic drug monitoring (Dasgupta, 2007; Schmidt et al., 2010).
Drugs may bind to various macromolecular components in plasma, including albumin, α1-acid glycoproteins, lipoproteins, and immunoglobulins (Chan & Gerson, 1987). In addition, significant portions of drugs may bind to erythrocytes. Typically, drug binding to plasma proteins takes place via the formation of reversible bonds (hydrogen bonds or van der Waals forces). However, reactive species resulting from metabolic activation (Jenkins et al., 2009; Jinno et al., 2011; Kalgutkar & Didiuk, 2009; Meng et al., 2011) or spontaneous chemical activation (Meng et al., 2015) of drugs may bind strongly to proteins or other macromolecules via covalent/irreversible chemical bonds (Dubois et al., 1993; Kalgutkar & Didiuk, 2009). The modification of endogenous macromolecules by reactive metabolites can generate “foreign” macromolecules (haptens) that can lead to immune-mediated idiosyncratic adverse reactions (Nassar & Lopez-Anaya, 2004). Therefore, the formation of irreversible complexes between reactive metabolites and macromolecules is often associated with drug toxicity (Kalgutkar & Didiuk, 2009) including skin sensitization, respiratory sensitization, liver toxicity, chromosomal aberration, and a wide range of idiosyncratic toxicities (Enoch et al., 2011; Kalgutkar & Didiuk, 2009). Examples of compounds that demonstrate irreversible protein binding and toxicity due to metabolic activation include tolmetin, zomepirac, troglitazone, practolol, benoxaprofen, ticrynafen, nomifensine, and p-phenylenediamine (PPD) (Hyneck et al., 1988; Jenkinson et al., 2009; Smith et al., 1986). However, not all drugs metabolized into reactive metabolites that bind to macromolecules are associated with any toxicity (Nakayama et al., 2009). In general, reactive metabolites are either electrophiles (electron deficient) or free radicals (Freed et al., 2008; Uetrecht, 2003). Electrophiles can also be classified into hard (localized charge) or soft electrophiles (delocalized charge). Soft electrophiles include epoxides, α,β-unsaturated carbonyl compounds, quinone, quinone imines, quinone methides, imine methide, isocynate, isothiocynates, aziridinium, and episulphonium, whereas aldehydes and iminium ions belong to the group of hard electrophiles (Prakash et al., 2008; Tang & Lu, 2010). Soft electrophiles react with cysteine residues in proteins and with thiol groups of glutathione or N-acetylcysteine (soft nucleophiles), while hard electrophiles react with pyrimidines and purines in DNA and with lysine residues in proteins (hard nucleophiles) (Li et al., 2011a; Prakash et al., 2008).
Several techniques are used for the determination of molecules binding to plasma proteins. These techniques can be divided into methods that determine unbound concentration of drugs from which the bound concentration is indirectly estimated, and methods that directly determine bound concentrations of drugs (Yan & Caldwell, 2004). Commonly used methods in the first category include ultrafiltration, blood partitioning, equilibrium dialysis, chromatography using protein immobilized columns, ultracentrifugation, charcoal adsorption, high performance frontal analysis, solid phase microextraction, fluorescence, surface plasmon resonance, and solid supported lipid membranes (Ballard & Rowland, 2011; Banker & Clark, 2008; Barre et al., 1985; Chuang et al., 2009; Gautam et al., 2013; Howard et al., 2010; Schuhmacher et al., 2004; Shibukawa et al., 1999; Yuan et al., 1995).
Direct quantification of bound concentration, which is used to quantify irreversible binding to plasma proteins, involves the application of radioactive compounds, isolation of plasma proteins, washing non-covalently bound fractions using strong-organic solvents, followed by quantification of the remaining covalently bound radioactivity (Hyneck et al., 1988; Kappus et al., 1973; Smith et al., 1986). In addition, specific covalent protein adducts can be isolated and quantified using immunoaffinity assays. Protein modifications due to adduct formation can also be detected using mass spectrometry (MS) (Rappaport et al., 2012; Uetrecht, 2003). These studies can be performed in various in vitro tissue systems such as hepatic microsomes or hepatocytes or in vivo (Wen & Fitch, 2009).
However, many drug-macromolecule adducts cannot be directly detected due to uncertainty of the binding position, complex structure, or further degradation after binding. Therefore, indirect methods including trapping agents such as glutathione (GSH) and N-acetylcysteine (NAC) are used to capture reactive drug metabolites (Dubois et al., 1993; Jahn et al., 2012a,b; Masubuchi et al., 2007; Nakayama et al., 2011). The resulting more stable complexes of the reactive metabolites with these trapping agents are then quantified as surrogates for the overall protein adducts. GSH and its analogues such as NAC are soft trapping agents used to trap soft electrophiles; whereas hard nucleophiles such as semicarbazide, methoxylamine, N-acetyl-lysine, and cyanide ions are used to trap hard electrophiles (Kalgutkar & Didiuk, 2009; Kerksick & Willoughby, 2005; Li et al., 2011a). The downsides of such approach include the lack of single trapping agent that can serve as a universal surrogate for protein adducts and the failure to trap very reactive metabolites that are unable to escape from their site of formation because they react rapidly with the surrounding environment. In addition to the experimental determination, in silico models are available to screen compounds early in drug discovery to predict whether they can undergo metabolic activation to generate reactive metabolites (Liu et al., 2013; Ma & Subramanian, 2006; Uetrecht, 2003).
BI-94 is a synthetic sulfonyl group-containing compound (4-(benzylsulfonyl)-7-(hydroxy(oxido)amino)-2,1,3-benzoxadiazole) with an average GI50 value of 2.29 ×10⁻⁵ M in the NCI 60 cell line panel. The carboxy-terminus domains of the early onset of breast cancer gene 1 (BRCT-BRCA1) recognize and bind phosphorylated proteins (Manke et al., 2003; Yu et al., 2003). These protein–protein interactions play a critical role in the DNA damage response pathway (Cantor et al., 2001; Kim et al., 2007; Liu et al., 2007; Sobhian et al., 2007; Wang et al., 2007). It was shown that tetrapeptides bind BRCT-BRCA1 with nanomolar affinities (Joseph et al., 2010; Yuan et al., 2011a,b). A poly-arginine-tagged tetrapeptide inhibitor blocked the BRCA1–phospho-protein interaction and sensitized cells to PARP inhibition (Pessetto et al., 2012). The relatively short half-life of the peptide inhibitor led us to screen the NCI diversity set for small molecule inhibitors using a BRCT–BRCA1 fluorescence polarization assay (Lokesh et al., 2006; Simeonov et al., 2008). This led to the identification of the benzofurazan compound NSC228148 (BI-94), developed originally by the Sanford-Burnham Medical Research Institute as a compound-regulating apoptosis, as a hit compound. Other high-throughput screening campaigns have identified substituted benzofurazans as inhibitors of cyclic adenosine monophosphate (cAMP) response-element (CRE) binding protein (CREB)-mediated gene transcription (Xie et al., 2013), influenza A virus (Kessler et al., 2013), and as antifungal agents (Wang et al., 2014).
During the analytical method development for BI-94, as a prelude to assess the in vivo efficacy of BI-94 in tumor animal models, we were not able to recover BI-94 from mouse, rat, monkey, or human plasma. Consequently, we investigated several approaches to improve the extraction recovery of BI-94 from mouse plasma and tissues, which led to the identification of irreversible covalent binding between BI-94 and plasma proteins. This could be explained by the chemical structure of BI-94, which is considered a benzofurazan (BFZ) derivative. BFZ derivatives are highly reactive compounds that can react with many functional groups including amines, thiols, hydroxyls, carbonyls, and carboxyls, which lead to the formation of adducts with macromolecules in vivo (Federici et al., 2009; Ricci et al., 2005; Xie et al., 2013; Yang & Guan, 2015). The presence of electron-withdrawing substituents, like the ones in BI-94, considerably increases BFZ reactivity (Ghosh et al., 1972), which correlate with their toxicity (Patridge et al., 2012). In addition, BFZs promote oxidative stress in vivo via the generation of reactive oxygen species (Patridge et al., 2012). In this manuscript, we characterized BI-94 stability and its irreversible binding to mouse plasma proteins.
Materials and methods
Chemicals and reagents
BI-94 was synthesized as described below. 4-Chloro-7-nitrobenzo[c][1,2,5]oxadiazole, glutathione, glutathione(glycine-13C2, 15N), and N-acetylcysteine were obtained from Sigma-Aldrich (St. Louis, MO). Synthetic human serum albumin (HSA)-T3 peptide (third largest peptide forms after tryptic digestion) was purchased from Biomatik (Wilmington, DE). HPLC-grade methanol, acetonitrile, ammonium acetate, ammonium formate, ammonium hydroxide, formic acid, and acetic acid were obtained from Fisher Scientific (Fair Lawn, NJ). Mouse, rat, monkey, and human plasma were purchased from Equitech-Bio (Kerrville, TX).
Synthesis of BI-94
BI-94 was synthesized in two steps from 4-chloro-7-nitrobenzo[c][1,2,5]oxadiazole and purified (> 98%) using flash chromatography Figure 1A). Flash chromatography was carried out on silica gel (200–400 mesh). Thin layer chromatography (TLC) was run on pre-coated EMD silica gel 60 F254 plates and observed under UV light at 254 nm and with basic potassium permanganate dip. Column chromatography was performed with silica gel (230–400 mesh, grade 60, Fisher Scientific, Fair Lawn, NJ). 1H NMR (500 MHz) and 13C NMR (125 MHz) spectra were recorded in chloroform-d on a Varian-500 and Varian-600 spectrometer (Varian Medical Systems, Palo Alto, CA) (CDCl3 was 7.27 ppm for 1H and 77.23 ppm for 13C)_. Proton and carbon chemical shifts were reported in ppm relative to the signal from residual solvent proton and carbon. LC-MS for the compounds was generated on an Agilent 1200 series system (Agilent Technologies, Palo Alto, CA) with UV detector (214 nm and 254 nm) and an Agilent 6130 quadrupole mass detector (Agilent Technologies, Palo Alto, CA).
Figure 1.

(A) Chemical structure of BI-94, and plausible mechanisms for the instability of BI-94 under basic conditions. (B) Product ion spectra of BI-94 degradation product, under basic condition, in the negative ESI mode (m/z – 180).
4-(Benzylthio)-7-nitrobenzo[c][1,2,5]oxadiazole
To a solution of 4-chloro-7-nitrobenzo[c][1,2,5]oxadiazole (3.0 g, 15.03 mmol) in ethanol (25 mL), dry pyrdine (1.5 mL, 15.03 mmol) was added and the reaction mixture was stirred at room temperature for 10 min. Phenylmethanethiol (3.55 mL, 30.06 mmol) was added dropwise at room temperature (color change from yellow to brown) followed by heating the reaction mixture at 80°C for 16 h. Reaction was monitored by thin layer chromatography using 10:1 hexane:ethyl acetate eluent. Cold hexane (30 mL) was added to the reaction mixture and filtered to obtain solid as a pure product (1.38 g, 32%), which was used as such for the next step without further purification.
4-(Benzylsulfonyl)-7-nitrobenzo[c][1,2,5]oxadiazole
To a solution of 4-(benzylthio)-7-nitrobenzo[c][1,2,5]oxadiazole (1.0 g, 3.4 mmol) in methylene chloride (30 mL), meta-chloroperoxybenzoic acid (2.54 g, 17.4 mmol) was added and the reaction mixture was stirred at room temperature for 3 h. Reaction was monitored by thin layer chromatography using 5:1 hexane:ethyl acetate eluent. The reaction mixture was filtered and the supernatant was washed with saturated sodium bicarbonate, dried over magnesium sulfate, and column chromatographed to obtain the desired product (510 mg, 46%) as off-white solid. 1H NMR (CDCl3) δ 8.35 (m, J = 8.0 Hz, 1H), 7.46–7.32 (m, 5H), 7.18 (d, J = 8.0 Hz, 1H), 4.52 (s, 2H); 13C NMR δ 149.07, 142.37, 140.83, 133.61, 132.81, 130.59, 129.06, 128.70, 128.33, 121.24, 36.53.
Direct MS/MS and LC-MS/MS analysis
A 4000 Q TRAP® quadrupole linear ion trap hybrid mass spectrometer (Agilent Technologies, Palo Alto, CA) with electrospray ionization (ESI) source was used throughout (Applied Biosystems, MDS Sciex, Foster City, CA). The qualitative detection of adduct formation of BI-94 was performed via direct infusion into the MS using 55-2222 infusion syringe pump (Harvard Apparatus, Holliston, MA) at a flow rate of 10 μL/min. Enhanced MS (EMS) scans were obtained in both positive and negative ESI modes with the following parameters: ion spray voltage, 4500 V; source temperature, 500°C; curtain gas (nitrogen), 12 arbitrary units; and collision gas (nitrogen), “High”, range 100–700 (m/z) with 1000 Da/s scan rate. Adducts were further characterized using product ion scans of precursor ions with ramped collision energy (CE) over the range of −130 to −10 eV to identify their fragmentation patterns.
The LC-MS/MS system comprised a Waters ACQUITY ultra-performance liquid chromatography (UPLC) system (Waters, Milford, MA) coupled to the same MS system described above. All chromatographic separations were performed with an ACQUITY UPLC® BEH Phenyl (2.1 × 150 mm, 1.7 μm; Waters, Milford, MA) analytical column equipped with an ACQUITY UPLC C18 guard column (Waters, Milford, MA). Mobile phase A consisted of ammonium acetate (7.5 mM, pH 4.0) and mobile phase B consisted of 50% acetonitrile (ACN) and 50% methanol (MeOH). The initial mobile phase composition was 52.5% B for the first 7 min, gradually decreased to 30% B in 0.25 min and held constant for 2 min, then gradually increased to 90% B in 0.25 min and held constant for 4 min. Mobile phase B was then reset to 52.5% in 0.25 min and the column was equilibrated for 3 min before the next injection. A flow rate of 0.25 mL/min was used and the injection volume of all samples was 10 μL.
Screening for GSH and NAC adducts
Qualitative screening for adducts formation with NAC (method i only) and GSH (methods i–vi) were performed using various approaches:
Enhanced MS-information-dependent acquisition-enhanced product ion scan (EMS-IDA-EPI) in both positive and negative ionization modes. The EMS survey scan was conducted in the mass range from 160 to 750 Da, at a 1000 Da/s scan rate followed by an enhanced resolution (ER) scan at 250 Da/s. The IDA (information dependent acquisition) threshold was set at 5000 counts per second (cps), above which enhanced product ion (EPI) spectrum collection is triggered from the precursor mass of that particular channel. The EPI scan rate was 4000 Da/s and the scan range was 70–750 Da.
Neutral loss scan of m/z 129 in the positive mode, over a range of 130–800 Da/1.5 s.
Neutral loss scan of m/z 307 in the positive ion mode, over a range of 308–800 Da/1.5 s.
Precursor ion scan of m/z 130 in the positive mode, over a range of 150–800 Da/1.5 s.
Precursor ion scan of m/z 254 in the negative mode, over a range of 250–800 Da/1.5 s.
Precursor ion scan of m/z 272 in the negative mode, over a range of 250–800 Da/1.5 s.
Isotopic filtering
A mixture of 1:1 glutathione:stable isotopically labeled glutathione (glycine-13C2, 15N) was used in the GSH screening incubations. The total ion chromatograms (TIC), obtained from the screening scans mentioned above, were filtered for the isotopic pattern of 1:1 abundance of ion pairs with a mass difference of 3 Da, using the elemental targeting feature in Analyst software (AB Sciex, Framingham, MA) (Liao et al., 2012; Mutlib et al., 2005).
Quantification of BI-94, GSH, NAC, and their adducts
LC-MS/MS quantification of BI-94 was performed by monitoring the transition m/z 319.1→179.8. Quantitative detections of adducts were performed by monitoring the transitions of m/z 468.99→196 and m/z 578.0→305 for A1 and A2 adducts of GSH, respectively, in the negative mode. The m/z 195.88→46, 304.91→150, and 454.81→196.1 were used to quantify the A1, A2, and A3 adducts of NAC, respectively, in the negative mode. GSH and NAC themselves were monitored in the negative mode using m/z 306.2→128 and m/z 161.79→83.9, respectively. There was no need to use absolute concentrations in these analyses; therefore, absolute peak areas were used in a semi-quantitative manner.
Stability of BI-94 in solution, plasma, serum, and blood
The stability of BI-94 was tested in various buffers and at different pH levels including pH 2.5 and pH 3 ammonium formate (7.5 mM), pH 3 and 5 ammonium acetate (7.5 mM), pH 7 ammonium bicarbonate (7.5 mM), pH 7 phosphate buffer saline (PBS), pH 9 ammonium carbonate (7.5 mM), NaOH (0.75 mM), and deionized water at room temperature. About 10 μL of a 1 mg/mL working standard solution of BI-94 in 70% MeOH in DMSO was added into 990 μL volume of these buffers to make a final BI-94 concentration of 10 μg/mL. About 10 μL aliquots were collected in 90 μL of 55.0% methanol at 1, 20, and 60 min, and then analyzed immediately by LC-MS/MS.
Stability studies of BI-94 were performed in mouse plasma (stored in −80°C), diluted plasma, and in plasma extracted by protein precipitation with methanol (post-extracted) plasma at 10 μg/mL concentration at room temperature. One- and 10-× diluted plasma were prepared by the addition of one or nine volumes of water or 7.5 mM ammonium formate buffer (pH 2.5) to one volume of plasma. Diluted and undiluted plasma samples were extracted by adding 400 μL of methanol to a 100 μL of blank plasma samples pre-spiked with 10 μL of a 100 μg/mL BI-94 stock solution, after 1, 20, and 60 min of incubation time. Samples were then vortexed and centrifuged at 16 000 × g for 10 min. A 100 μL of the supernatant was aspirated, and mixed with a 100 μL of 20% methanol in 7.5 mM ammonium formate buffer (pH 2.5) for LC-MS/MS analysis.
For post-extracted plasma, blank plasma samples were extracted with 400 μL MeOH, centrifuged at 16 000 × g, and the supernatants were collected. A 100 μL of the supernatant was aspirated, mixed with a 100 μL of 20 % methanol in H2O or in 7.5 mM ammonium formate buffer (pH 2.5), spiked with 10 μL of a 20 μg/mL BI-94, and analyzed by LC-MS/MS. In addition to mouse plasma, stability of BI-94 was also investigated in mouse blood and serum, and in rat, monkey, and human plasma.
GSH and NAC adduct formation in solution
The kinetics of adduct formation of BI-94 with GSH and NAC was also investigated in H2O, PBS, and in 7.5 mM ammonium formate buffer (pH 2.5). As a control, BI-94 without NAC or GSH was also incubated under the same conditions. About 10 μL of 1 mg/μL stock solutions of NAC or GSH and 10 μL BI-94 were added to 980 μL of H2O, PBS, or buffer to start the reaction. Aliquots of 10 μL were collected in 90 μL of 55.0% methanol in H2O (1 μg/mL final BI-94 concentration) at 1, 5, 15, 30, 45, and 60 min, and then analyzed immediately by LC-MS/MS. Separate incubations of BI-94 (final concentration of 10 μg/mL) for 30 min in water were utilized for the structural identification of NAC and GSH adducts using direct LC-MS/MS and MS/MS analysis.
HSA-T3 peptide adduct formation in solution
About 10 μL of 1 mg/mL HSA-T3 peptide in 50% ACN and 10 μL of BI-94 in 70% MeOH in DMSO were added to 480 μL of H2O and were incubated for 30 min. Then, the incubation mixture was mixed with 500 μL acetonitrile (a final concentration of 10 μg/mL). Qualitative screening for adducts formation of BI-94 with HSA-T3 was performed using EMS scans in both positive and negative modes over a range of 100–2500 Da. Adducts were further characterized using enhanced product ion (EPI) scans of precursor ions to identify their fragmentation patterns.
GSH and NAC adduct formation in vivo and in spiked plasma samples
Eight-week-old male Balb/c mice (n = 3) were purchased from Charles River Laboratories (Wilmington, MA). Sterilized 7012 Teklad diet (Harlan, Madison, WI) was used for mice, and water was provided ad libitum. Mice were housed in the University of Nebraska Medical Center (UNMC) laboratory animal facility according to the American Animal Association and Laboratory Animal Care guidelines. All procedures were approved by the Institutional Animal Care and Use Committee at UNMC as set forth by the National Institutes of Health (NIH). The 10-mg/kg intravenous dose was administered as a 100 μL of 2.5 mg/mL BI-94 solution in a dimethyl sulfoxide (DMSO)-ethanol-polyethylene glycol (PEG) 400-propylene glycol (PG) mixture (20/20/40/20 v/v). A 100 μL of blood samples were collected at 5 and 60 min post-dose and 50 μL were used to obtain plasma, while the other 50 μL were used as whole blood. Plasma and whole blood samples were immediately extracted with four volumes of MeOH, centrifuged at 16 000 × g for 10 min. Supernatants from both plasma and blood samples were mixed with equal volumes of 20% methanol in 7.5 mM ammonium formate (pH 2.5) buffer for LC-MS/MS analysis.
Adduct formation with NAC and GSH was also monitored after spiking BI-94 in freshly collected mouse blood/plasma and in frozen plasma. Freshly collected blank blood/plasma and frozen plasma were spiked with BI-94 at 10 μg/mL concentration and incubated for 5 and 20 min at room temperature. Samples were then prepared as described above for LC-MS/MS analysis. An additional set of frozen plasma samples was fortified with exogenous GSH at 9.8 μM before spiking with BI-94.
Results and discussion
BI-94 immediately disappeared after spiking in mouse plasma. To understand the mechanism of its instability in plasma, the stability of BI-94 was first tested in various buffers and at different pH levels (Figure 2A). BI-94 was found to be stable in water and in various buffers at pHs 2.5–5, regardless of the buffer composition. In addition, BI-94 was stable in the autosampler for 48 h in the 50 % methanol in H2O reconstitution solution (data not shown). In contrast, BI-94 was not stable in NaOH or in various buffers at pHs 7–9, regardless of the buffer composition. These data indicate that BI-94 is only stable at acidic pHs and not stable at physiological or basic pHs. Therefore, we reexamined BI-94 stability in plasma to look for conditions that may increase it. Recovery of BI-94 from mouse plasma up to 1 h of incubation time, at various conditions, is shown in Figure 2(B). BI-94 was below detection limit immediately after spiking in mouse plasma and in plasma diluted with one or nine volumes of H2O. However, one volume dilution with 7.5 mM NH4-formate buffer (pH 2.5) increased immediate recovery from mouse plasma to 62%, which declined to 10% over 60 min of incubation, whereas nine volume dilution with the same buffer completely recovered BI-94 from plasma.
Figure 2.

Percentage recovery versus incubation time profiles of (A) BI-94 in NaOH, deionized water and in various buffers, and (B) BI-94 in untreated mouse plasma, water-diluted plasma, plasma pre-treated with ammonium formate buffer (pH 2.5), post-extracted plasma (reconstituted with 50% MeOH in water) and post-extracted plasma reconstituted with ammonium formate buffer (pH 2.5).
BI-94 instability in neutral and basic pH conditions can be attributed to the electron withdrawing functional groups on BI-94. The strong electron withdrawing nature of nitro and sulfone functional groups on the 4- and 7-positions makes these positions susceptible to nucleophillic substitution with ammonia, carbonate, bicarbonate, and hydroxide ions from the neutral and basic conditions described above, possibly via an ipso attack following a Boulton–Katritzky mechanism (Crampton et al., 2003) (Figure 1A). We were able to detect an extra peak after BI-94 incubation under various neutral and basic conditions with a retention time of 2 min (RT of BI-94 was 9 min). MS analysis revealed a MW of 181 for this extra peak, which matches the MW of the 7-hydroxy-4-nitrobenzofurazan degradation product shown in Figure 1. Further MS/MS analysis supported a fragmentation pattern of the proposed structure for this 181-MW peak as shown in Figure 1(B). Furthermore, this peak was not detected under acidic conditions, and its area under the curve was 100-fold higher, when BI-94 was incubated with ammonium carbonate (pH 9) buffer compared with H2O.
In addition, the nitro and sulfone groups on the 4- and 7-positions, respectively, make the 5- and 6-positions on BI-94 susceptible to nucleophillic attacks. For example, the addition of hydroxide ions following an oxa-Michael mechanism may take place (Figure 1A). However, we have not detected such degradation products under our LC-MS conditions.
BI-94 stability was also characterized in post-extracted plasma, in which plasma samples were initially pre-extracted with MeOH only or with a combination of MeOH and formate buffer before spiking with BI-94 (Figure 2B). Recovery of BI-94 from plasma pretreated with MeOH was a 100% immediately after spiking, however, the recovery decreased to 20% after a 60-min incubation. In contrast, recovery of BI-94 from blank plasma pre-treated with a combination of MeOH and formate buffer remained at a 100% after a 60-min incubation (Figure 2B). Therefore, pre-treating plasma with MeOH or acidifying plasma samples with formate buffer enhance BI-94 stability, while a combination of acid and MeOH pretreatment further enhances it resulting in 100% stability in plasma. Similar to mouse plasma, BI-94 disappeared immediately after spiking into monkey, rat, and human, plasma with a recovery <1% (data not shown).
Because acidifying plasma alone did not result in complete recovery of BI-94, additional mechanisms beyond pH were responsible for BI-94 instability in plasma. Therefore, we evaluated the metabolic stability of BI-94 in mouse plasma by LC-MS and LC-UV. No additional peaks including peaks specific to predicted phase I and phase II metabolites were detected, by UV or by MS, after incubation of BI-94 with plasma or with post-extracted plasma. Together these studies suggested irreversible plasma protein binding as an additional mechanism for the disappearance of BI-94 upon incubation with plasma.
Adduct formation of BI-94 with the common trapping agents, GSH and NAC, was used as a surrogate to predict irreversible binding to plasma proteins. We were not able to detect intact adducts of GSH and NAC with BI-94. However, we detected two adducts with GSH, which were formed with a fragment of BI-94, when incubated in deionized water for 30 min. Similarly three NAC adducts were detected, which were formed with fragments of NAC and BI-94. EMS spectra, from direct MS analysis, of parent BI-94, adducts of BI-94 with GSH (A1: 469.4 and A2: 578.4), and adducts of BI-94 with NAC (A1: 196.1, A2: 305.3, and A3: 455.1) are shown in Figure 3. Chemical structures for these adducts were proposed based on their fragmentation pattern in MS/MS. The GSH adduct A1 (m/z 469) produced two product ions of m/z 195.9 and 150.0 (Figure 4A), and adduct A2 (m/z 578.5) produced two product ions of m/z 304.8 and 150.1 (Figure 4B). The NAC adduct A1 (m/z 196) produced three product ions of m/z 150, 122.5, and 105.9 (Figure 5A), and adduct A2 (m/z 304.7) produced four product ions of m/z 155, 150, 105.9, and 63.8 (Figure 5B). The NAC adduct A3 (m/z 455) did not produce any specific fragmentation pattern (data not shown). During the synthesis of BI-94, the chlorine atom at the 7-position of 4-nitro-7-chloro benzofurazan was displaced by the sulfhydryl group in phenylmethanethiol (SNAr type reaction). Therefore, plausible mechanisms for the formation of these adducts with GSH and NAC are the addition of sulfhydryl groups to the 5-position via a Michael type reaction and SNAr type substitution of NO2 group and/or the substituted sulfone.
Figure 3.

EMS spectra of (A) parent I-94, (B) adducts of BI-94 with GSH (A1 and A2), and (C) adducts of BI-94 with NAC (A1, A2, and A3) after 30-min incubation in water followed by direct infusion into the MS system.
Figure 4.
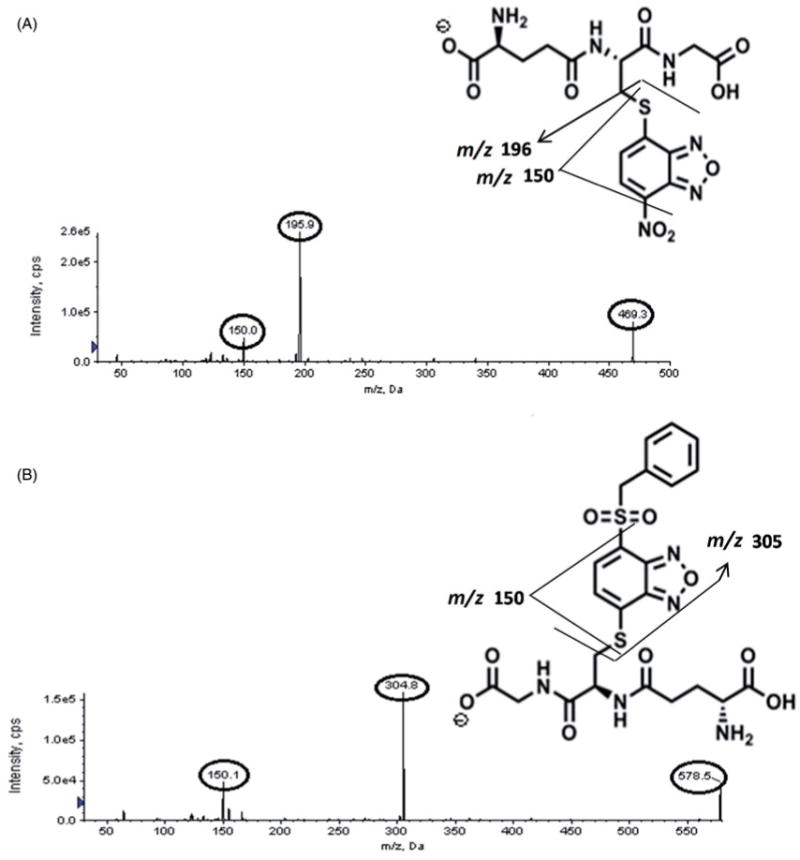
Product ion spectra of BI-94 with GSH adducts: (A) adduct A1 (m/z – 469) and (B) adduct A2 (m/z – 578).
Figure 5.

Product ion spectra of BI-94 with NAC adducts: (A) adduct A1 (m/z – 196) and (B) adduct A2 (m/z – 305).
In addition to the above-mentioned direct MS analysis, the formation of GSH adducts with BI-94 in deionized water was further investigated by LC-MS/MS using various scans and with the isotope filtering technique. EMS scans in both positive and negative ionization modes failed to show the formation of BI-94-GSH adducts due to the lack of sensitivity and specificity (Figure 6A and B). More specific scans previously reported for the detection of GSH adducts (Li et al., 2011a; Ma & Subramanian, 2006) including precursor scans of 130 (positive ionization), 254, and 272 (negative ionization), m/z as well as neutral loss scans of 129 and 307 (positive ionization), were also investigated (Figure 6). The precursor ion scan of 254 and 272 m/z failed to detect any adducts due to the lack of sensitivity (Figure 6C and D). The precursor ion scan of 130 m/z and the neutral loss scans of 129 and 307 m/z were able to detect GSH adducts (Figure 6E–G). As expected, the MRM scans demonstrated the highest sensitivity and selectivity in detecting GSH adducts (Figure 6H). However, MRM scans can only detect pre-identified adducts specific for the compounds of interest, for which the MS was specifically tuned and optimized. In contrast all other scans are generic scans designed to detect GSH adducts regardless what compounds they are conjugated with; therefore, are more likely to detect unpredicted adducts.
Figure 6.

Representative LC-MS chromatograms of GSH adducts with BI-94 after 30-min incubation in water: (A) enhanced MS scan in the positive mode, (B) enhanced MS scan in the negative mode, (C) precursor ion scan of m/z 254 in the negative mode, (D) precursor ion scan of m/z 272 in the negative mode, (E) precursor ion scan of m/z 130 in the positive mode, (F) neutral loss scan of m/z 129 in the positive mode, (G) neutral loss scan for m/z 307 in the positive mode, and (H) MRM scans (A1 m/z 469; A2 m/z 578) in the negative mode.
The same scans described above were used in combination with isotopic filtering. In isotope filtering, a mixture of stable isotope-labeled compound and its un-labeled counterpart in a pre-determined ratio is used to tag all ions related to this compound with a signature isotopic pattern. In this context, we utilized a 1:1 mixture of labeled and unlabeled GSH with a 3-Da mass difference. Therefore, all adducts resulting from conjugation of substrates with GSH can be filtered out from the TIC chromatogram, as ion pairs with a 3-Da mass difference and a 1:1 abundance ratio. Figure 7 shows representative chromatograms from the 129 m/z neutral loss scan with and without isotopic filtering. Isotopic filtering has clearly increased sensitivity and selectivity (Figure 7B). More importantly isotopic filtering only extracted ion pairs with the pre-identified isotopic pattern (1:1 of M:M+3 isotopes), which resulted in the unambiguous identification of any ions related to GSH including the GSH-BI-94 adducts (A1 and A2), GSH itself, and a new GSH-BI-94 adduct (A3) that was not detected using all approaches described earlier.
Figure 7.
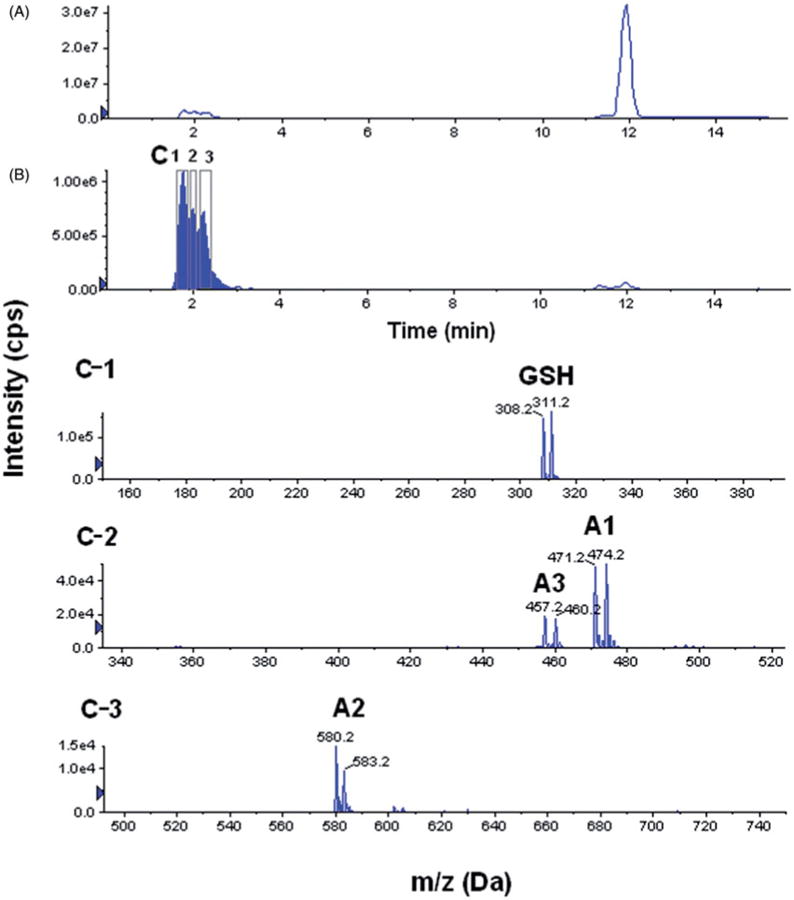
Representative LC-MS chromatograms and spectrums of BI-94 adducts with GSH for neutral loss of m/z 129 after 30-min incubation in water, (A) total ion chromatogram (TIC), (B) the same TIC with a 3-Da isotopic filter, and (C-1, C-2, and C-3) extracted mass spectrums from peaks in B.
After optimizing and establishing the methods to detect and quantify adduct formation, we used these methods to characterize the kinetics of GSH and NAC adduct formation with BI-94 at physiological pH using PBS. BI-94 and GSH were gradually depleted while A1 and A2 adducts were gradually formed over the 1-h course of incubation in water (Figure 8A). After 60 min of incubation, the peak areas of BI-94 and GSH decreased by 64%, whereas there was a 6-fold increase in the peak area of A1 and A2 adducts. When incubation was performed in PBS, there was an abrupt depletion (94.5% decrease in peak area) of BI-94, and the maximum formation of GSH adducts was observed within 5 min of incubation (Figure 8B). However, when the reaction was performed in NH4-formate buffer of pH 2.5, only 14% of BI-94 was depleted over 1 h, and both A1 and A2 were barely detected (Figure 8C). A similar trend was observed from the kinetics of adduct formation of BI-94 with NAC, in water, PBS, and ammonium formate buffer (pH 2.5) (data not shown). Therefore, neutral/physiological pHs enhanced and accelerated the GSH and NAC adduct formation with BI-94, whereas acidic pHs completely prevented it. This can contribute to the instability of BI-94 in plasma, where the physiological pH not only triggered the chemical instability of BI-94, as discussed earlier (Figure 2A) but also enhanced adduct formation with endogenous nucleophiles.
Figure 8.
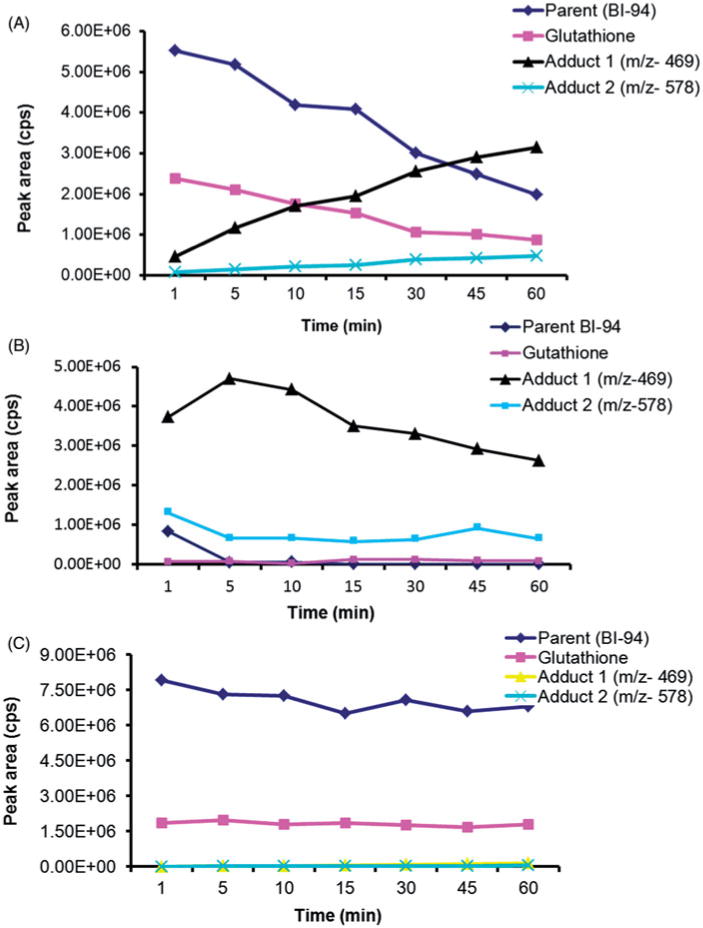
Peak area-time profile for BI-94, GSH, and their A1 and A2 adducts in (A) H2O, (B) PBS and, (C) NH4-formate buffer (pH 2.5), in binding study for 1 h.
When BI-94 was incubated with blank plasma freshly collected from mice, the GSH adducts (A1 and A2), a NAC adduct (A1), and endogenous GSH itself were detected (Figure 9). In addition, BI-94 adducts with GSH (A1 and A2), NAC (A1 and A2), and GSH itself were detected in vivo from plasma samples collected 5 and 60 min after 10 mg/kg intravenous dose administration to mice (Figure 9G and H). These NAC adducts which have only thiol addition could come from any endogenous thiol donor, including NAC. Furthermore, all three mice died within 2 h after BI-94 administration. Collectively, these data provide strong evidence suggesting that irreversible binding of BI-94 to plasma proteins and/or other nucleophiles takes place in vivo.
Figure 9.

Representative LC-MS/MS chromatograms of (A) GSH adducts with BI-94 after 30-min incubation in water, (B) NAC adducts with BI-94 after 30-min incubation in water, (C) endogenous GSH in fresh plasma, (D) endogenous NAC in fresh plasma, (E) GSH adducts with BI-94 5 min after spiking in fresh plasma, and (F) NAC adducts with BI-94 5 min after spiking in fresh plasma, (G) GSH adducts in plasma samples after 5 min of intravenous dose administration, and (H) NAC adducts in plasma samples after 5 min of intravenous dose administration.
In contrast, none of the adducts or the endogenous GSH or NAC themselves, which we detected in fresh plasma, were detected when BI-94 was spiked into frozen blank mouse plasma samples. This may be because GSH is not stable for long periods of time and can undergo non-enzymatic oxidation in biological samples (Squellerio et al., 2012). The reported endogenous levels of GSH in human blood and plasma were 849 ± 63 μM and 3.39 ± 1.04 μM, respectively (Michelet et al., 1995). Whereas the reported NAC endogenous concentration in human plasma was 0.08 μM (Gabard & Mascher, 1991). Consequently, we monitored the formation of BI-94 adducts in frozen blank mouse plasma after fortifying them with 9.8 μM of exogenous GSH (near physiological levels of GSH in human plasma in vivo). Surely, we detected the same GSH adducts in these GSH-fortified samples at similar levels to the ones in fresh plasma samples (data not shown). Therefore, the use of frozen blank plasmas to make conclusions about the formation of GSH and NAC adducts can be misleading due to GSH instability and rather fresh plasma should be used instead. The instability of GSH itself and/or GSH adducts after their formation may preclude their detection in vitro and in vivo. Similar results were obtained when whole in vivo (mice dosed with BI-94) and spiked blood samples rather than plasma were analyzed (data not shown). The peak area of GSH adducts was up to nine-fold higher in blood compared with plasma, because the endogenous level of GSH in mouse blood was higher compared with plasma (GSH peak area was 57-fold higher in mouse blood compared with plasma). Similarly, it was previously reported that the endogenous level of GSH in human blood was 250-fold higher compared with plasma (Michelet et al., 1995).
Albumin is the most abundant plasma protein. Therefore, detection of a compound–albumin complex would provide a stronger evidence for irreversible binding with plasma proteins compared with using surrogate trapping agents such as GSH and NAC. However, detection of such large complexes is not always feasible (Jahn et al., 2012a). Therefore, large peptides resulting from albumin digestion and containing the free Cys34, which is thought as the primary albumin binding site, are used as surrogates for binding to intact albumin. An example of such peptides is HSA-T3, which was shown to be the only peptide resulting from albumin digestion that bind covalently to a variety of electrophiles (aldehydes, nitrogen mustards, oxiranes, quin-ones, metal ions, and small molecules) in a similar way as intact albumin (Li et al., 2011b; Rubino et al., 2009). In this study similar to GSH, adducts with fragments of BI-94, A1 (m/z+3 = 866.8 = HSA-T3+164) and A2 (m/z+3 = 903.1 = HSA-T3+273), rather than intact BI-94 were detected in EMS scans, when BI-94 incubated with HSA-T3 peptide in deionized water for 30 min. These adducts were further analyzed for their fragmentation pattern in MS/MS to determine the site of adduct formation. As shown in Table 1 and Figure 10, mass shifts of 164 (A1) and 273 (A2), as a result of adduct formation with BI-94, were only observed with HSA-T3 fragments that contain the Cys34. For example, the HSA-T3 fragment y7 did not show any mass shift after incubation with BI-94. Whereas the y8 fragment, which is the same as y7 with the addition of Cys34, showed both 164 (A1) and 273 (A2) mass shifts. This provides an evidence that BI-94 forms adducts with albumin at the Cys34 position.
Table 1.
Observed MS/MS fragments for HSA-T3 peptide and its BI-94 adducts.
| HSA-T3 fragments | Mass | Charge | m/z (HSA-T3) | m/za (BI-94 + HSA-T3) | HSA-T3 fragments | Mass | Charge | m/z (HSA-T3) | m/za (BI-94 + HSA-T3) |
|---|---|---|---|---|---|---|---|---|---|
| y1 | 145.1 | b | b | b | b20 | 2287.2 | b | b | b |
| y2 | 244.2 | b | b | b | b19 | 2188.1 | b | b | b |
| y3 | 381.2 | + | 383.3 | No modification | b18 | 2051.1 | b | b | b |
| y4 | 496.2 | + | 498.2 | No modification | b17 | 1936.0 | b | b | b |
| y5 | 625.3 | + | 627.4 | No modification | b16 | 1806.9 | b | b | b |
| y6 | 772.4 | + | 774.2 | No modification | b15 | 1659.9 | b | b | b |
| y7 | 869.4 | + | 871.4 | No modification | b14 | 1562.8 | + | 1562.8 | b |
| y8 | 972.4 | + | 974.4 | 1137.4 (+164), 1247.5 (+273) | b13 | 1459.8 | + | 1459.6 | b |
| y9 | 1100.5 | + | 1102.5 | b | b12 | 1331.8 | + | 1331.7 | b |
| y10 | 1228.5 | + | 1230.6 | 1394.6 (+164), 1503.6 (+273) | b11 | 1203.7 | + | 1203.6 | No modification |
| y11 | 1341.6 | + | 1343.5 | b | b10 | 1090.6 | + | 1090.6 | b |
| y12 | 1504.7 | + | 1506.6 | b | b9 | 927.6 | + | 927.4 | b |
| y13 | 1632.7 | b | b | b | b8 | 799.5 | + | 799.5 | No modification |
| y14 | 1703.8 | ++ | 853.4 | 936.5 (+164/2), 989.9 (+273/2) | b7 | 728.5 | + | 728.7 | No modification |
| y15 | 1850.8 | ++ | 927.4 | 1009.4 (+164/2), 1063.4 (+273/2) | b6 | 581.4 | + | 581.4 | No modification |
| y16 | 1921.9 | ++ | 963.0 | 1044.5 (+164/2), 1099.5 (+273/2) | b5 | 510.4 | + | 510.4 | No modification |
| y17 | 2034.9 | ++ | 1019.5 | 1101.4 (+164/2), 1155.5 (+273/2) | b4 | 397.3 | + | 397.4 | No modification |
| y18 | 2148.1 | ++ | 1076.0 | 1158.6 (+164/2), 1112.1 (+273/2) | b3 | 284.2 | + | 284.2 | No modification |
| y19 | 2247.1 | ++ | 1125.5 | 1208.6 (+164/2), 1261.7 (+273/2) | b2 | 185.1 | + | 185.1 | No modification |
| y20 | 2360.2 | b | b | b | b1 | 72.1 | b | b | b |
Observed m/z after mass shift resulting from adduct formation with BI-94 [A1 (+164) and A2 (+273)]; no modification: mass of HSA-T3 fragments were not changed after incubation with BI-94.
Not detected.
Figure 10.

(A) Theoretical fragmentation pattern for HSA-T3 peptide, EPI spectra of (B-I) HSA-T3 = 812.5+3 m/z, (B-II) adduct A1 = 866.8+3 m/z (HSA-T3 +164), and (B-III) adduct A2 = 903.1+3 m/z (HSA-T3 + 273). Mass shifts were detected for circled fragments, as a result of adduct formation with BI-94 at the cys34 amino acid position.
In conclusion, we investigated the mechanisms responsible for the instability of BI-94 in vivo and in vitro. Studies with various buffers at different pHs suggested that BI-94 was not stable in solution at neutral or basic pHs as well as in plasma, while it was stable at acidic pHs. The recovery of BI-94 from plasma can be increased through acidification. Our data also show that BI-94 undergoes attack by nucleophiles including GSH, NAC, and T3-HAS which suggests that BI-94 binds irreversibly to plasma proteins including albumin. Therefore, the instability of BI-94 in plasma is likely due to a combination of chemical instability and irreversible binding to plasma proteins and other nucleophiles. Irreversible protein binding of BI-94 may be the reason behind its strong toxicity in vivo. Further structural modifications of BI-94 are required to improve its stability and safety.
Acknowledgments
This work was supported National Institutes of Health (Grants DA028555-01 and CA127239). The authors alone are responsible for the content and writing of the paper.
Footnotes
Declaration of interest The authors report no conflicts of interest.
References
- Ballard P, Rowland M. Correction for nonspecific binding to various components of ultrafiltration apparatus and impact on estimating in vivo rat clearance for a congeneric series of 5-ethyl,5-n-alkyl barbituric acids. Drug Metab Dispos. 2011;39:2165–8. doi: 10.1124/dmd.111.040683. [DOI] [PubMed] [Google Scholar]
- Banker MJ, Clark TH. Plasma/serum protein binding determinations. Curr Drug Metab. 2008;9:854–9. doi: 10.2174/138920008786485065. [DOI] [PubMed] [Google Scholar]
- Barre J, Chamouard JM, Houin G, Tillement JP. Equilibrium dialysis, ultrafiltration, and ultracentrifugation compared for determining the plasma-protein-binding characteristics of valproic acid. Clin Chem. 1985;31:60–4. [PubMed] [Google Scholar]
- Cantor SB, Bell DW, Ganesan S, et al. BACH1, a novel helicase-like protein, interacts directly with BRCA1 and contributes to its DNA repair function. Cell. 2001;105:149–60. doi: 10.1016/s0092-8674(01)00304-x. [DOI] [PubMed] [Google Scholar]
- Chan S, Gerson B. Free drug monitoring. Clin Lab Med. 1987;7:279–87. [PubMed] [Google Scholar]
- Chuang VT, Maruyama T, Otagiri M. Updates on contemporary protein binding techniques. Drug Metab Pharmacokinet. 2009;24:358–64. doi: 10.2133/dmpk.24.358. [DOI] [PubMed] [Google Scholar]
- Crampton MR, Lunn RE, Lucas D. Sigma-adduct formation and oxidative substitution in the reactions of 4-nitrobenzofurazan and some derivatives with hydroxide ions in water. Org Biomol Chem. 2003;1:3438–43. doi: 10.1039/b307648m. [DOI] [PubMed] [Google Scholar]
- Dasgupta A. Usefulness of monitoring free (unbound) concentrations of therapeutic drugs in patient management. Clin Chim Acta. 2007;377:1–13. doi: 10.1016/j.cca.2006.08.026. [DOI] [PubMed] [Google Scholar]
- Dubois N, Lapicque F, Maurice MH, et al. In vitro irreversible binding of ketoprofen glucuronide to plasma proteins. Drug Metab Dispos. 1993;21:617–23. [PubMed] [Google Scholar]
- Enoch SJ, Ellison CM, Schultz TW, Cronin MT. A review of the electrophilic reaction chemistry involved in covalent protein binding relevant to toxicity. Crit Rev Toxicol. 2011;41:783–802. doi: 10.3109/10408444.2011.598141. [DOI] [PubMed] [Google Scholar]
- Federici L, Lo Sterzo C, Pezzola S, et al. Structural basis for the binding of the anticancer compound 6-(7-nitro-2,1,3-benzoxadiazol-4-ylthio)hexanol to human glutathione s-transferases. Cancer Res. 2009;69:8025–34. doi: 10.1158/0008-5472.CAN-09-1314. [DOI] [PubMed] [Google Scholar]
- Freed AL, Strohmeyer HE, Mahjour M, et al. pH control of nucleophilic/electrophilic oxidation. Int J Pharm. 2008;357:180–8. doi: 10.1016/j.ijpharm.2008.01.061. [DOI] [PubMed] [Google Scholar]
- Gabard B, Mascher H. Endogenous plasma N-acetylcysteine and single dose oral bioavailability from two different formulations as determined by a new analytical method. Biopharm Drug Dispos. 1991;12:343–53. doi: 10.1002/bdd.2510120504. [DOI] [PubMed] [Google Scholar]
- Gautam N, Bathena SP, Chen Q, et al. Pharmacokinetics, protein binding and metabolism of a quinoxaline urea analog as an NFkappaB inhibitor in mice and rats by LC-MS/MS. Biomed Chromatogr. 2013;27:900–9. doi: 10.1002/bmc.2880. [DOI] [PMC free article] [PubMed] [Google Scholar]
- Ghosh PB, Ternai B, Whitehouse MW. Potential antileukemic and immunosuppressive drugs. 3. Effects of homocyclic ring substitution on the in vitro drug activity of 4-nitrobenzo-2,1,3-oxadiazoles (4-nitrobenzofurazans) and their N-oxides (4-nitrobenzofuroxans) J Med Chem. 1972;15:255–60. doi: 10.1021/jm00273a012. [DOI] [PubMed] [Google Scholar]
- Howard ML, Hill JJ, Galluppi GR, McLean MA. Plasma protein binding in drug discovery and development. Comb Chem High Throughput Screen. 2010;13:170–87. doi: 10.2174/138620710790596745. [DOI] [PubMed] [Google Scholar]
- Hyneck ML, Smith PC, Munafo A, et al. Disposition and irreversible plasma protein binding of tolmetin in humans. Clin Pharmacol Ther. 1988;44:107–14. doi: 10.1038/clpt.1988.120. [DOI] [PubMed] [Google Scholar]
- Ito K, Iwatsubo T, Kanamitsu S, et al. Prediction of pharmacokinetic alterations caused by drug–drug interactions: metabolic interaction in the liver. Pharmacol Rev. 1998;50:387–412. [PubMed] [Google Scholar]
- Jahn S, Faber H, Zazzeroni R, Karst U. Electrochemistry/liquid chromatography/mass spectrometry to demonstrate irreversible binding of the skin allergen p-phenylenediamine to proteins. Rapid Commun Mass Spectrom. 2012a;26:1415–25. doi: 10.1002/rcm.6247. [DOI] [PubMed] [Google Scholar]
- Jahn S, Faber H, Zazzeroni R, Karst U. Electrochemistry/mass spectrometry as a tool in the investigation of the potent skin sensitizer p-phenylenediamine and its reactivity toward nucleophiles. Rapid Commun Mass Spectrom. 2012b;26:1453–64. doi: 10.1002/rcm.6249. [DOI] [PubMed] [Google Scholar]
- Jenkins RE, Meng X, Elliott VL, et al. Characterisation of flucloxacillin and 5-hydroxymethyl flucloxacillin haptenated HSA in vitro and in vivo. Proteomics Clin Appl. 2009;3:720–9. doi: 10.1002/prca.200800222. [DOI] [PubMed] [Google Scholar]
- Jenkinson C, Jenkins RE, Maggs JL, et al. A mechanistic investigation into the irreversible protein binding and antigenicity of p-phenylenediamine. Chem Res Toxicol. 2009;22:1172–80. doi: 10.1021/tx900095r. [DOI] [PubMed] [Google Scholar]
- Jinno F, Yoneyama T, Morohashi A, et al. Chemical reactivity of ethyl (6R)-6-[N-(2-chloro-4-fluorophenyl)sulfamoyl]cyclohex-1-ene-1-carboxylate (TAK-242) in vitro. Biopharm Drug Dispos. 2011;32:408–25. doi: 10.1002/bdd.769. [DOI] [PubMed] [Google Scholar]
- Joseph PR, Yuan Z, Kumar EA, et al. Structural characterization of BRCT-tetrapeptide binding interactions. Biochem Biophys Res Commun. 2010;393:207–10. doi: 10.1016/j.bbrc.2010.01.098. [DOI] [PMC free article] [PubMed] [Google Scholar]
- Kalgutkar AS, Didiuk MT. Structural alerts, reactive metabolites, and protein covalent binding: how reliable are these attributes as predictors of drug toxicity? Chem Biodivers. 2009;6:2115–37. doi: 10.1002/cbdv.200900055. [DOI] [PubMed] [Google Scholar]
- Kappus H, Bolt HM, Remmer H. Irreversible protein binding of metabolites of ethynylestradiol in vivo and in vitro. Steroids. 1973;22:203–25. doi: 10.1016/0039-128x(73)90086-x. [DOI] [PubMed] [Google Scholar]
- Kerksick C, Willoughby D. The antioxidant role of glutathione and N-acetyl-cysteine supplements and exercise-induced oxidative stress. J Int Soc Sports Nutr. 2005;2:38–44. doi: 10.1186/1550-2783-2-2-38. [DOI] [PMC free article] [PubMed] [Google Scholar]
- Kessler U, Castagnolo D, Pagano M, et al. Discovery and synthesis of novel benzofurazan derivatives as inhibitors of influenza A virus. Bioorg Med Chem Lett. 2013;23:5575–7. doi: 10.1016/j.bmcl.2013.08.048. [DOI] [PubMed] [Google Scholar]
- Kim H, Huang J, Chen J. CCDC98 is a BRCA1-BRCT domain-binding protein involved in the DNA damage response. Nat Struct Mol Biol. 2007;14:710–15. doi: 10.1038/nsmb1277. [DOI] [PubMed] [Google Scholar]
- Li F, Lu J, Ma X. Profiling the reactive metabolites of xenobiotics using metabolomic technologies. Chem Res Toxicol. 2011a;24:744–51. doi: 10.1021/tx200033v. [DOI] [PMC free article] [PubMed] [Google Scholar]
- Li H, Grigoryan H, Funk WE, et al. Profiling Cys34 adducts of human serum albumin by fixed-step selected reaction monitoring. Mol Cell Proteomics. 2011b;10:M110 004606. doi: 10.1074/mcp.M110.004606. [DOI] [PMC free article] [PubMed] [Google Scholar]
- Liao S, Ewing NP, Boucher B, et al. High-throughput screening for glutathione conjugates using stable-isotope labeling and negative electrospray ionization precursor-ion mass spectrometry. Rapid Commun Mass Spectrom. 2012;26:659–69. doi: 10.1002/rcm.6135. [DOI] [PubMed] [Google Scholar]
- Liu X, Shen Q, Li J, et al. In silico prediction of cytochrome P450-mediated site of metabolism (SOM) Protein Pept Lett. 2013;20:279–89. doi: 10.2174/0929866511320030006. [DOI] [PubMed] [Google Scholar]
- Liu Z, Wu J, Yu X. CCDC98 targets BRCA1 to DNA damage sites. Nat Struct Mol Biol. 2007;14:716–20. doi: 10.1038/nsmb1279. [DOI] [PubMed] [Google Scholar]
- Lokesh GL, Rachamallu A, Kumar GD, Natarajan A. High-throughput fluorescence polarization assay to identify small molecule inhibitors of BRCT domains of breast cancer gene 1. Anal Biochem. 2006;352:135–41. doi: 10.1016/j.ab.2006.01.025. [DOI] [PubMed] [Google Scholar]
- Ma S, Subramanian R. Detecting and characterizing reactive metabolites by liquid chromatography/tandem mass spectrometry. J Mass Spectrom. 2006;41:1121–39. doi: 10.1002/jms.1098. [DOI] [PubMed] [Google Scholar]
- Manke IA, Lowery DM, Nguyen A, Yaffe MB. BRCT repeats as phosphopeptide-binding modules involved in protein targeting. Science. 2003;302:636–9. doi: 10.1126/science.1088877. [DOI] [PubMed] [Google Scholar]
- Masubuchi N, Makino C, Murayama N. Prediction of in vivo potential for metabolic activation of drugs into chemically reactive intermediate: correlation of in vitro and in vivo generation of reactive intermediates and in vitro glutathione conjugate formation in rats and humans. Chem Res Toxicol. 2007;20:455–64. doi: 10.1021/tx060234h. [DOI] [PubMed] [Google Scholar]
- Meng X, Jenkins RE, Berry NG, et al. Direct evidence for the formation of diastereoisomeric benzylpenicilloyl haptens from benzylpenicillin and benzylpenicillenic acid in patients. J Pharmacol Exp Ther. 2011;338:841–9. doi: 10.1124/jpet.111.183871. [DOI] [PMC free article] [PubMed] [Google Scholar]
- Meng X, Maggs JL, Usui T, et al. Auto-oxidation of isoniazid leads to isonicotinic-lysine adducts on human serum albumin. Chem Res Toxicol. 2015;28:51–8. doi: 10.1021/tx500285k. [DOI] [PubMed] [Google Scholar]
- Michelet F, Gueguen R, Leroy P, et al. Blood and plasma glutathione measured in healthy subjects by HPLC: relation to sex, aging, biological variables, and life habits. Clin Chem. 1995;41:1509–17. [PubMed] [Google Scholar]
- Mutlib A, Lam W, Atherton J, et al. Application of stable isotope labeled glutathione and rapid scanning mass spectrometers in detecting and characterizing reactive metabolites. Rapid Commun Mass Spectrom. 2005;19:3482–92. doi: 10.1002/rcm.2223. [DOI] [PubMed] [Google Scholar]
- Nakayama S, Atsumi R, Takakusa H, et al. A zone classification system for risk assessment of idiosyncratic drug toxicity using daily dose and covalent binding. Drug Metab Dispos. 2009;37:1970–7. doi: 10.1124/dmd.109.027797. [DOI] [PubMed] [Google Scholar]
- Nakayama S, Takakusa H, Watanabe A, et al. Combination of GSH trapping and time-dependent inhibition assays as a predictive method of drugs generating highly reactive metabolites. Drug Metab Dispos. 2011;39:1247–54. doi: 10.1124/dmd.111.039180. [DOI] [PubMed] [Google Scholar]
- Nassar AE, Lopez-Anaya A. Strategies for dealing with reactive intermediates in drug discovery and development. Curr Opin Drug Discov Dev. 2004;7:126–36. [PubMed] [Google Scholar]
- Paliwal JK, Smith DE, Cox SR, et al. Stereoselective, competitive, and nonlinear plasma protein binding of ibuprofen enantiomers as determined in vivo in healthy subjects. J Pharmacokinet Biopharm. 1993;21:145–61. doi: 10.1007/BF01059767. [DOI] [PubMed] [Google Scholar]
- Patridge EV, Eriksson ES, Penketh PG, et al. 7-Nitro-4-(phenylthio)benzofurazan is a potent generator of superoxide and hydrogen peroxide. Arch Toxicol. 2012;86:1613–25. doi: 10.1007/s00204-012-0872-9. [DOI] [PMC free article] [PubMed] [Google Scholar]
- Pessetto ZY, Yan Y, Bessho T, Natarajan A. Inhibition of BRCT(BRCA1)-phosphoprotein interaction enhances the cytotoxic effect of olaparib in breast cancer cells: a proof of concept study for synthetic lethal therapeutic option. Breast Cancer Res Treat. 2012;134:511–17. doi: 10.1007/s10549-012-2079-4. [DOI] [PMC free article] [PubMed] [Google Scholar]
- Prakash C, Sharma R, Gleave M, Nedderman A. In vitro screening techniques for reactive metabolites for minimizing bioactivation potential in drug discovery. Curr Drug Metab. 2008;9:952–64. doi: 10.2174/138920008786485209. [DOI] [PubMed] [Google Scholar]
- Rappaport SM, Li H, Grigoryan H, et al. Adductomics: characterizing exposures to reactive electrophiles. Toxicol Lett. 2012;213:83–90. doi: 10.1016/j.toxlet.2011.04.002. [DOI] [PMC free article] [PubMed] [Google Scholar]
- Ricci G, De Maria F, Antonini G, et al. 7-Nitro-2,1,3-benzoxadiazole derivatives, a new class of suicide inhibitors for glutathione S-transferases. Mechanism of action of potential anticancer drugs. J Biol Chem. 2005;280:26397–405. doi: 10.1074/jbc.M503295200. [DOI] [PubMed] [Google Scholar]
- Rubino FM, Pitton M, Di Fabio D, Colombi A. Toward an “omic” physiopathology of reactive chemicals: thirty years of mass spectrometric study of the protein adducts with endogenous and xenobiotic compounds. Mass Spectrom Rev. 2009;28:725–84. doi: 10.1002/mas.20207. [DOI] [PubMed] [Google Scholar]
- Schmidt S, Gonzalez D, Derendorf H. Significance of protein binding in pharmacokinetics and pharmacodynamics. J Pharm Sci. 2010;99:1107–22. doi: 10.1002/jps.21916. [DOI] [PubMed] [Google Scholar]
- Schuhmacher J, Kohlsdorfer C, Buhner K, et al. High-throughput determination of the free fraction of drugs strongly bound to plasma proteins. J Pharm Sci. 2004;93:816–30. doi: 10.1002/jps.10588. [DOI] [PubMed] [Google Scholar]
- Shibukawa A, Kuroda Y, Nakagawa T. High-performance frontal analysis for drug–protein binding study. J Pharm Biomed Anal. 1999;18:1047–55. doi: 10.1016/s0731-7085(98)00201-5. [DOI] [PubMed] [Google Scholar]
- Simeonov A, Yasgar A, Jadhav A, et al. Dual-fluorophore quantitative high-throughput screen for inhibitors of BRCT–phosphoprotein interaction. Anal Biochem. 2008;375:60–70. doi: 10.1016/j.ab.2007.11.039. [DOI] [PMC free article] [PubMed] [Google Scholar]
- Smith PC, McDonagh AF, Benet LZ. Irreversible binding of zomepirac to plasma protein in vitro and in vivo. J Clin Invest. 1986;77:934–9. doi: 10.1172/JCI112392. [DOI] [PMC free article] [PubMed] [Google Scholar]
- Sobhian B, Shao G, Lilli DR, et al. RAP80 targets BRCA1 to specific ubiquitin structures at DNA damage sites. Science. 2007;316:1198–202. doi: 10.1126/science.1139516. [DOI] [PMC free article] [PubMed] [Google Scholar]
- Squellerio I, Caruso D, Porro B, et al. Direct glutathione quantification in human blood by LC-MS/MS: comparison with HPLC with electrochemical detection. J Pharm Biomed Anal. 2012;71:111–18. doi: 10.1016/j.jpba.2012.08.013. [DOI] [PubMed] [Google Scholar]
- Tang W, Lu AY. Metabolic bioactivation and drug-related adverse effects: current status and future directions from a pharmaceutical research perspective. Drug Metab Rev. 2010;42:225–49. doi: 10.3109/03602530903401658. [DOI] [PubMed] [Google Scholar]
- Uetrecht J. Screening for the potential of a drug candidate to cause idiosyncratic drug reactions. Drug Discov Today. 2003;8:832–7. doi: 10.1016/s1359-6446(03)02816-2. [DOI] [PubMed] [Google Scholar]
- Wang B, Matsuoka S, Ballif BA, et al. Abraxas and RAP80 form a BRCA1 protein complex required for the DNA damage response. Science. 2007;316:1194–8. doi: 10.1126/science.1139476. [DOI] [PMC free article] [PubMed] [Google Scholar]
- Wang L, Zhang YY, Liu FY, et al. Benzofurazan derivatives as antifungal agents against phytopathogenic fungi. Eur J Med Chem. 2014;80:535–42. doi: 10.1016/j.ejmech.2014.04.058. [DOI] [PubMed] [Google Scholar]
- Wen B, Fitch WL. Analytical strategies for the screening and evaluation of chemically reactive drug metabolites. Expert Opin Drug Metab Toxicol. 2009;5:39–55. doi: 10.1517/17425250802665706. [DOI] [PubMed] [Google Scholar]
- Xie F, Li BX, Broussard C, Xiao X. Identification, synthesis and evaluation of substituted benzofurazans as inhibitors of CREB-mediated gene transcription. Bioorg Med Chem Lett. 2013;23:5371–5. doi: 10.1016/j.bmcl.2013.07.053. [DOI] [PMC free article] [PubMed] [Google Scholar]
- Yan Z, Caldwell G. Optimization in drug discovery: in vitro methods. Totowa, NJ: Humana Press; 2004. [Google Scholar]
- Yang Y, Guan X. Rapid and thiol-specific high-throughput assay for simultaneous relative quantification of total thiols, protein thiols, and nonprotein thiols in cells. Anal Chem. 2015;87:649–55. doi: 10.1021/ac503411p. [DOI] [PMC free article] [PubMed] [Google Scholar]
- Yu X, Chini CC, He M, et al. The BRCT domain is a phosphoprotein binding domain. Science. 2003;302:639–42. doi: 10.1126/science.1088753. [DOI] [PubMed] [Google Scholar]
- Yuan J, Yang DC, Birkmeier J, Stolzenbach J. Determination of protein binding by in vitro charcoal adsorption. J Pharmacokinet Biopharm. 1995;23:41–55. doi: 10.1007/BF02353785. [DOI] [PubMed] [Google Scholar]
- Yuan Z, Kumar EA, Campbell SJ, et al. Exploiting the P-1 pocket of BRCT domains toward a structure guided inhibitor design. ACS Med Chem Lett. 2011a;2:764–7. doi: 10.1021/ml200147a. [DOI] [PMC free article] [PubMed] [Google Scholar]
- Yuan Z, Kumar EA, Kizhake S, Natarajan A. Structure-activity relationship studies to probe the phosphoprotein binding site on the carboxy terminal domains of the breast cancer susceptibility gene 1. J Med Chem. 2011b;54:4264–8. doi: 10.1021/jm1016413. [DOI] [PMC free article] [PubMed] [Google Scholar]