

Abstract
In drug discovery, it is generally accepted that neighboring molecules in a given descriptors' space display similar activities. However, even in regions that provide strong predictability, structurally similar molecules can occasionally display large differences in potency. In QSAR jargon, these discontinuities in the activity landscape are known as ‘activity cliffs’. In this study, we assessed the reliability of ligand docking and virtual ligand screening schemes in predicting activity cliffs. We performed our calculations on a diverse, independently collected database of cliff-forming co-crystals. Starting from ideal situations, which allowed us to establish our baseline, we progressively moved toward simulating more realistic scenarios. Ensemble- and template-docking achieved a significant level of accuracy, suggesting that, despite the well-known limitations of empirical scoring schemes, activity cliffs can be accurately predicted by advanced structure-based methods.
Keywords: Activity Cliffs, Docking, Multiple Receptor Conformations Docking, Ensemble Docking, Template Docking, ICM, ALiBERO, Virtual Ligand Screening
Introduction
In medicinal chemistry, it is usually accepted that structurally similar compounds share similar biological activities. Activity cliffs are exceptions. An activity cliff is formed when a pair of structurally similar molecules display a large difference in potency.1 Understanding activity cliffs is a key feature of modern structure-activity relationship (SAR) studies.2 However, studying activity cliffs is not easy, as it raises the problematic question of how to practically define an activity cliff. Two key criteria are often used: i) the similarity criterion and ii) the potency difference criterion.3 The first criterion depends heavily on the metric used to assess compound similarity (i.e. ‘local’ vs. ‘global’ molecular similarity). The second depends on the specific experimental assay used for activity measurements. The concept of activity cliff formation is thus heavily affected by the context, depending on the target and the adopted molecular representation. Furthermore, establishing a threshold for discriminating between high and low structural similarities is an arbitrary process, which could lead to biasing of the activity cliff assessment. These uncertainties mean that computational analysis of activity cliffs in large compound datasets is challenging and potentially questionable.4-6 Therefore, researchers are beginning to adopt a consistent definition of activity cliffs that looks at similarity in terms of matched molecular pairs (MMP), and extracting activity data from publicly available repositories.7-9
Despite these challenges, modern drug discovery should consider activity cliff formation. It is undeniable that structural similarity does not always equate to biological similarity, as presented in compelling examples by Kubinyi.10 For this reason, computational tools aimed at efficiently predicting activity cliffs could be valuable for hit-to-lead and lead optimization campaigns.2,3,11 Cruz-Monteagudo et al have recently reviewed some relevant contributions.4 Bajorath and co-workers identified several chemical transformations that are preferentially responsible for activity cliff formation in different classes of compounds active against diverse targets.12 Several analysis tools, e.g. the SAR index (SARI)13 or the structure-activity landscape index (SALI),14,15 have been devised to mine large molecular datasets for activity cliffs at the two-dimensional (2D) level. Moving from MMPs to SAR analysis, the concept of ‘activity ridges’ (multiple overlapping activity cliffs formed by a series of cliff-forming compounds) has been introduced,16 and, subsequently, the three-dimensional (3D) similarity assessment of activity cliffs has been proposed by Bajorath and co-workers.17 Here, the comparison is directly performed on experimentally-determined binding modes. In contrast to approaches focusing primarily on the ligand, Seebeck and colleagues proposed a method to identify activity cliffs that considers the structure of the target and derives target-specific pharmacophore constraints.18
A 3D interpretation of activity cliffs is based on the idea that local differences in an overall similar pattern of contacts with the target can explain the potency difference between cliff-forming partners.19 This approach is relevant as it expands the ligand-centric view of 2D activity cliffs.20 Small modifications of the ligand structure may compromise important interactions with the receptor or hamper the ability of the binding site to adopt an energetically favorable conformation, significantly shifting the new compound's potency away from the parent one, and thereby forming an activity cliff. At the structural level, activity cliffs can be analyzed and compared in terms of hydrogen bond formation, ionic interactions, lipophilic or aromatic group interactions, presence of explicit water molecules, stereochemistry, or a combination of these.19 In this light, it would be natural to consider a structure-based approach as well suited to studying and predicting activity cliffs. As long as we were able to: i) predict the 3D conformation of the complex formed by a ligand at its receptor binding site, and ii) provide a reasonable estimate of the binding free energy, in principle, we should be able to predict activity cliffs. Is this actually the case? One possible approach could rely on pathway-based methods for free energy calculations.21 Computational protocols based on docking, free energy perturbation (FEP), and molecular dynamics can lead to binding affinity predictions in good agreement with the experimental data.22 In recent years, thanks to improvements in the quality of force fields, sampling methods and hardware solutions, the throughput of this kind of studies increased to up to thousands of molecules per year.23 For example, Wang and colleagues, while the present study was under review, reported an automated methodology that, combining FEP and advanced enhanced sampling methods while exploiting the computational power of GPUs, was efficiently used in prospective drug discovery campaigns.24 Other authors have favored a different strategy based on end-point methods: MM-PB(GB)/SA rescoring of bound ligand conformations generated by ligand docking. In fact, pairing MM-GBSA rescoring with advanced docking schemes, it is possible to improve the accuracy of docking results.25,26 Also in this case, highly automated implementations can be conceived.27
In this paper, we report on the study of 3D activity cliffs (3DAC) by means of an advanced docking engine. We study a set of 146 3DACs formed in 9 different pharmaceutically relevant protein targets, extracted from a database previously compiled by Hu and co-workers from publicly available structural data.19 Starting from an ideal scenario, we gradually increased the complexity of the simulation scheme in order to resemble, as closely as possible, real-life prospective drug discovery efforts. While structure-based methods have already been applied to some specific case studies28-30 with the aim of rationalizing 3DAC formation, the one outlined here is, to our best knowledge, the most comprehensive study on applying ligand docking and virtual ligand screening (VLS) to rationalize and address 3DACs.
Methods
3DAC database
A 3DAC database encompassing 215 3DAC pairs was previously compiled by Hu and colleagues19 according to a procedure which is here briefly summarized. Protein-ligand complexes, for which detailed potency measurements were determined and available in ChEMBL31 and Binding DB,32 were filtered out from the PDB, and targets with two or more small molecule ligands available were selected. The similarity of the ligands was assessed by both 2D Tanimoto similarity33 and 3D similarity function,34 taking into account the positional, conformational, and chemical differences between the binding modes of the compounds. In the original database, two molecules were considered cliff partners only if: i) they shared at least 80% 3D similarity, and ii) their potency differed by at least two orders of magnitude. 3DACs were formed by 268 X-ray structures of protein-ligand complexes collected from the PDB, spanning over 38 different UniProt families. In the study described here, only nine molecular targets displaying five or more 3DACs were considered. Due to mutations in the binding site, entry 2IW8 from the CDK2 family was removed. The final 3DAC dataset encompassed 9 pharmaceutically relevant targets (see Table 1) and overall 158 unique protein-ligand complexes (PDB IDs) forming 146 3DACs (including two S/R optical isomers in both their forms). The targets were: Cyclin-dependent kinase 2 (CDK2; UniProt: P24941), Prothrombin (THRB; UniProt: P00734), Heat shock protein HSP 90-alpha (HS90A; UniProt: P07900), Coagulation factor X (FA10; UniProt: P00742), Leukotriene A-4 hydrolase (LKHA4; UniProt: P09960), Beta-secretase 1 (BACE1; UniProt: P56817), Proto-oncogene tyrosine-protein kinase Src (SRC; UniProt: P12931), Mitogen-activated protein kinase 14 (MK14; UniProt: Q16539), and Serine/threonine-protein kinase Chk1 (CHK1; UniProt: O14757).
Table 1.
Overview of the pharmaceutically relevant 3DAC-forming complexes included in this study.
| UniProt id | Protein | #3DAC | #Ligs. | #Confs. | PDB codes |
|---|---|---|---|---|---|
| P24941 | CDK2 | 26 | 36 | 34 | 1g5s, 1h00, 1h01, 1h1q, 1h1r, 1h1s, 1pxp, 1vyz, 1y8y, 1y91, 1ykr 2c5n, 2c6i, 2g9x, 2iw6, 2r3h, 2r3i, 2r3j, 2uzb, 2uzd, 2uze, 2uzo, 2vtl 2vtm, 2vtn, 2vtp, 2vtr, 2w05, 2w17, 2xmy, 3ddq, 3dog, 3ig7, 3igg |
|
| |||||
| P00734 | THRB | 24 | 28 | 28 | 1c4v, 1g32, 1kts, 1ktt, 1nm6, 1nt1, 1ta6, 1tom, 1ypl, 2a2x, 2anm 2jh0, 2jh5, 2pks, 2zc9, 2zff, 2zfp, 2zgb, 2zgx, 2zhq, 2zi2, 2znk, 2zo3 3da9, 3dhk, 3dux, 3egk, 3f68 |
|
| |||||
| P07900 | HS90A | 17 | 17 | 17 | 1uy6, 1uy7, 1uy8, 1uy9, 1uyc, 1uyd, 1uyf, 1uyg, 1uyh, 2cct 2fwy, 2fwz, 2uwd, 2vcj, 3bmy, 3ekr, 3k97 |
|
| |||||
| P00742 | FA10 | 11 | 12 | 12 | 1mq5, 1mq6, 2ei6, 2fzz, 2p94, 2p95, 2phb, 2vwl, 2vwm, 2w26 2xc5, 3kqe |
|
| |||||
| P09960 | LKHA4 | 23 | 15 | 15 | 3chp, 3chq, 3chr, 3chs, 3fh5, 3fh8, 3fhe, 3fts, 3ftu, 3ftv, 3fty, 3fu0 3fui, 3fum, 3fun |
|
| |||||
| P56817 | BACE1 | 18 | 26 | 26 | 1w51, 2iqg, 2oah, 2ph8, 2qk5, 2qmg, 2qp8, 2viy, 2viz, 2vj6, 2vkm 2vnm, 2vnn, 2wf0, 2wf1, 2wf4, 2xfi, 2xfk, 3dm6, 3ixj, 3l5d, 3l5e 3lnk, 3lpj, 3msj, 3msl |
|
| |||||
| P12931 | SRC | 15 | 9 | 9 | 1o42, 1o43, 1o44, 1o45, 1o47, 1o48, 1o49, 1o4a, 1o4b |
|
| |||||
| Q16539 | MK14 | 7 | 9 | 9 | 1wbs, 1wbt, 1wbv, 2zb1, 3d7z, 3d83, 3e93, 3hll, 3hp2 |
|
| |||||
| O14757 | CHK1 | 5 | 8 | 8 | 2c3k, 2c3l, 2hog, 2hxl, 2hxq, 2hy0, 2wmu, 2wmw |
Receptors and ligands preparation
Experimental 3D coordinates of protein-ligand complexes, as retrieved from the PDB, were used to generate standard ICM objects.35 During the initial step, hydrogen atoms and missing heavy atoms were added, atom types and charges were assigned from residue templates, and molecules were assigned internal coordinates. Missing side chains and polar hydrogen atoms were optimized and assigned a low energy conformation. The cognate ligands were deleted from the complexes upon optimization.36 Where relevant for binding site composition, structural ions were retained. Other chains, prosthetic groups, and heteroatoms not involved in defining the ligand binding site were deleted. 3D coordinates of the ligands from the 158 crystallographic complexes were extracted and converted to the ICM internal coordinates format. Stereochemistry, hydrogen atoms, and formal charges (according to ICM pKa model at pH equal to 7) were assigned. Each ligand was also assigned MMFF37 force field atom types and partial charges. Upon conversion, the initial binding score of each ligand-receptor complex was calculated without any further optimization by means of the standard ICM empirical scoring function.38
ICM docking
ICM docking procedure uses Monte Carlo sampling to globally optimize a fully flexible ligand (in internal coordinates) within the protein binding site, represented by five pre-calculated grid potential maps.38,39 The ligand binding site was defined by including all residues with at least one non-hydrogen atom within a 5 Å cut-off distance from the co-crystallized ligand. The grid potential maps were calculated on a rectangular mesh encompassing the ligand binding site, and extended an additional 4 Å in any direction. Every time, two independent Monte Carlo runs were performed, adjusting the simulation length according to the default thoroughness value of 1. The five poses assigned the best energies during each Monte Carlo run were rescored by the ICM empirical scoring function. The quality of the results was assessed by computing the RMSD between the coordinates of non-hydrogen atoms of the overall top-scoring ligand pose with respect to those of the crystallographic native pose. A heavy-atom RMSD ≤ 2 Å cut-off was applied as a measure of success. A self-docking exercise (namely, each ligand was docked back into its cognate crystallographic receptor structure) was carried out on all individual complexes. For consistency, the docking procedure was carried out by applying exactly the same protocol on each complex. Subsequently, for each protein family, all binders were docked to all protein conformers, and the results were analyzed in terms of (1) Single Receptor Conformation (SRC) cross-docking, i.e. if ligands A and B forming a 3DAC were co-crystallized with the same protein in complexes A and B, we assessed the performance of ligand A within receptor B and vice versa; (2) Multiple Receptor Conformation (MRC) docking, in which cliff-forming ligands were assigned the best score obtained across individual runs on all receptor conformers, but excluding the scores obtained from the ligand's cognate receptor.40
MRC docking with optimally selected pocket conformers
The ALiBERO41 algorithm typically consists of two main steps: i) generation of a local population of receptor conformers, and ii) flexible-ligand rigid-receptor small scale Virtual Ligand Screening (VLS), from which the best-performing ‘children’ pockets are selected for iterative pocket optimization. Here, only the second step of the ALiBERO procedure was taken, selecting the best performing pocket variants among X-ray structures without generating new optimized conformers. The protein-ligand complexes within each of the nine protein targets explored were structurally aligned and superimposed according to ICM iterative procedure.38 After superimposition, a consistent definition of the binding pocket residues was adopted including all amino acids within 5 Å from all the co-crystallized ligands. Two independent sets of calculations were carried out. In the first exercise, the ALiBERO engine was used to select the team of pocket variants that better separates 3DAC-forming ligands according to their pIC50 values, discriminating more active cliff partners from the less active ones (ALiBERO-Set). This procedure was applied to all protein targets, with the VLS performance measured by the NSQ_AUC fitness function. The docking calculations were performed once for each receptor conformation, without using the subsequent Monte Carlo refinement step. The maximum number of complementary pockets was set to 6.
In the second application of ALiBERO, the ability to correctly predict 3DAC was assessed by assigning to cliff partners the scores generated by the team of selected pockets that better separated decoys from actual ligands. This latter experiment was performed on four pre-selected protein targets (CDK2, HS90A, THRB, and FA10). All 3DAC-forming ligands were labeled as active, while the decoys specific for each of the individual proteins were regarded as inactive. Decoy sets (bona fide non-binders) for CDK2, THRB, HS90A, and FA10 protein families were retrieved from the Database of Useful Decoys (DUD, http://dud.docking.org).42 The decoy libraries comprised 2053 molecules (CDK2), 1490 molecules (THRB), 970 molecules (HS90A), and 594 molecules (FA10), respectively, keeping the ligand to decoy ratio in the range of 1:50 – 1:57. The four decoy libraries were retrieved as SDF files. Hydrogen atoms and charges were assigned automatically by ICM.
Template docking
Experimental 3D coordinates of the 3DAC-forming protein-ligand complex containing the more potent ligand (ligand A (Lig-A) at receptor A (Rec-A)) were retrieved from the PDB, and used to generate standard ICM objects according to the procedure described above.35 In this case, the crystallographic water molecules present in the experimental 3D coordinates were retained and their orientations optimized. The binding site was defined around the co-crystallized ligand, retaining explicit water molecules as well as structural ions, if present. The receptor grid potential maps were calculated on a rectangular mesh with a default value box margin of 3 Å in any direction around the ligand. The ligand was then subjected to one cycle of energy minimization (to limit the ligand's strain) and the Lig-A score in Rec-A was calculated. Subsequently, the stronger binder Lig-A was used to constrain the posing of the weaker ligand (Lig-B) of the respective 3DAC. The bound pose of Lig-B underwent one cycle of energy minimization before the Lig-B score was assigned.
Similarity Assessment
The similarity between the networks of interactions established by the 3DAC-forming pairs at the binding pocket was numerically assessed by a procedure previously developed in house.43,44 The script i) enumerates the atomic contacts existing between heavy ligand and protein atoms of the target structure (Lig-A at Rec-A) and the model structure (Lig-B at Rec-A), and ii) assembles vectors of atomic contact strengths for all ligand-protein atom pairs in the target structure and in the model. The strength of each contact is calculated by a continuous function. Then, a third vector (the match contact vector) is constructed, assigning to each contact the lower weight obtained between target and model. The weight of the match vector is expressed as a summation of each individual contribution and it is compared to the weight of the target contact strength vector. The similarity between the two patterns of interactions fraction is thus reported as recall of the target structure contacts.
Collection and preparation of random non-binders
To explore the statistical reliability of the implemented scoring scheme in predicting 3DACs, we generated a Gaussian distribution of scores assigned to random drug-like molecules (bona fide non-binders). A collection of 1960 drug-like molecules (Mw ≤ 500 and ≥ 150, XlogP ≤ 5, rotatable bonds ≤ 7, PSA < 150, HB-donors ≤ 5, and HB-acceptors ≤ 10) was randomly selected from the ZINC database v.12 (https://docking.org).45 These ligands were automatically prepared according to the standard ICM procedure and docked at all receptor conformations of four pre-selected target families (CDK2, HS90A, THRB, and FA10). The ratio of binders to non-binders was in the range of 1:54 to 1:163.
Data analysis and figures of merit
To assess the reliability of a structure-based method in predicting 3DAC on a specific protein family, the overall performance on each protein family was measured by a cliff score (CS), a normalized value that ranges between 0 (100% inaccurate) and 1 (100% accurate):
| (1) |
where n is the number of activity cliffs (3DAC). ΔScore, a partial score obtained by individual 3DACs, is calculated as follows:
| (2) |
where score-a and score-b are scores assigned to the cliff-forming partners.
In this way, the contribution of each individual 3DAC depends on how significant the difference between the binding scores of the two cliff partners (score-a and score-b) actually is. ΔScore ranges between 0 and 1, with lower values of ΔScore (≤ 0.5) indicating successfully predicted 3DAC. This sigmoidal shape function makes it possible to simultaneously take into account whether the activities of the two partners were correctly ranked and how significant the difference was in terms of assigned scores.
To provide a more conservative estimate of prediction accuracy, a cut-off value of 2.8 score units was also introduced. This cutoff approximates the thermodynamic difference in terms of free energy of binding (2.8 kcal/mol) between two binders whose activities (pIC50) are two orders of magnitude apart. Because of the stochastic nature of ICM Monte Carlo sampling, it is also worth emphasizing that this threshold value is well above the average range of two standard deviations around the mean energy value provided by iterated docking runs returning poses within the success threshold. Any 3DACs with score difference ≤ 2.8 were then considered as dubiously assigned and regarded as incorrect. Results for all computations were reported with and without applying the cut-off. When applied to CS, the cut-off value translated into a 0.5 empirical correction to be added to those ΔScore values generated by a difference in terms of score-a and score-b ≤ 2.8. In turn, this negatively affected the resulting CS of the protein family (CS became smaller).
To assess the overall VLS performance, we applied the area under the receiver operating characteristic (ROC) curve, abbreviated as AUC,46 figure of merit. Moreover, we adopted a normalized square root AUC version (NSQ_AUC),47 which is more sensitive to early hit enrichment.
To evaluate the statistical significance of the cliff-forming ligand-binding scores obtained by MRC VLS with respect to scores generated by random non-binders, we assumed that score values were distributed according to a Gaussian distribution. Hence, we could calculate the standardized value of the binding score, the Z score (Z) as:
| (3) |
where MRCscore is the best score obtained by a ligand across the pocket conformations, excluding its own cognate receptor, χ̄ is the mean score obtained by the non-binders, and s is the standard deviation.
Software and Hardware
All the receptor and ligand preparations, the ICM binding score calculations, docking simulations, as well as the energy evaluations were carried out using ICM 3.8 (Molsoft LLC, San Diego, CA). The docking simulations were performed on a Linux Quad-core AMD workstation (8 CPUs).
Results and Discussion
3DACs Database
The systematic identification and classification of molecular similarity, and careful selection of the activity data from repositories is crucial for activity cliff analysis. In this work, we used a previously compiled database of 3DACs19 to adopt widely accepted and published standards.48 From the initial 3DACs collection,19 we retained a selection of 9 pharmaceutically relevant molecular targets. Our database encompassed 158 unique X-ray structures, forming 146 3DACs (see Table 1). In particular, each target was represented by 8 to 34 conformers, co-crystallized with 8 to 36 ligands (including three optical isomers that were explored in both configurations), forming 8 to 26 3DAC pairs per molecular target. Considering the matched molecular pair (MMP) formalism4 which defines MMP as a pair of compounds that only differ at a single site represented by a substructure (such as a ring or an R-group), our database comprised 23 MMPs (15%) while all the other 3DACs contained multiple substructure modifications, and 31 (20%) even contained scaffold modifications (including three isosteres). The formation of an activity cliff is usually regarded as an isolated event (i.e. structural neighbors of cliff-forming compounds are not taken into account). However, it has been shown that activity cliffs are often formed in a coordinated manner.16 These groups of cliff-forming compounds produce a so-called ‘activity ridge’. Activity ridges usually encompass multiple compounds spanning over different degrees of potency. They are thus much more informative than individual cliffs in terms of structure-activity relationships.49 While we could identify activity ridges among the ligands of the four most populated target families described here (see Figure S1 in the Supporting Information), the focus of our study remained activity-cliff-forming pairs of compounds, and results will be analyzed accordingly.
Overview of 3DAC prediction protocols
Our results will be presented in terms of increasing practical applicability of the adopted docking schemes. Figure 1 is a schematic overview of the workflow. In the first series of calculations, we explored the accuracy of unconstrained docking schemes, namely protocols in which the conformational space of both cliff-forming partners is independently explored within the binding pocket. Here, we started from what could be considered an ideal situation: i) we simply calculated the binding score for the crystallographic ligand pose in its cognate, experimentally-solved pocket conformation. Then, we performed: ii) SRC docking of each ligand with its cognate receptor structure (self-docking), followed by iii) SRC cross-docking across the two cliff-forming structures. Moving to increasingly more realistic scenarios, we assessed the performance of free docking schemes in predicting 3DACs in situations more and more closely resembling prospective drug discovery endeavors. On each target family, we performed: iv) multiple receptor conformation (MRC) docking studies of all binders against all the receptor conformations. In line with our previously reported studies, this approach can be considered a practical way to implement receptor flexibility.40,50 Then, we used the ALiBERO paradigm, attempting v) to select the sub-ensemble of receptor conformers most suited at separating cliff partners, and vi) to identify the family of pocket variants that provides the best enrichment of true binders in a retrospective virtual ligand screening (VLS) run, concurrently estimating the ability of this structural ensemble to predict 3DAC.
Figure 1.

Overview of the 3DAC prediction protocols reported in this study. Different docking and virtual screening approaches were applied to a pre-compiled benchmark, gradually shifting from an ideal situation toward more realistic scenarios.
Then, we performed a second set of calculations, introducing the template docking approach. Here, we assumed that: vii) the bound conformation of one of the cliff-forming ligands was experimentally known and could be used to guide the prediction of the binding mode of the partner compound. Finally, we explored a situation in which viii) the bound pose of the more potent cliff-forming compound was predicted by means of docking at the ALiBERO-Set, the ALiBERO-selected receptor conformation set that better separates cliff-partners, and this pose was in turn used as template to generate the binding pose of the weaker 3DAC partner.
Prediction of 3DACs from crystallographic complexes
By means of a straightforward estimation of the ligand binding score within the crystallographic complexes, we were able to establish a baseline for the ability of an advanced docking procedure to correctly predict 3DACs. This approach can be considered a pure assessment of the scoring function performance, with no noise generated by a less than exhaustive sampling or a non-perfectly adapted receptor structure. Results for the individual receptors are summarized in Table 2 and graphically represented in Figure 2. In the most simple accuracy evaluation approach, a prediction was considered successful when, comparing the raw binding scores of the cliff-forming complexes, the complex formed by the more potent ligand was assigned a better (more negative) score. In this way, correctly predicted 3DACs ranged between 27% (FA10) to 92% (THRB), with a median performance of 71% (HS90A, MK14). However, this success measure is somewhat crude because it completely ignores the extent of the score differences. When a 2.8 score units cut-off was taken into account (see Methods), the overall success rate decreased, as expected, but not dramatically, ranging from 9% (FA10) to 79% (THRB), with a median performance of 57% (MK14). When the performance of each protein family was assessed by means of the cliff score (CS, see Methods), values spanned between 0.28 and 0.85 without applying the cut-off, and between 0.19 and 0.79 when the cut-off was applied. While the two assessment methods usually highlight similar trends, CS figures, incorporating in a continuous way the difference between simple docking scores (score-a and score-b) obtained by the 3DAC-forming partners, provides a more accurate insight into the target performance, reaching beyond a simple binary (correct/not correct) assessment of 3DAC predictions.
Table 2.
3DAC prediction using binding score calculation of crystallographic complexes, SRC self-docking, and cross-docking.a
| Protein | SRC 3DAC separation (no cut-off) | SRC 3DAC separation (2.8 units cutoff) | ||||
|---|---|---|---|---|---|---|
| ICM Bind.Sc | Self-dock | Cross-dock | ICM Bind.Sc | Self-dock | Cross-dock | |
| CDK2 | 19/26 (73%) | 19/26 (73%) | 14/26 (54%) | 16/26 (62%) | 14/26 (54%) | 11/26 (42%) |
| CS: 0.70 | CS: 0.68 | CS: 0.54 | CS: 0.64 | CS: 0.59 | CS: 0.48 | |
|
| ||||||
| THRB | 22/24 (92%) | 18/24 (75%) | 16/24 (67%) | 19/24 (79%) | 17/24 (71%) | 13/24 (54%) |
| CS: 0.85 | CS: 0.76 | CS: 0.64 | CS: 0.79 | CS: 0.74 | CS: 0.60 | |
|
| ||||||
| HS90A | 12/17 (71%) | 13/17 (76%) | 11/17 (65%) | 7/17 (41%) | 10/17 (59%) | 5/17 (29%) |
| CS: 0.68 | CS: 0.74 | CS: 0.58 | CS: 0.53 | CS: 0.65 | CS: 0.41 | |
|
| ||||||
| FA10 | 3/11 (27%) | 3/11 (27%) | 7/11 (64%) | 1/11 (9%) | 2/11 (18%) | 4/11 (36%) |
| CS: 0.28 | CS: 0.29 | CS: 0.57 | CS: 0.19 | CS: 0.25 | CS: 0.43 | |
|
| ||||||
| LKHA4 | 11/23 (48%) | 17/23 (74%) | 8/23 (35%) | 9/23 (39%) | 15/23 (65%) | 6/23 (26%) |
| CS: 0.48 | CS: 0.74 | CS: 0.31 | CS: 0.43 | CS: 0.70 | CS: 0.24 | |
|
| ||||||
| BACE1 | 15/18 (83%) | 11/18 (61%) | 8/18 (44%) | 14/18 (77%) | 11/18 (61%) | 6/18 (33%) |
| CS: 0.80 | CS: 0.65 | CS: 0.45 | CS: 0.78 | CS: 0.65 | CS: 0.39 | |
|
| ||||||
| SRC | 12/15 (80%) | 11/15 (73%) | 8/15 (53%) | 9/15 (60%) | 9/15 (60%) | 7/15 (47%) |
| CS: 0.74 | CS: 0.70 | CS: 0.55 | CS: 0.64 | CS: 0.63 | CS: 0.52 | |
|
| ||||||
| MK14 | 5/7 (71%) | 4/7 (57%) | 2/7 (29%) | 4/7 (57%) | 4/7 (57%) | 2/7 (29%) |
| CS: 0.67 | CS: 0.57 | CS: 0.30 | CS: 0.60 | CS: 0.57 | CS: 0.30 | |
|
| ||||||
| CHK1 | 3/5 (60%) | 3/5 (60%) | 1/5 (20%) | 1/5 (20%) | 1/5 (20%) | 0/5 (0%) |
| CS: 0.47 | CS: 0.51 | CS: 0.15 | CS: 0.27 | CS: 0.31 | CS: 0.05 | |
The results are presented as a ratio of successfully-predicted cliff pairs with respect to the total number of 3DACs in the family. The percentage of the successful predictions is also shown, as well as the weighted protein cliff score (CS, ranging from 0 to 1).
Figure 2.

Accuracy of 3DAC recognition for the 9 targets in this work using different methods. 3DAC prediction accuracy is evaluated as a cliff score (CS) as described in Methods. Results are reported according to a) simple CS (no cut-off applied) and b) CS with a cut-off of 2.8 score units. Each bar represents a different protocol: binding score calculations (white), SRC cognate receptor self-docking (yellow), SRC cross-docking (orange), MRC with co-crystals excluded (red), and retrospectively identified ensembles of experimental protein conformers selected by ALiBERO (ALiBERO-Set, light purple). The performance of the template docking approach with the pose of Lig-A, obtained either experimentally (X-ray) (purple) or from docking at an ALiBERO-Set (turquoise), is also reported. Black arrows highlight results obtained by protocols resembling realistic scenarios.
The variability between successful and unsuccessful 3DAC predictions made by simple estimation of the ligand's binding energy was quite remarkable, considering that neither ligand sampling nor structure optimization was performed at this stage. However, X-ray structures are spatially and temporally averaged experimental outputs. They could therefore sometimes present a less than fully reliable picture of the actual protein-ligand complex.51 Since no filtering measure aimed at assessing the quality of the crystals was taken into account when the benchmark was compiled, it is reasonable to assume that, in some specific cases, the final results could have benefited from some form of refinement.38
Prediction of 3DACs by SRC self-docking
In SRC self-docking, the co-crystallized ligands were docked into their cognate receptors. In this way, we were able to take into account the role of ligand conformational sampling within a perfectly adapted binding pocket in predicting 3DACs. In over 95% of the protein-ligand complexes explored in this study, the native pose could be recovered within the 2.0 Å threshold. Only 7 out of 158 protein-ligand complexes were poorly reproduced in self-docking runs. In other words, predictions related to 8 out of 146 cliff pairs could not be considered fully reliable because at least one of the assigned scores was not generated by a pose closely resembling the native one. Ligands incorrectly docked into their cognate receptor conformations were: three BACE1-binders (3L5D, 3MSJ, 3MSL), two LKHA4-binders (3CHP, 3FU0), one HS90A-binder (1UY8), and one THRB-binder (2PKS). The overall self-docking results are summarized in Table 2 and graphically represented in Figure 2. A direct comparison of self-docking scores assigned to cliff-forming complexes correctly predicted 3DACs in a range between 27% (FA10) and 76% (HS90A), with a median performance of 61% (BACE1). When the 2.8 units cut-off was taken into account, the overall success rate slightly decreased, as expected, ranging from 18% (FA10) to 71% (THRB), with a median performance of 59% (HS90A). When the performance of each protein family was assessed by means of CS, values spanned between 0.29 and 0.76 without a cut-off, and 0.25 and 0.74 when the cut-off was applied. Results provided by self docking were still representative of an ideal situation and, for this reason, it is not surprising that they were indeed in line with those provided by a simple binding score estimation (Figure 2). The LKHA4 family is the exception to this close correlation, with self-docking significantly outperforming the assessment provided by simple binding score estimations. This can be explained by considering that, in specific crystallographic complexes, even a limited structural refinement, in this case provided by the ligand sampling procedure, can optimize the binding mode according to the adopted force field, resulting in 3DAC predictions that are more in line with the experimental results.38
Prediction of 3DACs by SRC cross-docking
In the cross-docking step, we docked the 3DAC-forming ligands to their cliff partner's receptor conformation. Thus, in each cliff pair A-B, Lig-A was docked at Rec-B, and Lig-B was docked at Rec-A. This exercise was fundamental to understanding the putative role of local structural rearrangements in the pocket on cliff predictions by means of docking.52,53 The overall cross-docking results are summarized in Table 2 and graphically represented in Figure 2. When directly comparing the cross-docking scores, the correctly predicted 3DACs ranged between 20% (CHK1) to 67% (THRB), with a median performance of 53% (SRC). Here too, taking in account a 2.8-unit cut-off, the overall success rate decreased, but this time more significantly. The 3DACs predictive ability dropped to 0% for the CHK1 family (a small family encompassing only five cliff-pairs), while the THRB family had the best result with only 54% of correctly predicted 3DACs. The median performance was 33% (BACE1). CS values ranged between 0.15 (CHK1) and 0.64 (THRB) without a cut-off, and 0.05 (CHK1) and 0.60 (THRB) when the cut-off was applied. In 8 out of 9 targets, the ability to predict 3DACs deteriorated with respect to self-docking. This points to a relevant role for local pocket rearrangements in 3DAC predictions: being able to correctly predict local rearrangements at the binding pocket can actually be one of the most important advantages of docking protocols in predicting cliffs with respect to ligand-based methods.
In an attempt to take an intermediate step toward an unbiased and more challenging scenario, we also considered the case in which only one of the 3DAC-forming ligands was co-crystallized at its target's binding site. In this combined protocol, the scores of Lig-A at Rec-A were obtained by means of ICM binding score calculations or SRC self-docking, respectively, while the scores of Lig-B were retrieved from the cross-docking at Rec-A. The results are summarized in Table S1, and graphically represented in Figure S2 in the Supporting Information. Overall, these calculations provided comparable 3DAC predictive ability with respect to the individual protocols discussed above. These results are particularly interesting considering that hit optimization protocols based on the systematic exploitation of crystallography are becoming increasingly popular.
Prediction of 3DACs by MRC docking
Applying a Multiple Receptor Conformations (MRC) docking protocol, we accounted for a certain degree of receptor flexibility. In each family, all co-crystallized ligands were docked at each pocket variant and each ligand was assigned the best score obtained among the individual runs. Furthermore, we did not include the scores obtained upon docking ligands to their cognate receptors, as this would have introduced a bias toward the optimized native conformation. If a ligand achieved the top score upon docking at its cognate receptor, that score was omitted, and the second best score displayed by that ligand (in a different receptor conformer) was considered. In this way, we were able to apply an unbiased MRC docking protocol, mimicking the real-life situation when the structural data of the protein-ligand complexes are not known prior to docking simulations. Results for the individual receptors are summarized in Table 3 and graphically represented in Figure 2. When we simply compared the MRC-docking scores of the cliff-forming complexes, correctly predicted 3DACs ranged between 35% (HS90A) and 77% (CDK2), with a median performance of 67% (67% SRC). When the 2.8-unit cut-off was considered, the overall success rate decreased, ranging from 24% (HS90A) to 64% (FA10), with a median performance of 44% (44% BACE1). Assessing the performance of each protein family by means of the cliff score, the CS values spanned between 0.37 (HS90A, LKHA4) and 0.69 (THRB) without a cut-off, and 0.31 (HS90A) and 0.64 (FA10) with the cut-off applied. On average, and with the only exception being the HS90A family, MRC docking significantly outperformed the SRC approach. Analyzing the data from another angle, we attempted to establish whether some specific conformations of the receptor were systematically providing a better performance with respect to the others. We also assessed whether the ensemble ability to predict 3DACs was superior to all single variants or at least to the majority of them. In line with the analysis that we previously reported,52 results for individual runs and MRC docking were ranked in terms of success rate at correctly predicting 3DACs. The percentile in which the MRC accuracy fell is reported in Table 3. For example, when the ensemble approach systematically outperformed all the individual runs, the ensemble performance fell in the 100th percentile. Conformations displaying accuracy over 75% are explicitly listed (Table 3). For the CDK2 family, the cliff-predicting power of MRC docking fell in the 100th percentile, and in two more cases the MRC score fell in the 90th percentile and above (THRB and FA10). Furthermore, the top MRC docking score was well above the 65th percentile in 6 out of 9 protein families. It is worth pointing out that, while families such as THRB and CDK2 consistently displayed above-average performance in all of the docking protocols, the performance of FA10 increased in parallel to the accuracy of the protocol. MRC docking fell in the 90th percentile (with and without the cut-off value applied) outperforming most of the individual conformers and achieving an overall accuracy even better than that obtained in self-docking and simple binding score calculations. While it is quite counterintuitive that docking results can improve when a non-native receptor structure is used, this behavior is known and has previously been reported,53 further highlighting the fundamental role of receptor flexibility in docking studies. We can summarize the results of the MRC docking performed to correctly separate stronger and weaker 3DAC-forming binders as follows: i) the performance of 3DAC predicting methods depends on the protein family examined and, within that, on the specific crystallographic structure being used; ii) without any a priori knowledge of the nature of the pocket, the MRC approach statistically provides better results than a randomly selected pocket conformation.
Table 3.
3DAC prediction using MRC docking.a
| Protein | MRC 3DAC separation | MRC 3DAC separation | Best Pockets (predictive %) | ||
|---|---|---|---|---|---|
| no cut-off | SRC variants | 2.8 units cut-off | SRC variants | ||
| CDK2 | 20/26 (77%; p=100) | ↗20/26 | 14/26 (54%; p=81) | ↗18/26 | 1y91 (77%) |
| CS: 0.68 | ↘12/26 | CS: 0.58 | ↘6/26 | 1ykr (77%) | |
|
| |||||
| THRB | 18/24 (75%; p=91) | ↗20/24 | 14/24(58%; p=81) | ↗16/24 | 3da9 (83%) |
| CS: 0.69 | ↘7/24 | CS: 0.61 | ↘5/24 | 2zi2 (79%) | |
|
| |||||
| HS90A | 6/17 (35%; p=31) | ↗16/17 | 4/17 (24%; p=25) | ↗13/17 | 2fwz (94%) |
| CS: 0.37 | ↘3/17 | CS: 0.31 | ↘0/17 | 2cct (76%) | |
|
| |||||
| FA10 | 8/11 (73%; p=89) | ↗10/11 | 7/11 (64%; p=89) | ↗9/11 | 3kqw (91%) |
| CS: 0.68 | ↘4/11 | CS: 0.64 | ↘4/11 | ||
|
| |||||
| LKHA4 | 9/23 (39%; p=59) | ↗17/23 | 8/23 (35%; p=66) | ↗15/23 | - |
| CS: 0.37 | ↘4/23 | CS: 0.35 | ↘2/23 | ||
|
| |||||
| BACE1 | 9/18 (50%; p=39) | ↗14/18 | 8/18 (44%; p=28) | ↗13/18 | 3l5d (78%) |
| CS: 0.60 | ↘7/18 | CS: 0.57 | ↘6/18 | 3lnk (78%) | |
|
| |||||
| SRC | 10/15 (67%; p=65) | ↗15/15 | 6/15 (40%; p=35) | ↗15/15 | 1o47 (100%) |
| CS: 0.58 | ↘1/15 | CS: 0.45 | ↘0/15 | 1o48 (80%) | |
|
| |||||
| MK14 | 4/7 (57%; p=75) | ↗7/7 | 3/7 (43%; p=65) | ↗7/7 | 3d83 (100%) |
| CS: 0.58 | ↘1/7 | CS: 0.51 | ↘0/7 | ||
|
| |||||
| CHK1 | 3/5 (60%; p=61) | ↗4/5 | 2/5 (40%; p=72) | ↗3/5 | 2c3k (80%) |
| CS: 0.66 | ↘1/5 | CS: 0.56 | ↘0/5 | 2hog (80%) | |
The results are presented as a ratio between successfully-predicted 3DACs and the total number of 3DAC-pairs within a protein family. The MRC performance as compared to all individual pocket variants is expressed in percentile (p). The overall CS is also reported. The performance of best-(↗) and worst-performing (↘) pocket variants in each family are indicated. Conformations displaying accuracy over 75% are explicitly listed
Prediction of 3DACs by MRC docking with optimally selected pocket conformers
MRC docking provided interesting and yet suboptimal results. One possible reason could be traced back to the known phenomenon of MRC performance deteriorating due to conformational overload. In this case, the anti-cooperative behavior of a large ensemble of pockets increases the rate of false positives, limiting the possibility of accurately predicting 3DACs.53 In principle, this issue could be overcome by carefully selecting pocket structures.54 In our first attempt to select the combination of receptor conformers better suited to predicting 3DACs, we adapted the ALiBERO protocol. ALiBERO was originally designed to optimize the ability of an ensemble docking procedure to separate true binders from decoys in a VLS exercise. It introduces local variants of receptor conformations using a normal modes analysis and automatically selects the combination of pocket variants that returns the best performance. In our case, only the original X-ray structures were used (i.e. only one ALiBERO generation was studied) and no local variants were introduced. In these retrospective calculations, the less potent cliff-forming partners were labeled as non-binders and the more potent ones as binders. Results were assessed by the NSQ_AUC figure of merit (see Methods). Thanks to the ALiBERO paradigm, we were able to obtain the ALiBERO-Set, an optimal combination of receptor pockets purposely selected because of their cooperative power in correctly predicting 3DACs. Results for the individual receptors are summarized in Table 4 and graphically represented in Figure 2. The accuracy ranged between 71% (MK14) and 100% (CHK1 and BACE1), with a median performance of 88% (HS90A). Considering the 2.8 units cut-off, the overall success rate slightly decreased, but the 100% 3DACs-predicting ability in BACE1 and CHK1 was not affected. The median performance was found at 82% (FA10 and HS90A). CS spanned between 0.74 (CDK2) and 0.98 (BACE1) without a cut-off, and between 0.61 (MK14) and 0.98 (BACE1) when the cut-off was applied. This exercise selected the pocket variants that assign to the most potent cliff partner the best possible score and, at the same time, the worst possible one to weak cliff partners. Not surprisingly, the ALiBERO-Set docking returned the most accurate results of all the free docking protocols employed in this study. In particular, the best performance in correctly ranking 3DAC-forming ligands was usually obtained when two to three pocket conformers were combined, as indicated by their NSQ_AUC values approaching 1 (see Methods). Even the most populated family, CDK2, achieved the best performance when only five pockets were combined with ROC of 0.75 (Table 4).
Table 4.
ALiBERO-Set docking results.a
| Protein | ALiBERO-Set 3DAC separation | ||||
|---|---|---|---|---|---|
| no cut-off | 2.8 units cut-off | Best pockets combination PDB | ROC | NSQ_AUC | |
| CDK2 | 20/26 (77%) | 17/26 (65%) | 1y91 + 2uzo + 2r3i + 1h1q + 2c6i | 0.75 | 0.58 |
| CS: 0.74 | CS: 0.68 | (+ 3ig7/3igg) | 0.76 | 0.6 | |
|
| |||||
| THRB | 20/24 (83%) | 17/24 (71%) | 2jh0 + 2pks | 0.83 | 0.63 |
| CS: 0.80 | CS: 0.74 | ||||
|
| |||||
| HS90A | 15/17 (88%) | 14/17 (82%) | 2vcj | 0.91 | 0.82 |
| CS: 0.83 | CS: 0.80 | (+ 1uy6/2cct/2uwd/1uy7/1uy8) | |||
|
| |||||
| FA10 | 10/11 (91%) | 9/11 (82%) | 2fzz + 2p95 | 0.97 | 0.96 |
| CS: 0.87 | CS: 0.82 | ||||
|
| |||||
| LKHA4 | 18/23 (78%) | 16/23 (70%) | 3fh5 + 3fhe +3chr | 0.80 | 0.73 |
| CS: 0.78 | CS: 0.74 | (or 3fh5 + 3fhe) | 0.75 | 0.64 | |
|
| |||||
| BACE1 | 18/18 (100 %) | 18/18 (100%) | 2iqg + 2ph8 + 1w51 | 0.93 | 0.91 |
| CS: 0.98 | CS: 0.98 | (+ 3l5e) | 0.96 | 0.94 | |
|
| |||||
| SRC | 14/15 (93%) | 13/15 (87%) | 1o42 + 1o44 | 0.95 | 0.93 |
| CS: 0.89 | CS: 0.86 | ||||
|
| |||||
| MK14 | 5/7 (71%) | 4/7 (57%) | 1wbs + 3e93 + 3hll | 0.95 | 0.94 |
| CS: 0.69 | CS: 0.61 | ||||
|
| |||||
| CHK1 | 5/5 (100%) | 5/5 (100%) | 2hog + 2hxq | 0.88 | 0.85 |
| CS: 0.92 | CS: 0.92 | (or 2wmw + 2hxq) | |||
The results are presented as a ratio of successfully-predicted 3DACs and the total number of 3DAC-pairs within a protein family. The combination of pockets providing the best performance is listed explicitly, together with the respective ROC and NSQ_AUC values.
Although these results have to be regarded as the product of a purely retrospective exercise, they are nevertheless quite interesting as they clearly show, in line with what has already been reported for general purpose docking and screening protocols,40,53-55 that it is possible, by selecting an optimal combination of a few variants, to significantly improve the 3DACs-predicting performance not only with respect to SRC but also with respect to a comprehensive ensemble of conformations, the latter likely being unnecessarily large.
Prediction of 3DACs by MRC docking with pocket conformers selected by an independent VLS performance screen
The selection of an ideal team of pockets purposely assembled according to the ability of predicting 3DACs could be very difficult to obtain in a real life prospective drug discovery program. Conversely, as long as some activity data on several actual binders are available for a given target, it is usually possible to select an ensemble of crystallographic (or computationally generated) pocket variants that provides an optimal separation between binders and non-binders. Decoys can be collected from repositories of experimental results31,32 or computationally generated.56,57 The objective of this part of the study was to evaluate the ability of an ALiBERO-selected team of pocket variants optimized for VLS to predict activity cliffs. This experiment was only carried out on the four most populated target families, namely CDK2, THRB, HS90A, and FA10. We analyzed the results in terms of i) ligand-decoy separation and, using the scores obtained by true binders in the best possible pocket combination, we assessed ii) the 3DACs predictive power. All cliff-forming compounds were labeled as active. Decoys retrieved from DUD were labeled as inactive. As for the ALiBERO implementation reported in the previous section, the genetic algorithm was set to produce one generation, only employing crystallographic structures and without introducing computationally refined pocket variants. The results are reported in Table 5. Interestingly, the ensembles of pockets providing the best performance in separating ligands from decoys varied quite significantly with respect to the ALiBERO-Set (Table 4). In terms of results, they were almost identical for CDK2, and only marginally deteriorated for THRB and FA10. It was only for HS90A that the performance of the team of pockets optimized to separate binders from decoys was remarkably lower (CS considering cutoff, 0.29) than that of the pocket selection purposely assembled to identify cliffs (CS considering cutoff, 0.83). These results suggest that, on average, when optimizing a VLS protocol to enrich true binders, it is concurrently possible to correctly separate strong binders from weak binders even when their structures are extremely similar, thus devising a reliable tool for the prospective assessment of activity cliffs.
Table 5.
VLS performance and 3DAC prediction accuracy of ALiBERO-selected pocket conformer sets that better separate ligands from decoys.
| ALiBERO-selected pocket variants for ligands - decoys separation | ||||
|---|---|---|---|---|
|
| ||||
| Protein | CDK2 | THRB | HS90A | FA10 |
| #3DAC pairs | 26 | 24 | 11 | 11 |
| ligands | 36 | 28 | 17 | 12 |
| decoys | 2053 | 1490 | 970 | 594 |
|
| ||||
| Best pockets | 1h1s+1h01+2r3j | 3dhk+3egk+2anm | 3k97+2cct | 2p94+2vwm |
| combination | (+ 2xmy/2r3h/2vtm/1y8y) | (+ 1nt1+3f68) | 3k97+2vcj | (+2vwl) |
|
| ||||
| ROC | 0.85 (0.84) | 0.94 (0.95) | 0.72 (0.72) | 0.83 (0.83) |
| NSQ_AUC | 0.55 (0.55) | 0.73 (0.79) | 0.33 (0.34) | 0.51 (0.52) |
|
| ||||
| 3DAC separation from ALiBERO-selected pocket variants | ||||
|
| ||||
| no cut-off | 20/26 (77%) | 17/24 (71%) | 8/17 (47%) | 8/11 (73%) |
| CS = 0.74 | CS = 0.67 | CS = 0.43 | CS = 0.70 | |
|
| ||||
| 2.8 units cut-off | 18/26 (69%) | 15/24 (63%) | 4/17 (24%) | 6/11 (55%) |
3DAC prediction by restrained (template) docking
In the final part of this multi-layered study, we investigated two more scenarios starting from the assumption that the bound conformation of Lig-A had been reliably determined and could be used as a template to guide the generation of the bound pose of the weaker binder (Lig-B). The idea was that similar molecules would display very similar binding modes within the pocket. In other words (and in contrast to the previously described free docking protocols), in using template docking, we excluded the possibility that an activity cliff could be formed because two molecules, even if structurally very similar, bound at the same pocket in two radically different ways.
In the first case, the bound pose of Lig-A was taken directly from the crystallographic complex. Crystallographic water molecules within the ligand's binding site were preserved. Results are summarized in Table 6 and graphically reported in Figure 2. On average and as expected, the template docking protocol provided very satisfactory results. The accuracy ranged between 80% (CHK1) and 100% (FA10, LKHA4, BACE1, SRC, MK14). Considering the 2.8 units cut-off, the overall success rate slightly decreased, but three families (FA10, BACE1, MK14) still retained 100% accuracy in 3DACs prediction. The median accuracy was 90% (SRC and HS90A). CS spanned between 0.78 (CHK1) and 0.99 (BACE1, LKHA4, MK14) without cut-off, and between 0.69 (CHK1) and 0.99 (BACE1, MK14) when the 2.8 kcal/mol cut-off was applied.
Table 6.
Template docking results.
| Protein | Template docking: X-ray | Template docking: ALiBERO-Set | ||
|---|---|---|---|---|
| Lig-A: X-ray | Lig-A: ALiBERO-Set docking | |||
| no cut-off | cut-off 2.8 | no cut-off | cut-off 2.8 | |
| CDK2 | 24/26 (92%) | 23/26 (88%) | 25/26 (96%) | 21/26 (81%) |
| CS: 0.90 | CS: 0.88 | CS: 0.91 | CS: 0.84 | |
|
| ||||
| THRB | 23/24 (96%) | 20/24 (83%) | 20/24 (83%) | 18/24 (75%) |
| CS: 0.94 | CS: 0.88 | CS: 0.80 | CS: 0.76 | |
|
| ||||
| HS90A | 16/17 (94%) | 15/17 (88%) | 17/17 (100%) | 16/17 (94%) |
| CS: 0.93 | CS: 0.90 | CS: 0.94 | CS: 0.91 | |
|
| ||||
| FA10 | 11/11 (100%) | 11/11 (100%) | 9/11 (82%) | 7/11 (64%) |
| CS: 0.97 | CS: 0.97 | CS: 0.77 | CS: 0.67 | |
|
| ||||
| LKHA4 | 23/23 (100%) | 22/23 (96%) | 20/23 (87%) | 19/23 (83%) |
| CS: 0.99 | CS: 0.97 | CS: 0.86 | CS: 0.84 | |
|
| ||||
| BACE1 | 18/18 (100%) | 18/18 (100%) | 14/18 (78%) | 13/18 (72%) |
| CS: 0.99 | CS: 0.99 | CS: 0.77 | CS: 0.75 | |
|
| ||||
| SRC | 15/15 (100%) | 14/15 (93%) | 15/15 (100%) | 15/15 (100%) |
| CS: 0.98 | CS: 0.95 | CS: 0.99 | CS: 0.99 | |
|
| ||||
| MK14 | 7/7 (100%) | 7/7 (100%) | 6/7 (86%) | 6/7 (86%) |
| CS: 0.99 | CS: 0.99 | CS: 0.87 | CS: 0.87 | |
|
| ||||
| CHK1 | 4/5 (80%) | 3/5 (60%) | 5/5 (100%) | 4/5 (80%) |
| CS: 0.78 | CS: 0.69 | CS: 0.87 | CS: 0.77 | |
Analyzing the variation of the binding score components upon template docking can provide interesting insights into what drives the activity cliff formation. Table S2 of the Supporting Information reports details on the individual contributions to the binding score values for each ligand studied in the template docking exercise. In most cases (96%), when using the bound pose of the stronger cliff partner to constrain the sampling of the weaker one, the potency drop (score becoming less negative) varied between 2.0 score units (3DAC in HS90A, formed by ligand h64 in PDB id: 2FWY upon its transformation into pu7) and 41.9 score units (3DAC in BACE1, formed by ligand vg5 in PDB id: 2VJ6, upon its transformation into vg3). The key element that we could observe was that these drops were mainly explained by loss of hydrogen bond interactions, either those formed between the ligand and the receptor, or those that involved bridging waters. Figure 3 reports an example of how analyzing interaction patterns can explain potency loss.
Figure 3.
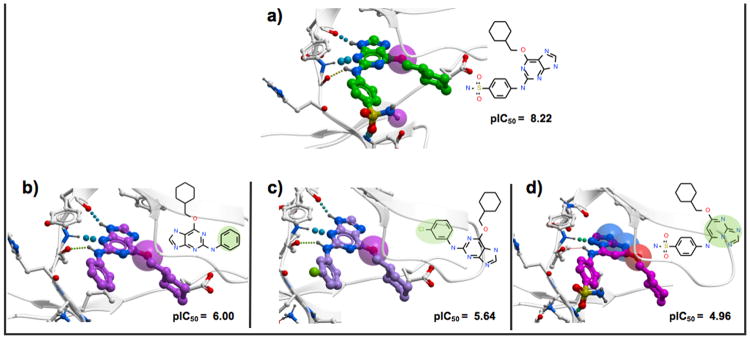
Insight into the binding pattern of the CDK2 3DACs-forming ligand 4sp, 2a6, 6cp, and dt1. The stronger ligand 4sp (green) co-crystallized in 1H1S (a) forms four hydrogen bonds with the receptor. The loss of potency upon its modification into 2a6 (purple) (b), 6cp (lila) (c), and dt1 (magenta) (d) is due to steric reasons and hydrogen bond loss. The transparent spheres represent unsatisfied hydrogen bonds of the ligands.
In the CDK2 family, ligand 4sp (PDB id: 1H1S, Figure 3a) forms a MMP with ligands 2a6 (Figure 3b) and 6cp (Figure 3c), while ligand dt1 is related to 4sp because of an isoster replacement (Figure 3d) with structural modifications at the core common scaffold. The more potent ligand 4sp forms four hydrogen bonds with the receptor, three of which involve the nitrogen atoms of the central scaffold, and are preserved in the other two less potent MMP-forming ligands, 2a6 and 6cp. The fourth hydrogen bond of 4sp involves the sulfonamide group of the ligand. This last bond is lost upon structural modification of 4sp into the weaker partners 2a6 and 6cp, resulting in a drop of binding score by 8.6 and 10.4 score units, respectively. In dt1, the hydrogen bond formed between the sulfonamide and the receptor is preserved but, due to the modification introduced in the ligand core, another hydrogen bond is lost and the binding score drops by 10.4 units.
In Figure 4, another example from the HS90A family is reported. Here, a network of bridging waters was involved in shaping the interaction pattern. Although in this second example the structural change of Lig-A, cxz (PDB id: 3BMY, Figure 4a) into Lig-B, 2ei (Figure 4b), encompassed more pronounced structural modifications, the common interaction pattern remained comparable, and the loss of binding energy (9.1 score units) upon structural modification could be predicted correctly modeling one hydrogen bond loss, a different steric fit, and increased ligand strain.
Figure 4.
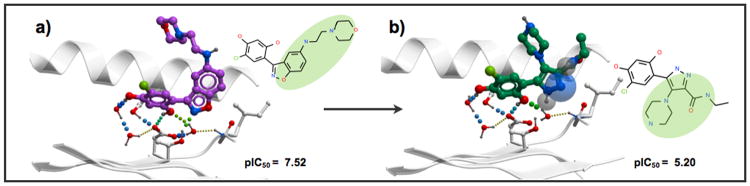
Insight into the binding pattern of the HS90A 3DACs-forming ligand cxz upon structural modification (template docking) into ligand 2ei. The stronger ligand cxz (purple) co-crystallized in 3BMY (a) forms two hydrogen bonds with the receptor, and two with bridging water molecules. The loss of potency upon its conversion to 2ei (green) (b) is due to one hydrogen bond loss, steric reasons, and increased ligand strain. The transparent spheres represent unsatisfied hydrogen bonds of the ligand.
Further examples describing the prediction of interaction patterns from 3DAC in THRB and FA10 families are reported in the Supporting Information (Figure S3 and S4, respectively).
In the second set of template docking calculations, the template pose was produced by docking Lig-A at the ALiBERO-Set of pocket variants and used to guide the generation of the bound conformation of Lig-B. This can be considered an attempt to combine the best results obtained by means of a free docking protocol, i.e. ALiBERO-Set docking, with the template docking paradigm (see Table 2). The success rate ranged between 78% (BACE1) and 100% (CHK1, SRC and HS90A). Considering the 2.8-unit cut-off, the overall performance ranged between 64% (FA10) and 100% (SRC), with a median accuracy of 83% (LKHA4). In terms of CS, the median accuracy was 0.87 (MK14 and CHK1) spanning from 0.77 (FA10) and 0.99 (SRC) without cut-off. When the 2.8 kcal/mol cut-off was applied, CS ranged between 0.67 (FA10) and 0.99 (SRC), with a median value of 0.84 (LKHA4 and CDK2). While on average marginally less accurate than the predictions obtained using a crystal structure as template, this set of results clearly suggests how template docking can still provide accurate results in the absence of a crystal structure, as long as a reliable pose for the template is generated by computational means.
Last, we briefly characterized the role played by pocket plasticity in template docking. In all restrained docking attempts carried out so far, we have always modeled the weaker cliff partner using the more potent one as template. In principle, since we assume that small structural variations do not change the overall bound pose of the scaffold, the difference between going from the more potent ligand to the less potent one or the other way around should be marginal. However, we reasoned that, also in this case, the flexibility of the binding pocket could be expected to affect the success rate of the predictions. In fact, less potent cliff partners tend to be smaller than their stronger counterparts and, as such, are lodged in smaller and less permissive pockets. We tested this hypothesis studying the CDK2 family. In the first set of calculations, the bound pose of the more potent Lig-A was obtained using the pose of Lig-B within Rec-B cognate pocket. Accuracy dropped to only 60% (40% when the 2.8 unit cut-off was applied), with CS values of 0.51 and 0.41 (2.8 units cut-off applied), respectively. This is not surprising as Lig-A's volume was significantly larger in over 90% of the cases. As expected from our previous studies on the role of pocket size in cross docking attempts,54,58 higher success rates could be restored when the bound pose of Lig-A was obtained first free docking Lig-B into Rec-A pocket variant (cross-docking) and then using this pose to guide the docking of Lig-B's more potent counterpart. A successful prediction occurred in 24 out of 26 cases (92%) when no cut-off was applied and in 21 out of 26 cases (81%) when the cut-off value of 2.80 units was considered. CS was 0.85 and 0.81, respectively. The insights on the importance of receptor flexibility previously gained studying free docking approaches can be applied to conceive a protocol that combines template docking and MRC-based strategies. For a detailed overview of the results please refer to Table S4 in the SI.
Discussion on cliff prediction via structure-based methods
Taken together, our results suggest that docking protocols can be successfully applied to the prediction of activity cliffs with just some protein-family-dependent variations in the accuracy of the results. This is to be expected as activity cliff formation is dependent on the target5 and the general accuracy of docking-based modeling methods is affected by the specific nature of the binding pocket. CDK2 family can be considered a good example of the average trend that can be expected from this kind of calculations. In the first set of calculation solely based on binding score estimation, the accuracy of prediction for this family was 73% and decreased to 62% when the 2.8 units cut-off was considered (Figure 2). The accuracy rate did not significantly deteriorate in the self-docking exercise, confirming that, in a perfectly adapted structure, issues of docking-based predictions are usually related to the scoring function (soft failures) rather than to an incorrect sampling of the ligand (hard failures) (Figure 2). The success rate decreased in the SRC cross-docking experiment, due to variations that were introduced in the binding pocket. This happened even when, as with CDK2, the conformational fit effect was very limited, mainly involving one or two side chain rotamers (Figure 2). The ability to correctly predict activity cliffs could be restored by an unbiased MRC protocol. Notably, the MRC results outperformed the predictions provided by every individual conformer. The same predictive ability associated with a 26-pocket-variant ensemble could be retrospectively matched by identifying the minimal combination of pockets (5 conformers) most suited to predicting cliffs. A performance in line with the ideal cases could also be obtained by identifying a combination of crystallographic structures that optimally enriched known CDK2 binders over decoys. This last result is particularly interesting because, since the number of targets characterized in terms of structures is constantly increasing, together with the number of reported known binders,59 this protocol can genuinely be translated to prospective drug discovery programs. Coagulation factor X provided another interesting case study. Idealized protocols such as binding score calculations and self-docking did not provide very accurate predictions. This is likely due to the peculiar nature of the FA10 binding pocket, which encompasses several sub-pockets and solvent-exposed regions and severely challenges the reliability of the scoring function. Moreover, this target has already been reported to display significant conformational fit effects.58,60 When receptor conformational variability was introduced, the quality of 3DACs predictions improved significantly. In particular, a limited number of conformers systematically achieved better performances than the other pocket variants. Interestingly, both ALiBERO-selection based protocols identified teams of only two pockets. In both CDK2 and FA10 cases, when 3DACs were predicted by means of template docking, very accurate results could be generated (Figure 2).
While the ability to separate binders from non-binders in general-purpose screening experiments can usually be considered a good indicator of likely accurate 3DACs predictions, there are exceptions to consider, as became evident when analyzing the results for the HS90A family. The binding pocket of this chaperone is characterized by the presence of a loop (residues 100 to 115), which can adopt three different conformations, namely closed, open, and helix.61 All variants were represented in our conformational set. When all conformations were indiscriminately used in the MRC docking approach, the 3DACs predictive power of the best performing structures was overwhelmed by the noise generated by the others. This explains the less than ideal performance of MRC docking, far below the results characterizing individual pockets that adopt the helix (2FWZ) or closed (2CCT) rearrangements. In this case, the ALiBERO-Set did not encompass a team of pockets, but only a single conformer in which the loop is in a close conformation (2VCJ). In the retrospective VLS exercise carried out on a set of ALiBERO-selected receptor conformations that better separates ligands from decoys, the ensemble returning the best ROC value (0.72, Table 5) encompassed an open and a closed loop conformation. This selection of pockets was particularly apt at capturing the structural diversity of all binders and enriching them with respect to non-binders. However, in this case, it only provided a modestly accurate 3DACs prediction, since only the narrower pocket variants could reproduce the specific network of interaction that characterizes tight binders, assigning them scores significantly higher than their corresponding partners. In HS90A, the conformations displaying an open loop rearrangement, and so a wider, more permissive pocket, provided worse predictive power in terms of activity cliffs but better results in terms of general separation between binders and non-binders. This is consistent with the observation that, when a template was used to guide sampling, the issue posed by false positives generated by a larger, more permissive pocket became less relevant and the accuracy of the predictions increased accordingly.
Sampling and, even more, scoring functions suffer from well-known limitations,62,63 and yet several of the proposed protocols could achieve a significant level of accuracy. Even when a difference of 2.8 score units, approximately corresponding to the two orders of magnitude change in activity that was used to define a cliff, was introduced as cut-off value for an accurate prediction, the reported results only slightly deteriorated. Several elements explain this overall acceptable performance. First, our analysis assigned a pivotal role in forming activity cliffs to the loss of H-bond interactions. While several components that contribute to the thermodynamics of protein-ligand binding (for example de-solvation and entropy loss upon binding) remain more difficult to capture, H-bond interactions, being local, directional, and enthalpic in nature, can be efficiently described by scoring schemes.64 In CDK2, a family which consistently provided accurate results, a higher number of hydrogen bonds between the more potent cliff-forming partner and the receptor (with respect to the same kind of interactions formed by the weaker ligand) could be observed in 14 out of 26 instances. In the FA10 family, the more active compound formed more hydrogen bonds in only 3 out of 11 3DACs; in all the other FA10 cliff pairs, both partners displayed an equal number of hydrogen bonds. In this case, hydrogen bonds alone were not sufficient to explain and predict cliff formation. Other factors, such as steric clashes and the structural role of solvent within the binding site, had to be taken into account and correctly addressed to endow a computational tool of predictive power. In this family, accuracy improved only when receptor flexibility was taken into account.
Second, despite some encouraging results,65 scoring functions have been proven inadequate to distinguish the potency of members of congeneric series.22,66 However, scoring functions are optimized to separate true binders from non-binders,67 and this feature can be exploited in 3DAC prediction. In the task at hand, since partners are by definition separated by at least two orders of magnitude in terms of potency, the more potent partner likely behaves like a true binder, while the weaker molecule more closely resembles a random non-binder. This can be verified by examining 3DAC binding scores from a statistical perspective. To this end, we generated Gaussian score distributions docking a set of 1960 random non-binders (drug-like molecules randomly selected from ZINC) at multiple receptor structures (see Methods). Then, each individual score was normalized and expressed in terms of Z score. In turn, from Z scores, p values could be calculated. In this framework, a true binder should be assigned a score that is significantly separated from random noise.68 This analysis was carried out on the results generated by MRC VLS on four preselected targets, namely CDK2, THRB, HS90A, and FA10. MRC VLS is particularly apt for this exercise, as random distortions that could be introduced in score predictions by a single receptor conformer tend to average out in a conformational ensemble. Instead of just comparing binding scores, accuracy of 3DAC predictions could now be assessed by means of a two-fold, more stringent success criterion: i) the more potent compound is assigned a more negative binding score and ii) this score is significantly separated from random noise (p-value < 0.05). Results are summarized in Table S3 of the Supporting Information. Only in HS90A did the reliability of 3DAC predictions drop substantially, confirming the challenges posed by this family in all reported docking protocols, and making it difficult, in this case, to disentangle posing and scoring inaccuracies. In CDK2, THRB, and FA10, introducing statistical significance as a second condition for accuracy did not affect the quality of the results.
Third, it is worth analyzing our retrospective results in terms of protein-ligand interaction patterns established by 3DAC-forming ligands at the same binding pocket. For this, we used a procedure developed in house (see Methods for details). Accuracy was expressed in terms of recall of the conserved ligand-receptor contacts established by the strongest (Lig-A in at Rec-A) and the weakest (Lig-B in at Rec-A) cliff partners. The contact similarity was assessed in the four following scenarios: i) pose of Lig-A from X-ray co-crystal, pose of Lig-B freely docked; ii) both poses obtained by unconstrained docking; iii) pose of Lig-A from X-ray co-crystal, Lig-B pose obtained by template docking; iv) pose of Lig-A generated by the docking at the ALiBERO-Set, pose of Lig-B obtained by template docking. The results are summarized in Table 7. In most cases, our simulations were able to recover over 50% of the shared contacts. As expected, when Lig-B pose was generated by means of template docking, the success rate increased with respect to free docking. No significant difference could be observed between simulations in which the conformation of Lig-A was retrieved directly from a crystal structure and simulations using the pose obtained by docking at the ALiBERO-Set. Even when unconstrained docking was used, the accuracy of the results remained fairly high (see Table 7). This analysis helped us to establish that, on average, docking protocols are able to recover most of the contacts shared by the cliff partners. If the shared contacts are correctly recognized, the difference between assigned docking scores depends on the ability of simulations to specifically reproduce the tighter interactions displayed by the more potent cliff-forming compound which are absent in the weaker one. This is another feature that helps explain the acceptable predictive power displayed by most of the outlined protocols.
Table 7.
Conservation of the pattern of interactions formed by cliff partners at the same binding pocket.
| Protein | Contact similarity (complexA, complexB) ≥ 50% | |||
|---|---|---|---|---|
| Template docking | Free Docking | |||
| Lig-A: X-ray | Lig-A: ALiBERO-Set | Lig-B only | Lig-A and Lig-B | |
| CDK2 | 22/26 (85%) | 23/26 (88%) | 20/26 (77%) | 20/26 (77%) |
|
| ||||
| THRB | 22/24 (92%) | 15/24 (63%) | 19/24 (79%) | 21/24 (88%) |
|
| ||||
| HS90A | 17/17 (100%) | 17/17 (100%) | 6/17 (35%) | 7/17 (42%) |
|
| ||||
| FA10 | 7/11 (64%) | 10/11 (91%) | 4/11 (36%) | 6/11 (55%) |
|
| ||||
| LKHA4 | 13/26 (56%) | 13/26 (56%) | 9/23 (39%) | 7/23 (30%) |
|
| ||||
| BACE1 | 17/18 (94%) | 18/18 (100%) | 15/18 (83%) | 15/18 (83%) |
|
| ||||
| SRC | 15/15 (100%) | 15/15 (100%) | 7/15 (47%) | 7/15 (47%) |
|
| ||||
| MK14 | 6/7 (86%) | 5/7 (71%) | 2/7 (29%) | 4/7 (57%) |
|
| ||||
| CHK1 | 4/5 (80%) | 4/5 (80%) | 5/5 (100%) | 5/5 (100%) |
Finally, it is worth mentioning that, while the results generated here were obtained by means of protocols largely based on ICM, it is reasonable to believe that similar results can be reproduced employing different docking schemes, provided that certain features are available: i) an efficient sampling algorithm, ii) a scoring function encompassing terms for ligand entropy loss upon binding and desolvation, iii) the ability to take into account receptor flexibility and induce fit effects, and iv) template docking schemes that exploit a known bound pose of a ligand to guide the posing of a similar one.
Conclusions
In this study, we applied structure-based approaches to predict activity cliffs. We used a publicly available, independently assembled benchmark to test the accuracy of advanced docking and screening protocols in predicting 3DAC. We gradually moved from an ideal situation to scenarios that resemble real-life drug discovery efforts, using more complex protocols that can exploit readily available structural information, like multiple crystallographic conformations of the receptor, activity data from already known binders, and even the experimentally-known bound conformation of a congeneric molecule. Thanks to the reported results, we could show that, if the bound pose of a cliff-forming partner is available from experiments or from a reliable in silico protocol, this can be efficiently used in predicting 3DACs. In template docking, taking into account the presence of water molecules in the binding site could substantially contribute to the accuracy of the predictions. Thus, efforts will have to be made to incorporate the role of water molecules in truly prospective protocols.69 Even when a starting bound pose was not available, implementing receptor flexibility by means of MRC docking allowed us to almost match the ideal accuracy threshold set by purely retrospective binding score calculations and self-docking runs. Furthermore, in several instances, accuracy could even be improved by selecting, thanks to the ALiBERO paradigm, only the minimal structural ensemble out of a usually unnecessarily large number of conformational variants. We suggest that advanced structure-based methods could be a valuable tool for predicting activity cliffs as long as they are able to efficiently describe ligand-receptor interaction patterns, with particular reference to hydrogen bonds. What makes structure-based methods particularly interesting and differentiate their contribution from the one provided by ligand-based methods is not the mere presence of the receptor but actually the possibility to describe the receptor's plasticity. The next step in refining our predictive tools could involve devising protocols that combine the best predictive features from both structure- and ligand-based methods, such as the recently reported Atomic Property Field screening protocol.68,70
Supplementary Material
Acknowledgments
We thank Dr. Sergio Decherchi for comments and discussions regarding the statistical aspect of the results presented in this work. We thank Dr. Manuel Rueda for his suggestions concerning MRC docking and ALiBERO. We thank Grace Fox for editing and proofreading the manuscript. The work was partially supported by NIH Grants R01 GM071872, U01 GM094612, and U54 GM094618 to R.A.
Footnotes
Supporting Information. A description of the activity ridges formed in the most populated protein families, a detailed description of the ‘Binding score – SRC docking’ results, details on interaction patterns examples from THRB and FA10 families, and a detailed report of score components for template docking are available in the Supporting Information. This material is available free of charge via the Internet at http://pubs.acs.org.
Author Contributions: The manuscript was written with the contribution of all authors. All authors have given approval to the final version of the manuscript.
Notes: The authors declare no competing financial interest.
References
- 1.Maggiora GM. On outliers and activity cliffs-why QSAR often disappoints. J Chem Inf Model. 2006;46(4):1535. doi: 10.1021/ci060117s. [DOI] [PubMed] [Google Scholar]
- 2.Stumpfe D, Bajorath J. Exploring activity cliffs in medicinal chemistry. J Med Chem. 2012;55(7):2932–2942. doi: 10.1021/jm201706b. [DOI] [PubMed] [Google Scholar]
- 3.Stumpfe D, Hu Y, Dimova D, Bajorath J. Recent progress in understanding activity cliffs and their utility in medicinal chemistry. J Med Chem. 2014;57(1):18–28. doi: 10.1021/jm401120g. [DOI] [PubMed] [Google Scholar]
- 4.Cruz-Monteagudo M, Medina-Franco JL, Perez-Castillo Y, Nicolotti O, Cordeiro MN, Borges F. Activity cliffs in drug discovery: Dr Jekyll or Mr Hyde? Drug Discov Today. 2014 doi: 10.1016/j.drudis.2014.02.003. [DOI] [PubMed] [Google Scholar]
- 5.Guha R, Medina-Franco JL. On the validity versus utility of activity landscapes: are all activity cliffs statistically significant? J Cheminform. 2014;6:11. doi: 10.1186/1758-2946-6-11. [DOI] [PMC free article] [PubMed] [Google Scholar]
- 6.Medina-Franco JL. Activity cliffs: facts or artifacts? Chem Biol Drug Des. 2013;81(5):553–556. doi: 10.1111/cbdd.12115. [DOI] [PubMed] [Google Scholar]
- 7.Dossetter AG, Griffen EJ, Leach AG. Matched molecular pair analysis in drug discovery. Drug Discov Today. 2013;18(15-16):724–731. doi: 10.1016/j.drudis.2013.03.003. [DOI] [PubMed] [Google Scholar]
- 8.Griffen E, Leach AG, Robb GR, Warner DJ. Matched molecular pairs as a medicinal chemistry tool. J Med Chem. 2011;54(22):7739–7750. doi: 10.1021/jm200452d. [DOI] [PubMed] [Google Scholar]
- 9.Hu X, Hu Y, Vogt M, Stumpfe D, Bajorath J. MMP-Cliffs: systematic identification of activity cliffs on the basis of matched molecular pairs. J Chem Inf Model. 2012;52(5):1138–1145. doi: 10.1021/ci3001138. [DOI] [PubMed] [Google Scholar]
- 10.Kubinyi H. Similarity and Dissimilarity: A Medicinal Chemist's View. Perspect Drug Discov Des. 1998;9-11:225–252. [Google Scholar]
- 11.Bajorath J. Modeling of activity landscapes for drug discovery. Expert Opin Drug Discov. 2012;7(6):463–473. doi: 10.1517/17460441.2012.679616. [DOI] [PubMed] [Google Scholar]
- 12.Wassermann AM, Bajorath J. Chemical substitutions that introduce activity cliffs across different compound classes and biological targets. J Chem Inf Model. 2010;50(7):1248–1256. doi: 10.1021/ci1001845. [DOI] [PubMed] [Google Scholar]
- 13.Peltason L, Bajorath J. SAR index: quantifying the nature of structure-activity relationships. J Med Chem. 2007;50(23):5571–5578. doi: 10.1021/jm0705713. [DOI] [PubMed] [Google Scholar]
- 14.Guha R, Van Drie JH. Structure-activity landscape index: identifying and quantifying activity cliffs. J Chem Inf Model. 2008;48(3):646–658. doi: 10.1021/ci7004093. [DOI] [PubMed] [Google Scholar]
- 15.Guha R. The ups and downs of structure-activity landscapes. Methods Mol Biol. 2011;672:101–117. doi: 10.1007/978-1-60761-839-3_3. [DOI] [PMC free article] [PubMed] [Google Scholar]
- 16.Vogt M, Huang Y, Bajorath J. From activity cliffs to activity ridges: informative data structures for SAR analysis. J Chem Inf Model. 2011;51(8):1848–1856. doi: 10.1021/ci2002473. [DOI] [PubMed] [Google Scholar]
- 17.Hu Y, Bajorath J. Exploration of 3D activity cliffs on the basis of compound binding modes and comparison of 2D and 3D cliffs. J Chem Inf Model. 2012;52(3):670–677. doi: 10.1021/ci300033e. [DOI] [PubMed] [Google Scholar]
- 18.Seebeck B, Wagener M, Rarey M. From activity cliffs to target-specific scoring models and pharmacophore hypotheses. ChemMedChem. 2011;6(9):1630–1639. 1533. doi: 10.1002/cmdc.201100179. [DOI] [PubMed] [Google Scholar]
- 19.Hu Y, Furtmann N, Gutschow M, Bajorath J. Systematic identification and classification of three-dimensional activity cliffs. J Chem Inf Model. 2012;52(6):1490–1498. doi: 10.1021/ci300158v. [DOI] [PubMed] [Google Scholar]
- 20.Hu Y, Stumpfe D, Bajorath J. Advancing the activity cliff concept. F1000Res. 2013;2:199. doi: 10.12688/f1000research.2-199.v1. [DOI] [PMC free article] [PubMed] [Google Scholar]
- 21.Reddy MR, Reddy CR, Rathore RS, Erion MD, Aparoy P, Reddy RN, Reddanna P. Free energy calculations to estimate ligand-binding affinities in structure-based drug design. Curr Pharm Des. 2014;20(20):3323–3337. doi: 10.2174/13816128113199990604. [DOI] [PubMed] [Google Scholar]
- 22.Gkeka P, Eleftheratos S, Kolocouris A, Cournia Z. Free Energy Calculations Reveal the Origin of Binding Preference for Aminoadamantane Blockers of Influenza A/M2TM Pore. J Chem Theory Comput. 2013;9(2):1272–1281. doi: 10.1021/ct300899n. [DOI] [PubMed] [Google Scholar]
- 23.Christ CD, Fox T. Accuracy assessment and automation of free energy calculations for drug design. J Chem Inf Model. 2014;54(1):108–120. doi: 10.1021/ci4004199. [DOI] [PubMed] [Google Scholar]
- 24.Wang L, Wu Y, Deng Y, Kim B, Pierce L, Krilov G, Lupyan D, Robinson S, Dahlgren MK, Greenwood J, Romero DL, Masse C, Knight JL, Steinbrecher T, Beuming T, Damm W, Harder E, Sherman W, Brewer M, Wester R, Murcko M, Frye L, Farid R, Lin T, Mobley DL, Jorgensen WL, Berne BJ, Friesner RA, Abel R. Accurate and reliable prediction of relative ligand binding potency in prospective drug discovery by way of a modern free-energy calculation protocol and force field. J Am Chem Soc. 2015;137(7):2695–2703. doi: 10.1021/ja512751q. [DOI] [PubMed] [Google Scholar]
- 25.Greenidge PA, Kramer C, Mozziconacci JC, Sherman W. Improving docking results via reranking of ensembles of ligand poses in multiple X-ray protein conformations with MM-GBSA. J Chem Inf Model. 2014;54(10):2697–2717. doi: 10.1021/ci5003735. [DOI] [PubMed] [Google Scholar]
- 26.Wichapong K, Rohe A, Platzer C, Slynko I, Erdmann F, Schmidt M, Sippl W. Application of docking and QM/MM-GBSA rescoring to screen for novel Myt1 kinase inhibitors. J Chem Inf Model. 2014;54(3):881–893. doi: 10.1021/ci4007326. [DOI] [PubMed] [Google Scholar]
- 27.Sgobba M, Caporuscio F, Anighoro A, Portioli C, Rastelli G. Application of a post-docking procedure based on MM-PBSA and MM-GBSA on single and multiple protein conformations. Eur J Med Chem. 2012;58:431–440. doi: 10.1016/j.ejmech.2012.10.024. [DOI] [PubMed] [Google Scholar]
- 28.Medina-Franco JL, Mendez-Lucio O, Yoo J. Rationalization of activity cliffs of a sulfonamide inhibitor of DNA methyltransferases with induced-fit docking. Int J Mol Sci. 2014;15(2):3253–3261. doi: 10.3390/ijms15023253. [DOI] [PMC free article] [PubMed] [Google Scholar]
- 29.Abel R, Salam NK, Shelley J, Farid R, Friesner RA, Sherman W. Contribution of explicit solvent effects to the binding affinity of small-molecule inhibitors in blood coagulation factor serine proteases. ChemMedChem. 2011;6(6):1049–1066. doi: 10.1002/cmdc.201000533. [DOI] [PubMed] [Google Scholar]
- 30.Méndez-Lucio O, Pérez-Villanueva J, Castillo R, Medina-Franco JL. Identifying Activity Cliff Generators of PPAR Ligands Using SAS Maps. Mol Inf. 2012;31(11-12):837–846. doi: 10.1002/minf.201200078. [DOI] [PubMed] [Google Scholar]
- 31.Gaulton A, Bellis LJ, Bento AP, Chambers J, Davies M, Hersey A, Light Y, McGlinchey S, Michalovich D, Al-Lazikani B, Overington JP. ChEMBL: a large-scale bioactivity database for drug discovery. Nucleic Acids Res. 2012;40:D1100–1107. doi: 10.1093/nar/gkr777. Database issue. [DOI] [PMC free article] [PubMed] [Google Scholar]
- 32.Liu T, Lin Y, Wen X, Jorissen RN, Gilson MK. BindingDB: a web-accessible database of experimentally determined protein-ligand binding affinities. Nucleic Acids Res. 2007;35:D198–201. doi: 10.1093/nar/gkl999. Database issue. [DOI] [PMC free article] [PubMed] [Google Scholar]
- 33.Willett P. Searching techniques for databases of two- and three-dimensional chemical structures. J Med Chem. 2005;48(13):4183–4199. doi: 10.1021/jm0582165. [DOI] [PubMed] [Google Scholar]
- 34.Peltason L, Bajorath J. Molecular similarity analysis uncovers heterogeneous structure-activity relationships and variable activity landscapes. Chem Biol. 2007;14(5):489–497. doi: 10.1016/j.chembiol.2007.03.011. [DOI] [PubMed] [Google Scholar]
- 35.Abagyan R, Raush E, Totrov M. ICM Manual v.3.7. Molsoft LLC; San Diego, CA: 2013. [Google Scholar]
- 36.Arnautova YA, Abagyan RA, Totrov M. Development of a new physics-based internal coordinate mechanics force field and its application to protein loop modeling. Proteins. 2011;79(2):477–498. doi: 10.1002/prot.22896. [DOI] [PMC free article] [PubMed] [Google Scholar]
- 37.Halgren TA. Merck molecular force field. I. Basis, form, scope, parameterization, and performance of MMFF94. J Comput Chem. 1996;17(5-6):490–519. [Google Scholar]
- 38.Neves MA, Totrov M, Abagyan R. Docking and scoring with ICM: the benchmarking results and strategies for improvement. J Comput Aided Mol Des. 2012;26(6):675–686. doi: 10.1007/s10822-012-9547-0. [DOI] [PMC free article] [PubMed] [Google Scholar]
- 39.Abagyan R, Totrov M, Kuznetsov D. ICM—A new method for protein modeling and design: Applications to docking and structure prediction from the distorted native conformation. J Comput Chem. 1994;15(5):488–506. [Google Scholar]
- 40.Bottegoni G, Kufareva I, Totrov M, Abagyan R. Four-dimensional docking: a fast and accurate account of discrete receptor flexibility in ligand docking. J Med Chem. 2009;52(2):397–406. doi: 10.1021/jm8009958. [DOI] [PMC free article] [PubMed] [Google Scholar]
- 41.Rueda M, Totrov M, Abagyan R. ALiBERO: evolving a team of complementary pocket conformations rather than a single leader. J Chem Inf Model. 2012;52(10):2705–2714. doi: 10.1021/ci3001088. [DOI] [PMC free article] [PubMed] [Google Scholar]
- 42.Huang N, Shoichet BK, Irwin JJ. Benchmarking sets for molecular docking. J Med Chem. 2006;49(23):6789–6801. doi: 10.1021/jm0608356. [DOI] [PMC free article] [PubMed] [Google Scholar]
- 43.Kufareva I, Abagyan R. Methods of protein structure comparison. Methods Mol Biol. 2012;857:231–257. doi: 10.1007/978-1-61779-588-6_10. [DOI] [PMC free article] [PubMed] [Google Scholar]
- 44.Kufareva I, Rueda M, Katritch V, Stevens RC, Abagyan R. Status of GPCR modeling and docking as reflected by community-wide GPCR Dock 2010 assessment. Structure. 2011;19(8):1108–1126. doi: 10.1016/j.str.2011.05.012. [DOI] [PMC free article] [PubMed] [Google Scholar]
- 45.Irwin JJ, Sterling T, Mysinger MM, Bolstad ES, Coleman RG. ZINC: a free tool to discover chemistry for biology. J Chem Inf Model. 2012;52(7):1757–1768. doi: 10.1021/ci3001277. [DOI] [PMC free article] [PubMed] [Google Scholar]
- 46.Teramoto R, Fukunishi H. Supervised consensus scoring for docking and virtual screening. J Chem Inf Model. 2007;47(2):526–534. doi: 10.1021/ci6004993. [DOI] [PubMed] [Google Scholar]
- 47.Katritch V, Jaakola VP, Lane JR, Lin J, Ijzerman AP, Yeager M, Kufareva I, Stevens RC, Abagyan R. Structure-based discovery of novel chemotypes for adenosine A(2A) receptor antagonists. J Med Chem. 2010;53(4):1799–1809. doi: 10.1021/jm901647p. [DOI] [PMC free article] [PubMed] [Google Scholar]
- 48.Jain AN, Nicholls A. Recommendations for evaluation of computational methods. J Comput Aided Mol Des. 2008;22(3-4):133–139. doi: 10.1007/s10822-008-9196-5. [DOI] [PMC free article] [PubMed] [Google Scholar]
- 49.Gupta-Ostermann D, Bajorath J. Identification of multitarget activity ridges in high-dimensional bioactivity spaces. J Chem Inf Model. 2012;52(10):2579–2586. doi: 10.1021/ci3003683. [DOI] [PubMed] [Google Scholar]
- 50.Totrov M, Abagyan R. Flexible ligand docking to multiple receptor conformations: a practical alternative. Curr Opin Struct Biol. 2008;18(2):178–184. doi: 10.1016/j.sbi.2008.01.004. [DOI] [PMC free article] [PubMed] [Google Scholar]
- 51.Hartshorn MJ, Verdonk ML, Chessari G, Brewerton SC, Mooij WT, Mortenson PN, Murray CW. Diverse, high-quality test set for the validation of protein-ligand docking performance. J Med Chem. 2007;50(4):726–741. doi: 10.1021/jm061277y. [DOI] [PubMed] [Google Scholar]
- 52.Bottegoni G, Rocchia W, Rueda M, Abagyan R, Cavalli A. Systematic exploitation of multiple receptor conformations for virtual ligand screening. PLoS ONE. 2011;6(5):e18845. doi: 10.1371/journal.pone.0018845. [DOI] [PMC free article] [PubMed] [Google Scholar]
- 53.Barril X, Morley SD. Unveiling the full potential of flexible receptor docking using multiple crystallographic structures. J Med Chem. 2005;48(13):4432–4443. doi: 10.1021/jm048972v. [DOI] [PubMed] [Google Scholar]
- 54.Rueda M, Bottegoni G, Abagyan R. Recipes for the selection of experimental protein conformations for virtual screening. J Chem Inf Model. 2010;50(1):186–193. doi: 10.1021/ci9003943. [DOI] [PMC free article] [PubMed] [Google Scholar]
- 55.Korb O, Olsson TS, Bowden SJ, Hall RJ, Verdonk ML, Liebeschuetz JW, Cole JC. Potential and Limitations of Ensemble Docking. J Chem Inf Model. 2012;52:1262–1274. doi: 10.1021/ci2005934. [DOI] [PubMed] [Google Scholar]
- 56.Mysinger MM, Carchia M, Irwin JJ, Shoichet BK. Directory of useful decoys, enhanced (DUD-E): better ligands and decoys for better benchmarking. J Med Chem. 2012;55(14):6582–6594. doi: 10.1021/jm300687e. [DOI] [PMC free article] [PubMed] [Google Scholar]
- 57.Cereto-Massague A, Guasch L, Valls C, Mulero M, Pujadas G, Garcia-Vallve S. DecoyFinder: an easy-to-use python GUI application for building target-specific decoy sets. Bioinformatics. 2012;28(12):1661–1662. doi: 10.1093/bioinformatics/bts249. [DOI] [PubMed] [Google Scholar]
- 58.Bottegoni G, Kufareva I, Totrov M, Abagyan R. A new method for ligand docking to flexible receptors by dual alanine scanning and refinement (SCARE) J Comput Aided Mol Des. 2008;22(5):311–325. doi: 10.1007/s10822-008-9188-5. [DOI] [PMC free article] [PubMed] [Google Scholar]
- 59.Kufareva I, Ilatovskiy AV, Abagyan R. Pocketome: an encyclopedia of small-molecule binding sites in 4D. Nucleic Acids Res. 2012;40:D535–540. doi: 10.1093/nar/gkr825. Database issue. [DOI] [PMC free article] [PubMed] [Google Scholar]
- 60.Sherman W, Day T, Jacobson MP, Friesner RA, Farid R. Novel procedure for modeling ligand/receptor induced fit effects. J Med Chem. 2006;49(2):534–553. doi: 10.1021/jm050540c. [DOI] [PubMed] [Google Scholar]
- 61.Wright L, Barril X, Dymock B, Sheridan L, Surgenor A, Beswick M, Drysdale M, Collier A, Massey A, Davies N, Fink A, Fromont C, Aherne W, Boxall K, Sharp S, Workman P, Hubbard RE. Structure-activity relationships in purine-based inhibitor binding to HSP90 isoforms. Chem Biol. 2004;11(6):775–785. doi: 10.1016/j.chembiol.2004.03.033. [DOI] [PubMed] [Google Scholar]
- 62.Schneider G. Virtual screening: an endless staircase? Nat Rev Drug Discov. 2010;9(4):273–276. doi: 10.1038/nrd3139. [DOI] [PubMed] [Google Scholar]
- 63.Moitessier N, Englebienne P, Lee D, Lawandi J, Corbeil CR. Towards the development of universal, fast and highly accurate docking/scoring methods: a long way to go. Br J Pharmacol. 2008;153 Suppl 1:S7–26. doi: 10.1038/sj.bjp.0707515. [DOI] [PMC free article] [PubMed] [Google Scholar]
- 64.Kitchen DB, Decornez H, Furr JR, Bajorath J. Docking and scoring in virtual screening for drug discovery: methods and applications. Nat Rev Drug Discov. 2004;3(11):935–949. doi: 10.1038/nrd1549. [DOI] [PubMed] [Google Scholar]
- 65.Hare AA, Leng L, Gandavadi S, Du X, Cournia Z, Bucala R, Jorgensen WL. Optimization of N-benzyl-benzoxazol-2-ones as receptor antagonists of macrophage migration inhibitory factor (MIF) Bioorg Med Chem Lett. 2010;20(19):5811–5814. doi: 10.1016/j.bmcl.2010.07.129. [DOI] [PMC free article] [PubMed] [Google Scholar]
- 66.Thompson DC, Humblet C, Joseph-Mc Carthy D. Investigation of MM-PBSA rescoring of docking poses. J Chem Inf Model. 2008;48(5):1081–1091. doi: 10.1021/ci700470c. [DOI] [PubMed] [Google Scholar]
- 67.Jain AN. Scoring functions for protein-ligand docking. Curr Protein Pept Sci. 2006;7(5):407–420. doi: 10.2174/138920306778559395. [DOI] [PubMed] [Google Scholar]
- 68.Kufareva I, Chen YC, Ilatovskiy AV, Abagyan R. Compound activity prediction using models of binding pockets or ligand properties in 3D. Curr Top Med Chem. 2012;12(17):1869–1882. doi: 10.2174/156802612804547335. [DOI] [PMC free article] [PubMed] [Google Scholar]
- 69.de Beer SB, Vermeulen NP, Oostenbrink C. The role of water molecules in computational drug design. Curr Top Med Chem. 2010;10(1):55–66. doi: 10.2174/156802610790232288. [DOI] [PubMed] [Google Scholar]
- 70.Totrov M. Atomic property fields: generalized 3D pharmacophoric potential for automated ligand superposition, pharmacophore elucidation and 3D QSAR. Chem Biol Drug Des. 2008;71(1):15–27. doi: 10.1111/j.1747-0285.2007.00605.x. [DOI] [PubMed] [Google Scholar]
Associated Data
This section collects any data citations, data availability statements, or supplementary materials included in this article.